Free Statistics

of Irreproducible Research!

Author's title

Author*The author of this computation has been verified*
R Software Modulerwasp_edabi.wasp
Title produced by softwareBivariate Explorative Data Analysis
Date of computationWed, 11 Nov 2009 05:50:21 -0700
Cite this page as followsStatistical Computations at FreeStatistics.org, Office for Research Development and Education, URL https://freestatistics.org/blog/index.php?v=date/2009/Nov/11/t1257944065nwggrkzxf9lgtx9.htm/, Retrieved Thu, 25 Apr 2024 14:25:10 +0000
Statistical Computations at FreeStatistics.org, Office for Research Development and Education, URL https://freestatistics.org/blog/index.php?pk=55552, Retrieved Thu, 25 Apr 2024 14:25:10 +0000
QR Codes:

Original text written by user:
IsPrivate?No (this computation is public)
User-defined keywords
Estimated Impact158
Family? (F = Feedback message, R = changed R code, M = changed R Module, P = changed Parameters, D = changed Data)
-     [Partial Correlation] [3/11/2009] [2009-11-02 21:44:54] [b98453cac15ba1066b407e146608df68]
- RMPD    [Bivariate Explorative Data Analysis] [WS6: Na zuivering...] [2009-11-11 12:50:21] [b8ce264f75295a954feffaf60221d1b0] [Current]
Feedback Forum

Post a new message
Dataseries X:
-355,051
-353,784
-354,293
-350,691
-350,155
-350,167
-349,02
-341,187
-348,266
-351,553
-349,377
-344,289
-343,656
-339,999
-344,7
-347,988
-347,58
-346,825
-345,237
-337,099
-350,251
-349,859
-345,32
-343,773
-341,272
-342,001
-346,253
-342,508
-337,708
-344,583
-338,033
-329,933
-338,326
-332,973
-335,128
-338,169
-334,62
-333,972
-334,277
-331,626
-333,494
-330,872
-322,131
-313,857
-322,424
-321,669
-328,637
-326,1
-320,355
-323,196
-330,737
-315,004
-318,118
-318,776
-310,722
-308,044
-323,375
-330,393
-331,46
-322,721
Dataseries Y:
-7,941
-6,714
-11,573
-15,211
-16,665
-15,757
7,47
12,053
1,654
3,157
6,243
14,421
19,924
22,151
17,2
22,562
19,47
22,335
46,243
55,961
44,519
41,611
37,47
45,697
54,378
54,789
50,887
48,292
49,562
47,887
66,427
78,967
73,114
82,887
77,022
84,611
86,2
86,838
80,163
77,114
77,476
75,298
96,519
99,243
88,936
86,341
77,163
85,66
89,795
88,114
76,623
82,476
79,482
77,574
97,568
100,746
88,255
69,347
59,12
64,249


Summary of computational transaction
Raw Inputview raw input (R code)
Raw Outputview raw output of R engine
Computing time5 seconds
R Server'RServer@AstonUniversity' @ vre.aston.ac.uk

\begin{tabular}{lllllllll}
\hline
Summary of computational transaction \tabularnewline
Raw Input & view raw input (R code)  \tabularnewline
Raw Output & view raw output of R engine  \tabularnewline
Computing time & 5 seconds \tabularnewline
R Server & 'RServer@AstonUniversity' @ vre.aston.ac.uk \tabularnewline
\hline
\end{tabular}
%Source: https://freestatistics.org/blog/index.php?pk=55552&T=0

[TABLE]
[ROW][C]Summary of computational transaction[/C][/ROW]
[ROW][C]Raw Input[/C][C]view raw input (R code) [/C][/ROW]
[ROW][C]Raw Output[/C][C]view raw output of R engine [/C][/ROW]
[ROW][C]Computing time[/C][C]5 seconds[/C][/ROW]
[ROW][C]R Server[/C][C]'RServer@AstonUniversity' @ vre.aston.ac.uk[/C][/ROW]
[/TABLE]
Source: https://freestatistics.org/blog/index.php?pk=55552&T=0

Globally Unique Identifier (entire table): ba.freestatistics.org/blog/index.php?pk=55552&T=0

As an alternative you can also use a QR Code:  

The GUIDs for individual cells are displayed in the table below:

Summary of computational transaction
Raw Inputview raw input (R code)
Raw Outputview raw output of R engine
Computing time5 seconds
R Server'RServer@AstonUniversity' @ vre.aston.ac.uk


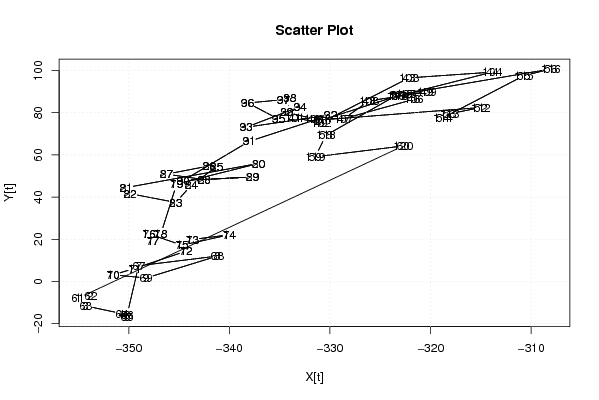
Model: Y[t] = c + b X[t] + e[t]
c893.289981816365
b2.49940715876688

\begin{tabular}{lllllllll}
\hline
Model: Y[t] = c + b X[t] + e[t] \tabularnewline
c & 893.289981816365 \tabularnewline
b & 2.49940715876688 \tabularnewline
\hline
\end{tabular}
%Source: https://freestatistics.org/blog/index.php?pk=55552&T=1

[TABLE]
[ROW][C]Model: Y[t] = c + b X[t] + e[t][/C][/ROW]
[ROW][C]c[/C][C]893.289981816365[/C][/ROW]
[ROW][C]b[/C][C]2.49940715876688[/C][/ROW]
[/TABLE]
Source: https://freestatistics.org/blog/index.php?pk=55552&T=1

Globally Unique Identifier (entire table): ba.freestatistics.org/blog/index.php?pk=55552&T=1

As an alternative you can also use a QR Code:  

The GUIDs for individual cells are displayed in the table below:

Model: Y[t] = c + b X[t] + e[t]
c893.289981816365
b2.49940715876688


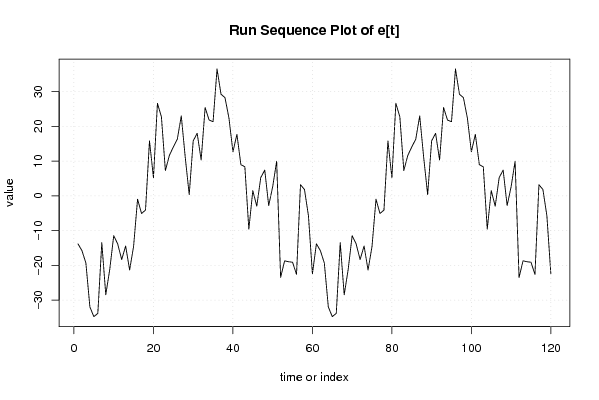
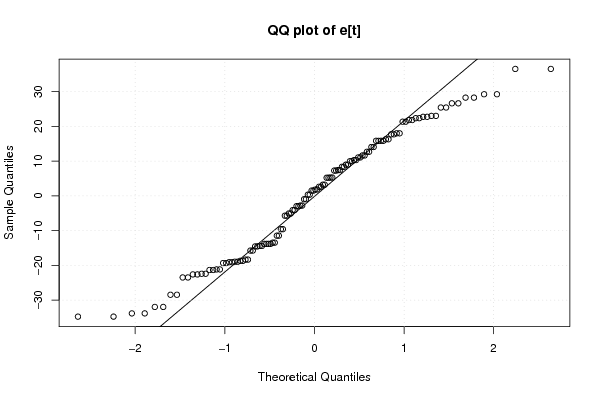
Descriptive Statistics about e[t]
# observations120
minimum-34.7750681383465
Q1-14.8466805318603
median1.67925976599568
mean1.47509319573894e-16
Q314.5094854164550
maximum36.5430376566736

\begin{tabular}{lllllllll}
\hline
Descriptive Statistics about e[t] \tabularnewline
# observations & 120 \tabularnewline
minimum & -34.7750681383465 \tabularnewline
Q1 & -14.8466805318603 \tabularnewline
median & 1.67925976599568 \tabularnewline
mean & 1.47509319573894e-16 \tabularnewline
Q3 & 14.5094854164550 \tabularnewline
maximum & 36.5430376566736 \tabularnewline
\hline
\end{tabular}
%Source: https://freestatistics.org/blog/index.php?pk=55552&T=2

[TABLE]
[ROW][C]Descriptive Statistics about e[t][/C][/ROW]
[ROW][C]# observations[/C][C]120[/C][/ROW]
[ROW][C]minimum[/C][C]-34.7750681383465[/C][/ROW]
[ROW][C]Q1[/C][C]-14.8466805318603[/C][/ROW]
[ROW][C]median[/C][C]1.67925976599568[/C][/ROW]
[ROW][C]mean[/C][C]1.47509319573894e-16[/C][/ROW]
[ROW][C]Q3[/C][C]14.5094854164550[/C][/ROW]
[ROW][C]maximum[/C][C]36.5430376566736[/C][/ROW]
[/TABLE]
Source: https://freestatistics.org/blog/index.php?pk=55552&T=2

Globally Unique Identifier (entire table): ba.freestatistics.org/blog/index.php?pk=55552&T=2

As an alternative you can also use a QR Code:  

The GUIDs for individual cells are displayed in the table below:

Descriptive Statistics about e[t]
# observations120
minimum-34.7750681383465
Q1-14.8466805318603
median1.67925976599568
mean1.47509319573894e-16
Q314.5094854164550
maximum36.5430376566736


Parameters (Session):
par1 = 0 ; par2 = 36 ;
Parameters (R input):
par1 = 0 ; par2 = 36 ;
R code (references can be found in the software module):
par1 <- as.numeric(par1)
par2 <- as.numeric(par2)
x <- as.ts(x)
y <- as.ts(y)
mylm <- lm(y~x)
cbind(mylm$resid)
library(lattice)
bitmap(file='pic1.png')
plot(y,type='l',main='Run Sequence Plot of Y[t]',xlab='time or index',ylab='value')
grid()
dev.off()
bitmap(file='pic1a.png')
plot(x,type='l',main='Run Sequence Plot of X[t]',xlab='time or index',ylab='value')
grid()
dev.off()
bitmap(file='pic1b.png')
plot(x,y,main='Scatter Plot',xlab='X[t]',ylab='Y[t]')
grid()
dev.off()
bitmap(file='pic1c.png')
plot(mylm$resid,type='l',main='Run Sequence Plot of e[t]',xlab='time or index',ylab='value')
grid()
dev.off()
bitmap(file='pic2.png')
hist(mylm$resid,main='Histogram of e[t]')
dev.off()
bitmap(file='pic3.png')
if (par1 > 0)
{
densityplot(~mylm$resid,col='black',main=paste('Density Plot of e[t] bw = ',par1),bw=par1)
} else {
densityplot(~mylm$resid,col='black',main='Density Plot of e[t]')
}
dev.off()
bitmap(file='pic4.png')
qqnorm(mylm$resid,main='QQ plot of e[t]')
qqline(mylm$resid)
grid()
dev.off()
if (par2 > 0)
{
bitmap(file='pic5.png')
acf(mylm$resid,lag.max=par2,main='Residual Autocorrelation Function')
grid()
dev.off()
}
summary(x)
load(file='createtable')
a<-table.start()
a<-table.row.start(a)
a<-table.element(a,'Model: Y[t] = c + b X[t] + e[t]',2,TRUE)
a<-table.row.end(a)
a<-table.row.start(a)
a<-table.element(a,'c',1,TRUE)
a<-table.element(a,mylm$coeff[[1]])
a<-table.row.end(a)
a<-table.row.start(a)
a<-table.element(a,'b',1,TRUE)
a<-table.element(a,mylm$coeff[[2]])
a<-table.row.end(a)
a<-table.end(a)
table.save(a,file='mytable.tab')
a<-table.start()
a<-table.row.start(a)
a<-table.element(a,'Descriptive Statistics about e[t]',2,TRUE)
a<-table.row.end(a)
a<-table.row.start(a)
a<-table.element(a,'# observations',header=TRUE)
a<-table.element(a,length(mylm$resid))
a<-table.row.end(a)
a<-table.row.start(a)
a<-table.element(a,'minimum',header=TRUE)
a<-table.element(a,min(mylm$resid))
a<-table.row.end(a)
a<-table.row.start(a)
a<-table.element(a,'Q1',header=TRUE)
a<-table.element(a,quantile(mylm$resid,0.25))
a<-table.row.end(a)
a<-table.row.start(a)
a<-table.element(a,'median',header=TRUE)
a<-table.element(a,median(mylm$resid))
a<-table.row.end(a)
a<-table.row.start(a)
a<-table.element(a,'mean',header=TRUE)
a<-table.element(a,mean(mylm$resid))
a<-table.row.end(a)
a<-table.row.start(a)
a<-table.element(a,'Q3',header=TRUE)
a<-table.element(a,quantile(mylm$resid,0.75))
a<-table.row.end(a)
a<-table.row.start(a)
a<-table.element(a,'maximum',header=TRUE)
a<-table.element(a,max(mylm$resid))
a<-table.row.end(a)
a<-table.end(a)
table.save(a,file='mytable.tab')