Free Statistics
of Irreproducible Research!
Description of Statistical Computation | |||||||||||||||||||||||||||||||||||||||||||||
|---|---|---|---|---|---|---|---|---|---|---|---|---|---|---|---|---|---|---|---|---|---|---|---|---|---|---|---|---|---|---|---|---|---|---|---|---|---|---|---|---|---|---|---|---|---|
| Author's title | |||||||||||||||||||||||||||||||||||||||||||||
| Author | *The author of this computation has been verified* | ||||||||||||||||||||||||||||||||||||||||||||
| R Software Module | rwasp_kendall.wasp | ||||||||||||||||||||||||||||||||||||||||||||
| Title produced by software | Kendall tau Rank Correlation | ||||||||||||||||||||||||||||||||||||||||||||
| Date of computation | Wed, 11 Nov 2009 03:05:15 -0700 | ||||||||||||||||||||||||||||||||||||||||||||
| Cite this page as follows | Statistical Computations at FreeStatistics.org, Office for Research Development and Education, URL https://freestatistics.org/blog/index.php?v=date/2009/Nov/11/t1257933973w2xnvycyz7ikvvp.htm/, Retrieved Thu, 25 Apr 2024 22:03:44 +0000 | ||||||||||||||||||||||||||||||||||||||||||||
| Statistical Computations at FreeStatistics.org, Office for Research Development and Education, URL https://freestatistics.org/blog/index.php?pk=55455, Retrieved Thu, 25 Apr 2024 22:03:44 +0000 | |||||||||||||||||||||||||||||||||||||||||||||
| QR Codes: | |||||||||||||||||||||||||||||||||||||||||||||
|
| |||||||||||||||||||||||||||||||||||||||||||||
| Original text written by user: | |||||||||||||||||||||||||||||||||||||||||||||
| IsPrivate? | No (this computation is public) | ||||||||||||||||||||||||||||||||||||||||||||
| User-defined keywords | |||||||||||||||||||||||||||||||||||||||||||||
| Estimated Impact | 206 | ||||||||||||||||||||||||||||||||||||||||||||
Tree of Dependent Computations | |||||||||||||||||||||||||||||||||||||||||||||
| Family? (F = Feedback message, R = changed R code, M = changed R Module, P = changed Parameters, D = changed Data) | |||||||||||||||||||||||||||||||||||||||||||||
| - [Bivariate Explorative Data Analysis] [Workshop 5: Bivar...] [2009-10-30 14:46:53] [1433a524809eda02c3198b3ae6eebb69] - RMPD [Kendall tau Rank Correlation] [Rev1-BivEDA-Corre...] [2009-11-11 10:05:15] [36295456a56d4c7dcc9b9537ce63463b] [Current] | |||||||||||||||||||||||||||||||||||||||||||||
| Feedback Forum | |||||||||||||||||||||||||||||||||||||||||||||
Post a new message | |||||||||||||||||||||||||||||||||||||||||||||
Dataset | |||||||||||||||||||||||||||||||||||||||||||||
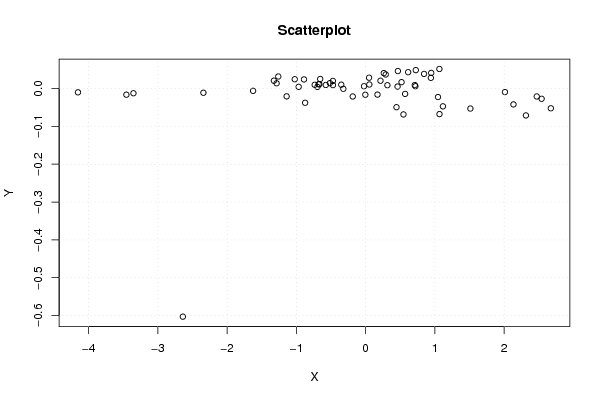
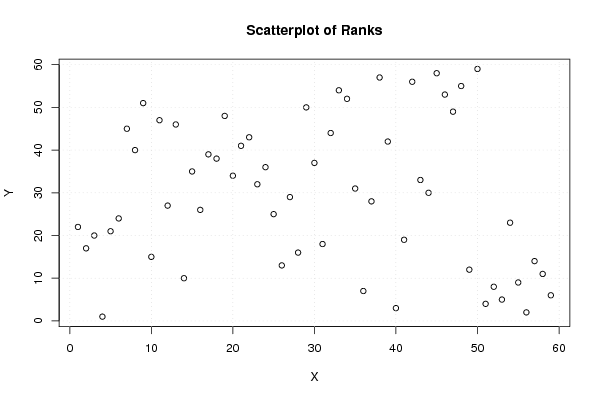
| Dataseries X: | |||||||||||||||||||||||||||||||||||||||||||||
0.461486645 -0.004084972 -0.022949858 0.314235793 0.719086015 0.519010603 0.214639302 0.724751373 0.947471981 0.942293662 1.06557672 0.290473814 0.466120842 0.844038098 0.614769703 0.262528017 -0.351824955 0.049966352 0.053616259 -0.321937027 -0.471965568 -0.57493886 -0.966618095 -0.889742211 -0.735032602 -0.678409402 -0.695641924 -0.471580389 -0.516139175 -0.668427732 -1.285444229 -1.261260411 -1.324871567 -1.625105921 -1.023530639 -0.655808986 -0.185705033 0.171733303 0.570691931 0.710504447 1.116546865 1.045570694 2.012784886 2.471584571 2.54198808 2.135458622 2.675297587 2.315305706 1.513051716 1.066878896 0.546485598 0.446071879 -0.873384 -1.141009819 -2.342678843 -3.455050932 -4.154431398 -3.353127131 -2.63931828 | |||||||||||||||||||||||||||||||||||||||||||||
| Dataseries Y: | |||||||||||||||||||||||||||||||||||||||||||||
0.005146 -0.016437 0.006005 0.008702 0.006065 0.016797 0.020605 0.048558 0.041351 0.028252 0.051707 0.037076 0.046126 0.038562 0.043101 0.040678 0.010128 0.028543 0.010615 -0.000725 0.020013 0.009351 0.004490 0.023993 0.009841 0.011276 0.004274 0.009074 0.014261 0.011233 0.013814 0.031786 0.020695 -0.006130 0.024601 0.025193 -0.021078 -0.016113 -0.014245 0.009134 -0.047135 -0.022520 -0.009361 -0.021052 -0.027148 -0.041973 -0.052227 -0.071104 -0.052942 -0.067569 -0.068452 -0.049375 -0.037657 -0.020642 -0.011183 -0.016302 -0.010016 -0.012496 -0.602865 | |||||||||||||||||||||||||||||||||||||||||||||
Tables (Output of Computation) | |||||||||||||||||||||||||||||||||||||||||||||
| |||||||||||||||||||||||||||||||||||||||||||||
Figures (Output of Computation) | |||||||||||||||||||||||||||||||||||||||||||||
Input Parameters & R Code | |||||||||||||||||||||||||||||||||||||||||||||
| Parameters (Session): | |||||||||||||||||||||||||||||||||||||||||||||
| Parameters (R input): | |||||||||||||||||||||||||||||||||||||||||||||
| R code (references can be found in the software module): | |||||||||||||||||||||||||||||||||||||||||||||
library('Kendall') | |||||||||||||||||||||||||||||||||||||||||||||