Free Statistics
of Irreproducible Research!
Description of Statistical Computation | |||||||||||||||||||||||||||||||||||||||||
|---|---|---|---|---|---|---|---|---|---|---|---|---|---|---|---|---|---|---|---|---|---|---|---|---|---|---|---|---|---|---|---|---|---|---|---|---|---|---|---|---|---|
| Author's title | |||||||||||||||||||||||||||||||||||||||||
| Author | *The author of this computation has been verified* | ||||||||||||||||||||||||||||||||||||||||
| R Software Module | rwasp_univariatedataseries.wasp | ||||||||||||||||||||||||||||||||||||||||
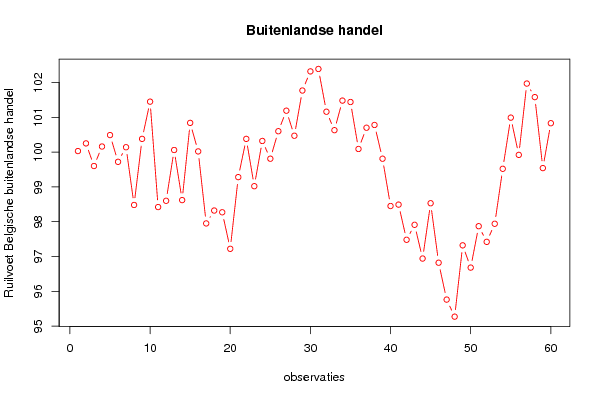
| Title produced by software | Univariate Data Series | ||||||||||||||||||||||||||||||||||||||||
| Date of computation | Wed, 11 Nov 2009 01:16:12 -0700 | ||||||||||||||||||||||||||||||||||||||||
| Cite this page as follows | Statistical Computations at FreeStatistics.org, Office for Research Development and Education, URL https://freestatistics.org/blog/index.php?v=date/2009/Nov/11/t12579274565uixqpvz3ewmzpr.htm/, Retrieved Fri, 19 Apr 2024 09:23:29 +0000 | ||||||||||||||||||||||||||||||||||||||||
| Statistical Computations at FreeStatistics.org, Office for Research Development and Education, URL https://freestatistics.org/blog/index.php?pk=55438, Retrieved Fri, 19 Apr 2024 09:23:29 +0000 | |||||||||||||||||||||||||||||||||||||||||
| QR Codes: | |||||||||||||||||||||||||||||||||||||||||
|
| |||||||||||||||||||||||||||||||||||||||||
| Original text written by user: | |||||||||||||||||||||||||||||||||||||||||
| IsPrivate? | No (this computation is public) | ||||||||||||||||||||||||||||||||||||||||
| User-defined keywords | |||||||||||||||||||||||||||||||||||||||||
| Estimated Impact | 234 | ||||||||||||||||||||||||||||||||||||||||
Tree of Dependent Computations | |||||||||||||||||||||||||||||||||||||||||
| Family? (F = Feedback message, R = changed R code, M = changed R Module, P = changed Parameters, D = changed Data) | |||||||||||||||||||||||||||||||||||||||||
| - [Univariate Data Series] [] [2009-11-05 08:15:26] [74be16979710d4c4e7c6647856088456] - PD [Univariate Data Series] [] [2009-11-11 08:16:12] [d41d8cd98f00b204e9800998ecf8427e] [Current] - RMP [ARIMA Forecasting] [] [2009-12-04 14:34:06] [5d885a68c2332cc44f6191ec94766bfa] - P [ARIMA Forecasting] [] [2009-12-06 15:38:09] [5d885a68c2332cc44f6191ec94766bfa] - R PD [Univariate Data Series] [Registratie van n...] [2009-12-04 14:41:53] [fa71ec4c741ffec745cb91dcbd756720] - RMP [ARIMA Forecasting] [] [2009-12-06 18:23:17] [5d885a68c2332cc44f6191ec94766bfa] - R PD [ARIMA Forecasting] [ARIMA Forecasting] [2009-12-12 14:17:13] [4f1a20f787b3465111b61213cdeef1a9] - PD [ARIMA Forecasting] [] [2009-12-21 11:21:06] [5d885a68c2332cc44f6191ec94766bfa] - PD [Univariate Data Series] [] [2009-12-18 19:53:11] [5d885a68c2332cc44f6191ec94766bfa] - PD [Univariate Data Series] [] [2009-12-19 10:32:23] [5d885a68c2332cc44f6191ec94766bfa] - R PD [Univariate Data Series] [paper20] [2011-12-20 16:22:23] [74be16979710d4c4e7c6647856088456] - R D [Univariate Data Series] [paper21] [2011-12-20 16:23:53] [74be16979710d4c4e7c6647856088456] - RMPD [Percentiles] [paper22] [2011-12-20 18:07:47] [f7a862281046b7153543b12c78921b36] - RMP [Percentiles] [paper23] [2011-12-20 18:08:49] [f7a862281046b7153543b12c78921b36] | |||||||||||||||||||||||||||||||||||||||||
| Feedback Forum | |||||||||||||||||||||||||||||||||||||||||
Post a new message | |||||||||||||||||||||||||||||||||||||||||
Dataset | |||||||||||||||||||||||||||||||||||||||||
| Dataseries X: | |||||||||||||||||||||||||||||||||||||||||
100.03 100.25 99.6 100.16 100.49 99.72 100.14 98.48 100.38 101.45 98.42 98.6 100.06 98.62 100.84 100.02 97.95 98.32 98.27 97.22 99.28 100.38 99.02 100.32 99.81 100.6 101.19 100.47 101.77 102.32 102.39 101.16 100.63 101.48 101.44 100.09 100.7 100.78 99.81 98.45 98.49 97.48 97.91 96.94 98.53 96.82 95.76 95.27 97.32 96.68 97.87 97.42 97.94 99.52 100.99 99.92 101.97 101.58 99.54 100.83 | |||||||||||||||||||||||||||||||||||||||||
Tables (Output of Computation) | |||||||||||||||||||||||||||||||||||||||||
| |||||||||||||||||||||||||||||||||||||||||
Figures (Output of Computation) | |||||||||||||||||||||||||||||||||||||||||
Input Parameters & R Code | |||||||||||||||||||||||||||||||||||||||||
| Parameters (Session): | |||||||||||||||||||||||||||||||||||||||||
| par1 = Ruilvoet van de buitenlandse handel van Belgi� ; par2 = http://www.nbb.be/belgostat/PresentationLinker?TableId=365000036&Lang=N ; par3 = Ruilvoet van de buitenlandse handel van Belgi� volgens het nationaal concept - Maandelijks indexcijfer (2000=100) ; | |||||||||||||||||||||||||||||||||||||||||
| Parameters (R input): | |||||||||||||||||||||||||||||||||||||||||
| par1 = Ruilvoet van de buitenlandse handel van Belgi� ; par2 = http://www.nbb.be/belgostat/PresentationLinker?TableId=365000036&Lang=N ; par3 = Ruilvoet van de buitenlandse handel van Belgi� volgens het nationaal concept - Maandelijks indexcijfer (2000=100) ; | |||||||||||||||||||||||||||||||||||||||||
| R code (references can be found in the software module): | |||||||||||||||||||||||||||||||||||||||||
bitmap(file='test1.png') | |||||||||||||||||||||||||||||||||||||||||