Free Statistics
of Irreproducible Research!
Description of Statistical Computation | |||||||||||||||||||||
|---|---|---|---|---|---|---|---|---|---|---|---|---|---|---|---|---|---|---|---|---|---|
| Author's title | |||||||||||||||||||||
| Author | *The author of this computation has been verified* | ||||||||||||||||||||
| R Software Module | rwasp_backtobackhist.wasp | ||||||||||||||||||||
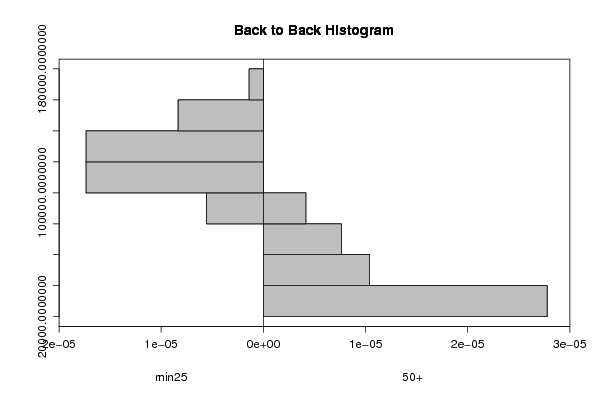
| Title produced by software | Back to Back Histogram | ||||||||||||||||||||
| Date of computation | Tue, 10 Nov 2009 10:14:24 -0700 | ||||||||||||||||||||
| Cite this page as follows | Statistical Computations at FreeStatistics.org, Office for Research Development and Education, URL https://freestatistics.org/blog/index.php?v=date/2009/Nov/10/t12578733613v0n5zqokp51g2a.htm/, Retrieved Sun, 05 May 2024 21:47:04 +0000 | ||||||||||||||||||||
| Statistical Computations at FreeStatistics.org, Office for Research Development and Education, URL https://freestatistics.org/blog/index.php?pk=55318, Retrieved Sun, 05 May 2024 21:47:04 +0000 | |||||||||||||||||||||
| QR Codes: | |||||||||||||||||||||
|
| |||||||||||||||||||||
| Original text written by user: | |||||||||||||||||||||
| IsPrivate? | No (this computation is public) | ||||||||||||||||||||
| User-defined keywords | |||||||||||||||||||||
| Estimated Impact | 198 | ||||||||||||||||||||
Tree of Dependent Computations | |||||||||||||||||||||
| Family? (F = Feedback message, R = changed R code, M = changed R Module, P = changed Parameters, D = changed Data) | |||||||||||||||||||||
| - [Box-Cox Linearity Plot] [3/11/2009] [2009-11-02 21:47:57] [b98453cac15ba1066b407e146608df68] - RMPD [Back to Back Histogram] [] [2009-11-10 17:14:24] [6dfcce621b31349cab7f0d189e6f8a9d] [Current] - R PD [Back to Back Histogram] [Back-to-back hist...] [2009-12-19 12:48:25] [fa71ec4c741ffec745cb91dcbd756720] - R PD [Back to Back Histogram] [Back-to-back hist...] [2009-12-19 12:52:28] [fa71ec4c741ffec745cb91dcbd756720] - PD [Back to Back Histogram] [Paper] [2010-12-26 08:55:54] [24bb5b06bd1854f48aebec8f44957ed0] | |||||||||||||||||||||
| Feedback Forum | |||||||||||||||||||||
Post a new message | |||||||||||||||||||||
Dataset | |||||||||||||||||||||
| Dataseries X: | |||||||||||||||||||||
116222 110924 103753 99983 93302 91496 119321 139261 133739 123913 113438 109416 109406 105645 101328 97686 93093 91382 122257 139183 139887 131822 116805 113706 113012 110452 107005 102841 98173 98181 137277 147579 146571 138920 130340 128140 127059 122860 117702 113537 108366 111078 150739 159129 157928 147768 137507 136919 136151 133001 125554 119647 114158 116193 152803 161761 160942 149470 139208 134588 130322 126611 122401 117352 112135 112879 148729 157230 157221 146681 136524 132111 | |||||||||||||||||||||
| Dataseries Y: | |||||||||||||||||||||
31899 31384 30650 30400 30003 29896 31557 31883 30830 30354 29756 29934 30599 30378 29925 29471 29567 29419 30796 31475 31708 31917 30871 31512 32362 31928 31699 30363 30386 30364 32806 33423 33071 33888 34805 35489 37259 37722 38764 39594 40004 40715 44028 45564 44277 44976 45406 47379 49200 50221 51573 53091 53337 54978 57885 67099 67169 69796 70600 71982 73957 75273 76322 77078 77954 79238 82179 83834 83744 84861 86478 88290 | |||||||||||||||||||||
Tables (Output of Computation) | |||||||||||||||||||||
| |||||||||||||||||||||
Figures (Output of Computation) | |||||||||||||||||||||
Input Parameters & R Code | |||||||||||||||||||||
| Parameters (Session): | |||||||||||||||||||||
| par1 = red ; par2 = blue ; par3 = TRUE ; par4 = iptot ; par5 = ipkl ; | |||||||||||||||||||||
| Parameters (R input): | |||||||||||||||||||||
| par1 = grey ; par2 = grey ; par3 = TRUE ; par4 = min25 ; par5 = 50+ ; | |||||||||||||||||||||
| R code (references can be found in the software module): | |||||||||||||||||||||
if (par3 == 'TRUE') par3 <- TRUE | |||||||||||||||||||||