Free Statistics
of Irreproducible Research!
Description of Statistical Computation | |||||||||||||||||||||||||||||||||||||||||||||||||||||||||||||||||||||
|---|---|---|---|---|---|---|---|---|---|---|---|---|---|---|---|---|---|---|---|---|---|---|---|---|---|---|---|---|---|---|---|---|---|---|---|---|---|---|---|---|---|---|---|---|---|---|---|---|---|---|---|---|---|---|---|---|---|---|---|---|---|---|---|---|---|---|---|---|---|
| Author's title | |||||||||||||||||||||||||||||||||||||||||||||||||||||||||||||||||||||
| Author | *The author of this computation has been verified* | ||||||||||||||||||||||||||||||||||||||||||||||||||||||||||||||||||||
| R Software Module | rwasp_pairs.wasp | ||||||||||||||||||||||||||||||||||||||||||||||||||||||||||||||||||||
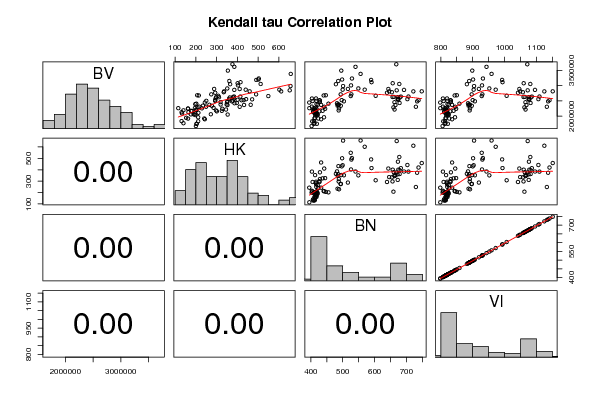
| Title produced by software | Kendall tau Correlation Matrix | ||||||||||||||||||||||||||||||||||||||||||||||||||||||||||||||||||||
| Date of computation | Tue, 10 Nov 2009 03:22:22 -0700 | ||||||||||||||||||||||||||||||||||||||||||||||||||||||||||||||||||||
| Cite this page as follows | Statistical Computations at FreeStatistics.org, Office for Research Development and Education, URL https://freestatistics.org/blog/index.php?v=date/2009/Nov/10/t12578486012jht80uibqif9b9.htm/, Retrieved Mon, 06 May 2024 06:01:06 +0000 | ||||||||||||||||||||||||||||||||||||||||||||||||||||||||||||||||||||
| Statistical Computations at FreeStatistics.org, Office for Research Development and Education, URL https://freestatistics.org/blog/index.php?pk=55137, Retrieved Mon, 06 May 2024 06:01:06 +0000 | |||||||||||||||||||||||||||||||||||||||||||||||||||||||||||||||||||||
| QR Codes: | |||||||||||||||||||||||||||||||||||||||||||||||||||||||||||||||||||||
|
| |||||||||||||||||||||||||||||||||||||||||||||||||||||||||||||||||||||
| Original text written by user: | |||||||||||||||||||||||||||||||||||||||||||||||||||||||||||||||||||||
| IsPrivate? | No (this computation is public) | ||||||||||||||||||||||||||||||||||||||||||||||||||||||||||||||||||||
| User-defined keywords | |||||||||||||||||||||||||||||||||||||||||||||||||||||||||||||||||||||
| Estimated Impact | 157 | ||||||||||||||||||||||||||||||||||||||||||||||||||||||||||||||||||||
Tree of Dependent Computations | |||||||||||||||||||||||||||||||||||||||||||||||||||||||||||||||||||||
| Family? (F = Feedback message, R = changed R code, M = changed R Module, P = changed Parameters, D = changed Data) | |||||||||||||||||||||||||||||||||||||||||||||||||||||||||||||||||||||
| - [Kendall tau Correlation Matrix] [3/11/2009] [2009-11-02 21:25:00] [b98453cac15ba1066b407e146608df68] - D [Kendall tau Correlation Matrix] [ws2] [2009-11-10 10:22:22] [94ba0ef70f5b330d175ff4daa1c9cd40] [Current] | |||||||||||||||||||||||||||||||||||||||||||||||||||||||||||||||||||||
| Feedback Forum | |||||||||||||||||||||||||||||||||||||||||||||||||||||||||||||||||||||
Post a new message | |||||||||||||||||||||||||||||||||||||||||||||||||||||||||||||||||||||
Dataset | |||||||||||||||||||||||||||||||||||||||||||||||||||||||||||||||||||||
| Dataseries X: | |||||||||||||||||||||||||||||||||||||||||||||||||||||||||||||||||||||
2259703 115 395.3 798.6 2444005 243 395.1 798.4 2576401 384 403.5 806.8 2309146 216 403.3 806.6 2493971 293 405.7 809 2188754 140 406.7 810 2128515 131 407.2 810.5 2248771 162 412.4 815.7 2125552 164 415.9 819.2 2204434 200 414 817.3 1765972 140 411.8 815.1 1835861 131 409.9 813.2 2087121 133 412.4 815.7 2170744 179 415.9 819.2 2577245 295 416.3 819.6 2500625 250 417.2 820.5 2370817 265 421.8 825.1 2033775 197 421.4 824.7 2162554 179 415.1 818.4 1943964 153 412.4 815.7 1917423 162 411.8 815.1 2260681 195 408.8 812.1 1828487 211 404.5 807.8 1673658 200 402.5 805.8 1746814 203 409.4 812.7 2197119 203 410.7 814 2050797 353 413.4 816.7 2272390 285 415.2 818.5 2079219 197 417.7 821 2242532 162 417.8 821.1 2392286 197 417.9 821.2 2056150 176 418.4 821.7 2108444 212 418.2 821.5 2060266 272 416.6 819.9 1747495 204 418.9 822.2 2059217 189 421 824.3 1921030 240 423.5 826.8 1895979 243 432.3 835.6 2369584 464 432.3 835.6 2506099 378 428.6 831.9 2156596 301 426.7 830 2522368 293 427.3 830.6 2460648 319 428.5 831.8 2173272 325 437 840.3 2304310 411 442 845.3 2239807 327 444.9 848.2 1961006 211 441.4 844.7 2675929 214 440.3 843.6 2683265 206 447.1 850.4 2407253 202 455.3 858.6 3045566 365 478.6 881.9 2365409 432 486.5 889.8 2379364 319 487.8 891.1 3150342 361 485.9 889.2 2341189 234 483.8 887.1 2254773 229 488.4 891.7 2337912 277 494 897.3 2712988 274 493.6 896.9 2185444 297 487.3 890.6 2420840 386 482.1 885.4 2380842 348 484.2 887.5 2523958 430 496.8 900.1 2983983 656 501.1 904.4 2865389 440 499.8 903.1 3490844 354 495.5 898.8 3198770 501 498.1 901.4 2484559 352 503.8 907.1 2890255 288 516.2 919.5 3007413 403 526.1 929.4 2713443 490 527.1 930.4 2656410 549 525.1 928.4 3232194 503 528.9 932.2 3615139 385 540.1 943.4 2905958 351 549 952.3 3383619 657 556 959.3 2865686 602 568.9 972.2 3185367 491 589.1 992.4 3110915 415 590.3 993.6 2665099 308 603.3 1006.6 2763832 293 638.8 1042.1 2887458 411 643 1046.3 3076986 401 656.7 1060 2626692 298 656.1 1059.4 2782998 334 654.1 1057.4 2628939 379 659.9 1063.2 2454307 350 662.1 1065.4 2844926 652 669.2 1072.5 2548952 471 673.1 1076.4 2429593 397 678.3 1081.6 3052758 512 677.4 1080.7 2610175 363 678.5 1081.8 2618184 311 672.4 1075.7 2363387 352 665.3 1068.6 3699616 376 667.9 1071.2 2563593 360 672.1 1075.4 2215478 345 662.5 1065.8 2639036 414 682.3 1085.6 2859271 385 692.1 1095.4 2554225 442 702.7 1106 2809697 611 721.4 1124.7 2481829 374 733.2 1136.5 2812053 459 747.7 1151 2519658 420 737.6 1140.9 2305688 249 729.3 1132.6 2640975 384 706.1 1109.4 2535552 401 674.3 1077.6 2285721 208 659 1062.3 2811647 336 645.7 1049 | |||||||||||||||||||||||||||||||||||||||||||||||||||||||||||||||||||||
Tables (Output of Computation) | |||||||||||||||||||||||||||||||||||||||||||||||||||||||||||||||||||||
| |||||||||||||||||||||||||||||||||||||||||||||||||||||||||||||||||||||
Figures (Output of Computation) | |||||||||||||||||||||||||||||||||||||||||||||||||||||||||||||||||||||
Input Parameters & R Code | |||||||||||||||||||||||||||||||||||||||||||||||||||||||||||||||||||||
| Parameters (Session): | |||||||||||||||||||||||||||||||||||||||||||||||||||||||||||||||||||||
| Parameters (R input): | |||||||||||||||||||||||||||||||||||||||||||||||||||||||||||||||||||||
| R code (references can be found in the software module): | |||||||||||||||||||||||||||||||||||||||||||||||||||||||||||||||||||||
panel.tau <- function(x, y, digits=2, prefix='', cex.cor) | |||||||||||||||||||||||||||||||||||||||||||||||||||||||||||||||||||||