Free Statistics
of Irreproducible Research!
Description of Statistical Computation | |||||||||||||||||||||||||||||||||||||||||||||||||||||||||||||||||||||||||||||||||||||||||||||||||||||||||||||||||||||||||||||||||||||||||||||
|---|---|---|---|---|---|---|---|---|---|---|---|---|---|---|---|---|---|---|---|---|---|---|---|---|---|---|---|---|---|---|---|---|---|---|---|---|---|---|---|---|---|---|---|---|---|---|---|---|---|---|---|---|---|---|---|---|---|---|---|---|---|---|---|---|---|---|---|---|---|---|---|---|---|---|---|---|---|---|---|---|---|---|---|---|---|---|---|---|---|---|---|---|---|---|---|---|---|---|---|---|---|---|---|---|---|---|---|---|---|---|---|---|---|---|---|---|---|---|---|---|---|---|---|---|---|---|---|---|---|---|---|---|---|---|---|---|---|---|---|---|---|
| Author's title | |||||||||||||||||||||||||||||||||||||||||||||||||||||||||||||||||||||||||||||||||||||||||||||||||||||||||||||||||||||||||||||||||||||||||||||
| Author | *Unverified author* | ||||||||||||||||||||||||||||||||||||||||||||||||||||||||||||||||||||||||||||||||||||||||||||||||||||||||||||||||||||||||||||||||||||||||||||
| R Software Module | rwasp_notchedbox1.wasp | ||||||||||||||||||||||||||||||||||||||||||||||||||||||||||||||||||||||||||||||||||||||||||||||||||||||||||||||||||||||||||||||||||||||||||||
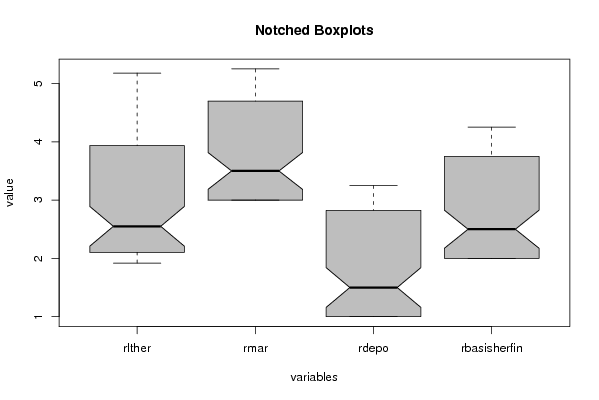
| Title produced by software | Notched Boxplots | ||||||||||||||||||||||||||||||||||||||||||||||||||||||||||||||||||||||||||||||||||||||||||||||||||||||||||||||||||||||||||||||||||||||||||||
| Date of computation | Mon, 09 Nov 2009 12:59:26 -0700 | ||||||||||||||||||||||||||||||||||||||||||||||||||||||||||||||||||||||||||||||||||||||||||||||||||||||||||||||||||||||||||||||||||||||||||||
| Cite this page as follows | Statistical Computations at FreeStatistics.org, Office for Research Development and Education, URL https://freestatistics.org/blog/index.php?v=date/2009/Nov/09/t1257796812ugbzm7tlikoudcv.htm/, Retrieved Fri, 19 Apr 2024 07:08:49 +0000 | ||||||||||||||||||||||||||||||||||||||||||||||||||||||||||||||||||||||||||||||||||||||||||||||||||||||||||||||||||||||||||||||||||||||||||||
| Statistical Computations at FreeStatistics.org, Office for Research Development and Education, URL https://freestatistics.org/blog/index.php?pk=54972, Retrieved Fri, 19 Apr 2024 07:08:49 +0000 | |||||||||||||||||||||||||||||||||||||||||||||||||||||||||||||||||||||||||||||||||||||||||||||||||||||||||||||||||||||||||||||||||||||||||||||
| QR Codes: | |||||||||||||||||||||||||||||||||||||||||||||||||||||||||||||||||||||||||||||||||||||||||||||||||||||||||||||||||||||||||||||||||||||||||||||
|
| |||||||||||||||||||||||||||||||||||||||||||||||||||||||||||||||||||||||||||||||||||||||||||||||||||||||||||||||||||||||||||||||||||||||||||||
| Original text written by user: | |||||||||||||||||||||||||||||||||||||||||||||||||||||||||||||||||||||||||||||||||||||||||||||||||||||||||||||||||||||||||||||||||||||||||||||
| IsPrivate? | No (this computation is public) | ||||||||||||||||||||||||||||||||||||||||||||||||||||||||||||||||||||||||||||||||||||||||||||||||||||||||||||||||||||||||||||||||||||||||||||
| User-defined keywords | |||||||||||||||||||||||||||||||||||||||||||||||||||||||||||||||||||||||||||||||||||||||||||||||||||||||||||||||||||||||||||||||||||||||||||||
| Estimated Impact | 138 | ||||||||||||||||||||||||||||||||||||||||||||||||||||||||||||||||||||||||||||||||||||||||||||||||||||||||||||||||||||||||||||||||||||||||||||
Tree of Dependent Computations | |||||||||||||||||||||||||||||||||||||||||||||||||||||||||||||||||||||||||||||||||||||||||||||||||||||||||||||||||||||||||||||||||||||||||||||
| Family? (F = Feedback message, R = changed R code, M = changed R Module, P = changed Parameters, D = changed Data) | |||||||||||||||||||||||||||||||||||||||||||||||||||||||||||||||||||||||||||||||||||||||||||||||||||||||||||||||||||||||||||||||||||||||||||||
| - [Notched Boxplots] [3/11/2009] [2009-11-02 21:10:41] [b98453cac15ba1066b407e146608df68] - R D [Notched Boxplots] [WS6 notched boxplots] [2009-11-09 19:59:26] [5d37783481a916b2505b66314b556267] [Current] - [Notched Boxplots] [WS6 notched boxpl...] [2009-11-13 08:20:12] [517ac0676608e46c618c738721d88e41] - RMPD [Univariate Explorative Data Analysis] [WS6 rensequence p...] [2009-11-13 08:56:44] [517ac0676608e46c618c738721d88e41] - RMPD [Univariate Explorative Data Analysis] [ws6 lange termijn...] [2009-11-13 08:58:51] [517ac0676608e46c618c738721d88e41] - RMPD [Univariate Explorative Data Analysis] [WS5 resequence pl...] [2009-11-13 09:01:05] [868ad9c0049635b9b2c3848f186e9622] - RMPD [Univariate Explorative Data Analysis] [WS6 rente basis her] [2009-11-13 09:02:55] [868ad9c0049635b9b2c3848f186e9622] - RMPD [Univariate Explorative Data Analysis] [WS6 resequence pl...] [2009-11-13 09:04:42] [517ac0676608e46c618c738721d88e41] - PD [Notched Boxplots] [WS 6 notched box ...] [2009-11-13 09:28:07] [517ac0676608e46c618c738721d88e41] - RMPD [Back to Back Histogram] [WS6 back 2 back] [2009-11-13 09:58:14] [517ac0676608e46c618c738721d88e41] - RMPD [Kendall tau Correlation Matrix] [WS6 kendel tau] [2009-11-13 10:01:59] [517ac0676608e46c618c738721d88e41] | |||||||||||||||||||||||||||||||||||||||||||||||||||||||||||||||||||||||||||||||||||||||||||||||||||||||||||||||||||||||||||||||||||||||||||||
| Feedback Forum | |||||||||||||||||||||||||||||||||||||||||||||||||||||||||||||||||||||||||||||||||||||||||||||||||||||||||||||||||||||||||||||||||||||||||||||
Post a new message | |||||||||||||||||||||||||||||||||||||||||||||||||||||||||||||||||||||||||||||||||||||||||||||||||||||||||||||||||||||||||||||||||||||||||||||
Dataset | |||||||||||||||||||||||||||||||||||||||||||||||||||||||||||||||||||||||||||||||||||||||||||||||||||||||||||||||||||||||||||||||||||||||||||||
| Dataseries X: | |||||||||||||||||||||||||||||||||||||||||||||||||||||||||||||||||||||||||||||||||||||||||||||||||||||||||||||||||||||||||||||||||||||||||||||
2.93 3.75 1.75 2.75 2.76 3.75 1.75 2.75 2.51 3.55 1.55 2.55 2.51 3.5 1.5 2.5 2.48 3.5 1.5 2.5 2.24 3.1 1.1 2.1 2.12 3 1 2 2.1 3 1 2 2.13 3 1 2 2.12 3 1 2 2.14 3 1 2 2.13 3 1 2 2.13 3 1 2 2.04 3 1 2 2.02 3 1 2 1.92 3 1 2 2.03 3 1 2 2.05 3 1 2 2.08 3 1 2 2.08 3 1 2 2.08 3 1 2 2.08 3 1 2 2.12 3 1 2 2.14 3 1 2 2.13 3 1 2 2.1 3 1 2 2.09 3 1 2 2.1 3 1 2 2.09 3 1 2 2.08 3 1 2 2.07 3 1 2 2.08 3 1 2 2.09 3 1 2 2.11 3 1 2 2.2 3 1 2 2.42 3.21 1.21 2.21 2.46 3.25 1.25 2.25 2.5 3.25 1.25 2.25 2.59 3.45 1.45 2.45 2.75 3.5 1.5 2.5 2.78 3.5 1.5 2.5 2.9 3.64 1.64 2.64 3.03 3.75 1.75 2.75 3.1 3.93 1.93 2.93 3.23 4 2 3 3.36 4.17 2.17 3.17 3.51 4.25 2.25 3.25 3.61 4.39 2.39 3.39 3.67 4.5 2.5 3.5 3.74 4.5 2.5 3.5 3.82 4.65 2.65 3.65 3.89 4.75 2.75 3.75 3.98 4.75 2.75 3.75 4.08 4.9 2.9 3.9 4.14 5 3 4 4.33 5 3 4 4.57 5 3 4 4.63 5 3 4 4.57 5 3 4 4.71 5 3 4 4.54 5 3 4 4.3 5 3 4 4.36 5 3 4 4.61 5 3 4 4.71 5 3 4 4.68 5 3 4 4.91 5.18 3.18 4.18 4.75 5.25 3.25 4.25 4.77 5.25 3.25 4.25 5.18 4.49 3.23 3.97 3.42 3.92 2.92 3.42 2.71 3.25 2.25 2.75 | |||||||||||||||||||||||||||||||||||||||||||||||||||||||||||||||||||||||||||||||||||||||||||||||||||||||||||||||||||||||||||||||||||||||||||||
Tables (Output of Computation) | |||||||||||||||||||||||||||||||||||||||||||||||||||||||||||||||||||||||||||||||||||||||||||||||||||||||||||||||||||||||||||||||||||||||||||||
| |||||||||||||||||||||||||||||||||||||||||||||||||||||||||||||||||||||||||||||||||||||||||||||||||||||||||||||||||||||||||||||||||||||||||||||
Figures (Output of Computation) | |||||||||||||||||||||||||||||||||||||||||||||||||||||||||||||||||||||||||||||||||||||||||||||||||||||||||||||||||||||||||||||||||||||||||||||
Input Parameters & R Code | |||||||||||||||||||||||||||||||||||||||||||||||||||||||||||||||||||||||||||||||||||||||||||||||||||||||||||||||||||||||||||||||||||||||||||||
| Parameters (Session): | |||||||||||||||||||||||||||||||||||||||||||||||||||||||||||||||||||||||||||||||||||||||||||||||||||||||||||||||||||||||||||||||||||||||||||||
| par1 = grey ; | |||||||||||||||||||||||||||||||||||||||||||||||||||||||||||||||||||||||||||||||||||||||||||||||||||||||||||||||||||||||||||||||||||||||||||||
| Parameters (R input): | |||||||||||||||||||||||||||||||||||||||||||||||||||||||||||||||||||||||||||||||||||||||||||||||||||||||||||||||||||||||||||||||||||||||||||||
| par1 = grey ; | |||||||||||||||||||||||||||||||||||||||||||||||||||||||||||||||||||||||||||||||||||||||||||||||||||||||||||||||||||||||||||||||||||||||||||||
| R code (references can be found in the software module): | |||||||||||||||||||||||||||||||||||||||||||||||||||||||||||||||||||||||||||||||||||||||||||||||||||||||||||||||||||||||||||||||||||||||||||||
z <- as.data.frame(t(y)) | |||||||||||||||||||||||||||||||||||||||||||||||||||||||||||||||||||||||||||||||||||||||||||||||||||||||||||||||||||||||||||||||||||||||||||||