Free Statistics

of Irreproducible Research!

Author's title

Author*Unverified author*
R Software Modulerwasp_notchedbox1.wasp
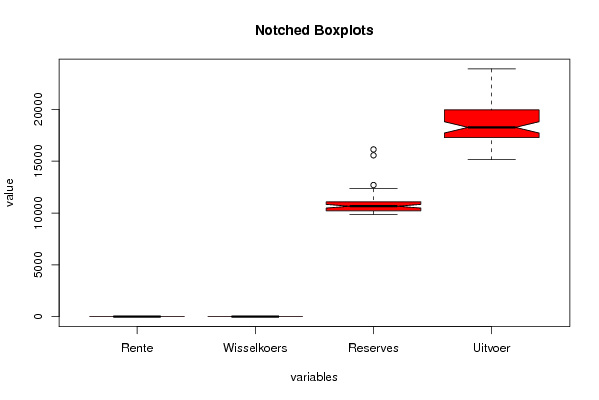
Title produced by softwareNotched Boxplots
Date of computationMon, 09 Nov 2009 00:55:15 -0700
Cite this page as followsStatistical Computations at FreeStatistics.org, Office for Research Development and Education, URL https://freestatistics.org/blog/index.php?v=date/2009/Nov/09/t1257753687pfp3pk7r6vnr9gv.htm/, Retrieved Fri, 19 Apr 2024 07:39:44 +0000
Statistical Computations at FreeStatistics.org, Office for Research Development and Education, URL https://freestatistics.org/blog/index.php?pk=54649, Retrieved Fri, 19 Apr 2024 07:39:44 +0000
QR Codes:

Original text written by user:
IsPrivate?No (this computation is public)
User-defined keywords
Estimated Impact231
Family? (F = Feedback message, R = changed R code, M = changed R Module, P = changed Parameters, D = changed Data)
-       [Notched Boxplots] [] [2009-11-09 07:55:15] [e76c6d261190c0179bc6006a5cdb804c] [Current]
Feedback Forum

Post a new message
Dataseries X:
2	1.249	10800	17872
2	1.2991	10642	17420.4
2	1.3408	10269	16704.4
2	1.3119	10189	15991.2
2	1.3014	9876	15583.6
2	1.3201	10164	19123.5
2	1.2938	9906	17838.7
2	1.2694	10003	17209.4
2	1.2165	10564	18586.5
2	1.2037	10221	16258.1
2	1.2292	10052	15141.6
2	1.2256	10512	19202.1
2	1.2015	10573	17746.5
2	1.1786	10821	19090.1
2.21	1.1856	10167	18040.3
2.25	1.2103	10901	17515.5
2.25	1.1938	10896	17751.8
2.45	1.202	10934	21072.4
2.5	1.2271	11059	17170
2.5	1.277	10513	19439.5
2.64	1.265	10270	19795.4
2.75	1.2684	10399	17574.9
2.93	1.2811	10740	16165.4
3	1.2727	10263	19464.6
3.17	1.2611	9883	19932.1
3.25	1.2881	10204	19961.2
3.39	1.3213	10201	17343.4
3.5	1.2999	10416	18924.2
3.5	1.3074	10557	18574.1
3.65	1.3242	10166	21350.6
3.75	1.3516	10066	18594.6
3.75	1.3511	10117	19832.1
3.9	1.3419	9973	20844.4
4	1.3716	10360	19640.2
4	1.3622	10133	17735.4
4	1.3896	10667	19813.6
4	1.4227	10883	22160
4	1.4684	10794	20664.3
4	1.457	11212	17877.4
4	1.4718	11242	20906.5
4	1.4748	11483	21164.1
4	1.5527	11106	21374.4
4	1.575	11019	22952.3
4	1.5557	10767	21343.5
4	1.5553	10577	23899.3
4.18	1.577	10859	22392.9
4.25	1.4975	10575	18274.1
4.25	1.4369	10680	22786.7
3.97	1.3322	10926	22321.5
3.42	1.2732	11781	17842.2
2.75	1.3449	11241	16373.5
2.31	1.3239	12347	15933.8
2	1.2785	12699	16446.1
1.66	1.305	12214	17729
1.31	1.319	12066	16643
1.09	1.365	12085	16196.7
1	1.4016	11894	18252.1
1	1.4088	11793	17570.4
1	1.4268	15567	15836.8
1	1.4562	16135	15836.8


Summary of computational transaction
Raw Inputview raw input (R code)
Raw Outputview raw output of R engine
Computing time2 seconds
R Server'Gwilym Jenkins' @ 72.249.127.135

\begin{tabular}{lllllllll}
\hline
Summary of computational transaction \tabularnewline
Raw Input & view raw input (R code)  \tabularnewline
Raw Output & view raw output of R engine  \tabularnewline
Computing time & 2 seconds \tabularnewline
R Server & 'Gwilym Jenkins' @ 72.249.127.135 \tabularnewline
\hline
\end{tabular}
%Source: https://freestatistics.org/blog/index.php?pk=54649&T=0

[TABLE]
[ROW][C]Summary of computational transaction[/C][/ROW]
[ROW][C]Raw Input[/C][C]view raw input (R code) [/C][/ROW]
[ROW][C]Raw Output[/C][C]view raw output of R engine [/C][/ROW]
[ROW][C]Computing time[/C][C]2 seconds[/C][/ROW]
[ROW][C]R Server[/C][C]'Gwilym Jenkins' @ 72.249.127.135[/C][/ROW]
[/TABLE]
Source: https://freestatistics.org/blog/index.php?pk=54649&T=0

Globally Unique Identifier (entire table): ba.freestatistics.org/blog/index.php?pk=54649&T=0

As an alternative you can also use a QR Code:  

The GUIDs for individual cells are displayed in the table below:

Summary of computational transaction
Raw Inputview raw input (R code)
Raw Outputview raw output of R engine
Computing time2 seconds
R Server'Gwilym Jenkins' @ 72.249.127.135


Boxplot statistics
Variablelower whiskerlower hingemedianupper hingeupper whisker
Rente122.6953.9854.25
Wisselkoers1.17861.26891.319551.40521.577
Reserves987610212.510654.511082.512347
Uitvoer15141.617276.418263.119946.6523899.3

\begin{tabular}{lllllllll}
\hline
Boxplot statistics \tabularnewline
Variable & lower whisker & lower hinge & median & upper hinge & upper whisker \tabularnewline
Rente & 1 & 2 & 2.695 & 3.985 & 4.25 \tabularnewline
Wisselkoers & 1.1786 & 1.2689 & 1.31955 & 1.4052 & 1.577 \tabularnewline
Reserves & 9876 & 10212.5 & 10654.5 & 11082.5 & 12347 \tabularnewline
Uitvoer & 15141.6 & 17276.4 & 18263.1 & 19946.65 & 23899.3 \tabularnewline
\hline
\end{tabular}
%Source: https://freestatistics.org/blog/index.php?pk=54649&T=1

[TABLE]
[ROW][C]Boxplot statistics[/C][/ROW]
[ROW][C]Variable[/C][C]lower whisker[/C][C]lower hinge[/C][C]median[/C][C]upper hinge[/C][C]upper whisker[/C][/ROW]
[ROW][C]Rente[/C][C]1[/C][C]2[/C][C]2.695[/C][C]3.985[/C][C]4.25[/C][/ROW]
[ROW][C]Wisselkoers[/C][C]1.1786[/C][C]1.2689[/C][C]1.31955[/C][C]1.4052[/C][C]1.577[/C][/ROW]
[ROW][C]Reserves[/C][C]9876[/C][C]10212.5[/C][C]10654.5[/C][C]11082.5[/C][C]12347[/C][/ROW]
[ROW][C]Uitvoer[/C][C]15141.6[/C][C]17276.4[/C][C]18263.1[/C][C]19946.65[/C][C]23899.3[/C][/ROW]
[/TABLE]
Source: https://freestatistics.org/blog/index.php?pk=54649&T=1

Globally Unique Identifier (entire table): ba.freestatistics.org/blog/index.php?pk=54649&T=1

As an alternative you can also use a QR Code:  

The GUIDs for individual cells are displayed in the table below:

Boxplot statistics
Variablelower whiskerlower hingemedianupper hingeupper whisker
Rente122.6953.9854.25
Wisselkoers1.17861.26891.319551.40521.577
Reserves987610212.510654.511082.512347
Uitvoer15141.617276.418263.119946.6523899.3


Boxplot Notches
Variablelower boundmedianupper bound
Rente2.290105411042992.6953.09989458895701
Wisselkoers1.291747918148691.319551.34735208185131
Reserves10477.039903076810654.510831.9600969232
Uitvoer17718.430087575618263.118807.7699124244

\begin{tabular}{lllllllll}
\hline
Boxplot Notches \tabularnewline
Variable & lower bound & median & upper bound \tabularnewline
Rente & 2.29010541104299 & 2.695 & 3.09989458895701 \tabularnewline
Wisselkoers & 1.29174791814869 & 1.31955 & 1.34735208185131 \tabularnewline
Reserves & 10477.0399030768 & 10654.5 & 10831.9600969232 \tabularnewline
Uitvoer & 17718.4300875756 & 18263.1 & 18807.7699124244 \tabularnewline
\hline
\end{tabular}
%Source: https://freestatistics.org/blog/index.php?pk=54649&T=2

[TABLE]
[ROW][C]Boxplot Notches[/C][/ROW]
[ROW][C]Variable[/C][C]lower bound[/C][C]median[/C][C]upper bound[/C][/ROW]
[ROW][C]Rente[/C][C]2.29010541104299[/C][C]2.695[/C][C]3.09989458895701[/C][/ROW]
[ROW][C]Wisselkoers[/C][C]1.29174791814869[/C][C]1.31955[/C][C]1.34735208185131[/C][/ROW]
[ROW][C]Reserves[/C][C]10477.0399030768[/C][C]10654.5[/C][C]10831.9600969232[/C][/ROW]
[ROW][C]Uitvoer[/C][C]17718.4300875756[/C][C]18263.1[/C][C]18807.7699124244[/C][/ROW]
[/TABLE]
Source: https://freestatistics.org/blog/index.php?pk=54649&T=2

Globally Unique Identifier (entire table): ba.freestatistics.org/blog/index.php?pk=54649&T=2

As an alternative you can also use a QR Code:  

The GUIDs for individual cells are displayed in the table below:

Boxplot Notches
Variablelower boundmedianupper bound
Rente2.290105411042992.6953.09989458895701
Wisselkoers1.291747918148691.319551.34735208185131
Reserves10477.039903076810654.510831.9600969232
Uitvoer17718.430087575618263.118807.7699124244


Parameters (Session):
par1 = red ;
Parameters (R input):
par1 = red ;
R code (references can be found in the software module):
z <- as.data.frame(t(y))
bitmap(file='test1.png')
(r<-boxplot(z ,xlab=xlab,ylab=ylab,main=main,notch=TRUE,col=par1))
dev.off()
load(file='createtable')
a<-table.start()
a<-table.row.start(a)
a<-table.element(a,hyperlink('overview.htm','Boxplot statistics','Boxplot overview'),6,TRUE)
a<-table.row.end(a)
a<-table.row.start(a)
a<-table.element(a,'Variable',1,TRUE)
a<-table.element(a,hyperlink('lower_whisker.htm','lower whisker','definition of lower whisker'),1,TRUE)
a<-table.element(a,hyperlink('lower_hinge.htm','lower hinge','definition of lower hinge'),1,TRUE)
a<-table.element(a,hyperlink('central_tendency.htm','median','definitions about measures of central tendency'),1,TRUE)
a<-table.element(a,hyperlink('upper_hinge.htm','upper hinge','definition of upper hinge'),1,TRUE)
a<-table.element(a,hyperlink('upper_whisker.htm','upper whisker','definition of upper whisker'),1,TRUE)
a<-table.row.end(a)
for (i in 1:length(y[,1]))
{
a<-table.row.start(a)
a<-table.element(a,dimnames(t(x))[[2]][i],1,TRUE)
for (j in 1:5)
{
a<-table.element(a,r$stats[j,i])
}
a<-table.row.end(a)
}
a<-table.end(a)
table.save(a,file='mytable.tab')
a<-table.start()
a<-table.row.start(a)
a<-table.element(a,'Boxplot Notches',4,TRUE)
a<-table.row.end(a)
a<-table.row.start(a)
a<-table.element(a,'Variable',1,TRUE)
a<-table.element(a,'lower bound',1,TRUE)
a<-table.element(a,'median',1,TRUE)
a<-table.element(a,'upper bound',1,TRUE)
a<-table.row.end(a)
for (i in 1:length(y[,1]))
{
a<-table.row.start(a)
a<-table.element(a,dimnames(t(x))[[2]][i],1,TRUE)
a<-table.element(a,r$conf[1,i])
a<-table.element(a,r$stats[3,i])
a<-table.element(a,r$conf[2,i])
a<-table.row.end(a)
}
a<-table.end(a)
table.save(a,file='mytable1.tab')