Free Statistics

of Irreproducible Research!

Author's title

Author*The author of this computation has been verified*
R Software Modulerwasp_edabi.wasp
Title produced by softwareBivariate Explorative Data Analysis
Date of computationSun, 08 Nov 2009 11:45:23 -0700
Cite this page as followsStatistical Computations at FreeStatistics.org, Office for Research Development and Education, URL https://freestatistics.org/blog/index.php?v=date/2009/Nov/08/t1257705993osioobpz0h7k31k.htm/, Retrieved Sat, 04 May 2024 16:39:36 +0000
Statistical Computations at FreeStatistics.org, Office for Research Development and Education, URL https://freestatistics.org/blog/index.php?pk=54620, Retrieved Sat, 04 May 2024 16:39:36 +0000
QR Codes:

Original text written by user:
IsPrivate?No (this computation is public)
User-defined keywords
Estimated Impact187
Family? (F = Feedback message, R = changed R code, M = changed R Module, P = changed Parameters, D = changed Data)
-       [Bivariate Explorative Data Analysis] [et en et'] [2009-11-08 18:45:23] [244731fa3e7e6c85774b8c0902c58f85] [Current]
Feedback Forum

Post a new message
Dataseries X:
33936835159
30314493046
26928810724
24876958291
23615171179
22560896390
21180674746
18880811018
14104945112
12591947967
27408127666
31865891180
33855809685
30821121296
27356441900
25559430961
20624589764
19660646306
17878224124
16326586383
12270950952
11427468353
24482242401
28027924708
29365921307
24738215676
21109429203
18450524729
18809636139
17609493235
15877259911
14678476849
10387674497
9755892421
20668382050
23109994437
22779467617
19863675691
16878186542
16683161474
16408662403
15576419405
13988019702
13126061933
9718459219
9305531861
18930905637
20857117696
21098999752
18220267194
16655566553
17130662024
17205295964
17250491780
17163543527
15989627058
12019125690
11733626565
22335292668
25424042789
26322612177
Dataseries Y:
36760884099
33232292086
29297986578
26997278155
25477946926
24270796612
22755599522
20235549418
15135391672
13679658087
30079192964
34965543884
36937930533
33139684976
29251424550
27291692457
22082709908
20891299946
18885315466
17166343835
12911215481
12183497553
26534302488
30630438612
31529767943
26365143561
22315074193
19491615417
19738046123
18409727299
16641253150
15318942204
10841623409
10400770303
22442799550
25307901177
24447068266
21034011451
17780209972
17453666258
17156154243
16206768970
14597007234
13623569502
10148369161
9843016135
20346044445
22626257308
22266244099
18894043476
17014633513
17309070836
17189436380
17096826164
16799024827
15594484659
11721219340
11534935385
22388838968
25678462085
25989659652


Summary of computational transaction
Raw Inputview raw input (R code)
Raw Outputview raw output of R engine
Computing time4 seconds
R Server'Sir Ronald Aylmer Fisher' @ 193.190.124.24

\begin{tabular}{lllllllll}
\hline
Summary of computational transaction \tabularnewline
Raw Input & view raw input (R code)  \tabularnewline
Raw Output & view raw output of R engine  \tabularnewline
Computing time & 4 seconds \tabularnewline
R Server & 'Sir Ronald Aylmer Fisher' @ 193.190.124.24 \tabularnewline
\hline
\end{tabular}
%Source: https://freestatistics.org/blog/index.php?pk=54620&T=0

[TABLE]
[ROW][C]Summary of computational transaction[/C][/ROW]
[ROW][C]Raw Input[/C][C]view raw input (R code) [/C][/ROW]
[ROW][C]Raw Output[/C][C]view raw output of R engine [/C][/ROW]
[ROW][C]Computing time[/C][C]4 seconds[/C][/ROW]
[ROW][C]R Server[/C][C]'Sir Ronald Aylmer Fisher' @ 193.190.124.24[/C][/ROW]
[/TABLE]
Source: https://freestatistics.org/blog/index.php?pk=54620&T=0

Globally Unique Identifier (entire table): ba.freestatistics.org/blog/index.php?pk=54620&T=0

As an alternative you can also use a QR Code:  

The GUIDs for individual cells are displayed in the table below:

Summary of computational transaction
Raw Inputview raw input (R code)
Raw Outputview raw output of R engine
Computing time4 seconds
R Server'Sir Ronald Aylmer Fisher' @ 193.190.124.24


Model: Y[t] = c + b X[t] + e[t]
c-1065080121.41184
b1.11165328411186

\begin{tabular}{lllllllll}
\hline
Model: Y[t] = c + b X[t] + e[t] \tabularnewline
c & -1065080121.41184 \tabularnewline
b & 1.11165328411186 \tabularnewline
\hline
\end{tabular}
%Source: https://freestatistics.org/blog/index.php?pk=54620&T=1

[TABLE]
[ROW][C]Model: Y[t] = c + b X[t] + e[t][/C][/ROW]
[ROW][C]c[/C][C]-1065080121.41184[/C][/ROW]
[ROW][C]b[/C][C]1.11165328411186[/C][/ROW]
[/TABLE]
Source: https://freestatistics.org/blog/index.php?pk=54620&T=1

Globally Unique Identifier (entire table): ba.freestatistics.org/blog/index.php?pk=54620&T=1

As an alternative you can also use a QR Code:  

The GUIDs for individual cells are displayed in the table below:

Model: Y[t] = c + b X[t] + e[t]
c-1065080121.41184
b1.11165328411186


Descriptive Statistics about e[t]
# observations61
minimum-2206878499.55294
Q1-94373808.338344
median82598594.1450069
mean-1.16033632247174e-08
Q3383617441.917658
maximum746857897.530678

\begin{tabular}{lllllllll}
\hline
Descriptive Statistics about e[t] \tabularnewline
# observations & 61 \tabularnewline
minimum & -2206878499.55294 \tabularnewline
Q1 & -94373808.338344 \tabularnewline
median & 82598594.1450069 \tabularnewline
mean & -1.16033632247174e-08 \tabularnewline
Q3 & 383617441.917658 \tabularnewline
maximum & 746857897.530678 \tabularnewline
\hline
\end{tabular}
%Source: https://freestatistics.org/blog/index.php?pk=54620&T=2

[TABLE]
[ROW][C]Descriptive Statistics about e[t][/C][/ROW]
[ROW][C]# observations[/C][C]61[/C][/ROW]
[ROW][C]minimum[/C][C]-2206878499.55294[/C][/ROW]
[ROW][C]Q1[/C][C]-94373808.338344[/C][/ROW]
[ROW][C]median[/C][C]82598594.1450069[/C][/ROW]
[ROW][C]mean[/C][C]-1.16033632247174e-08[/C][/ROW]
[ROW][C]Q3[/C][C]383617441.917658[/C][/ROW]
[ROW][C]maximum[/C][C]746857897.530678[/C][/ROW]
[/TABLE]
Source: https://freestatistics.org/blog/index.php?pk=54620&T=2

Globally Unique Identifier (entire table): ba.freestatistics.org/blog/index.php?pk=54620&T=2

As an alternative you can also use a QR Code:  

The GUIDs for individual cells are displayed in the table below:

Descriptive Statistics about e[t]
# observations61
minimum-2206878499.55294
Q1-94373808.338344
median82598594.1450069
mean-1.16033632247174e-08
Q3383617441.917658
maximum746857897.530678


Parameters (Session):
par1 = 0 ; par2 = 36 ;
Parameters (R input):
par1 = 0 ; par2 = 36 ;
R code (references can be found in the software module):
par1 <- as.numeric(par1)
par2 <- as.numeric(par2)
x <- as.ts(x)
y <- as.ts(y)
mylm <- lm(y~x)
cbind(mylm$resid)
library(lattice)
bitmap(file='pic1.png')
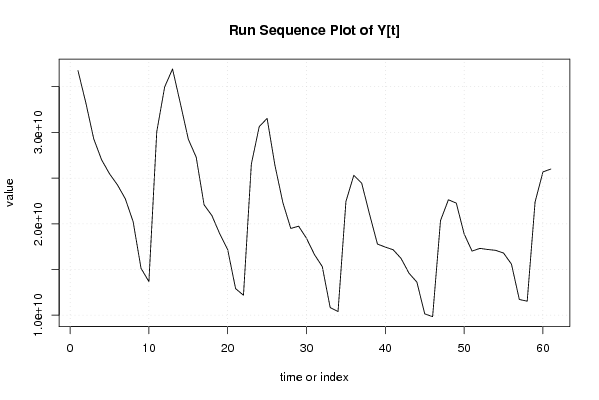
plot(y,type='l',main='Run Sequence Plot of Y[t]',xlab='time or index',ylab='value')
grid()
dev.off()
bitmap(file='pic1a.png')
plot(x,type='l',main='Run Sequence Plot of X[t]',xlab='time or index',ylab='value')
grid()
dev.off()
bitmap(file='pic1b.png')
plot(x,y,main='Scatter Plot',xlab='X[t]',ylab='Y[t]')
grid()
dev.off()
bitmap(file='pic1c.png')
plot(mylm$resid,type='l',main='Run Sequence Plot of e[t]',xlab='time or index',ylab='value')
grid()
dev.off()
bitmap(file='pic2.png')
hist(mylm$resid,main='Histogram of e[t]')
dev.off()
bitmap(file='pic3.png')
if (par1 > 0)
{
densityplot(~mylm$resid,col='black',main=paste('Density Plot of e[t] bw = ',par1),bw=par1)
} else {
densityplot(~mylm$resid,col='black',main='Density Plot of e[t]')
}
dev.off()
bitmap(file='pic4.png')
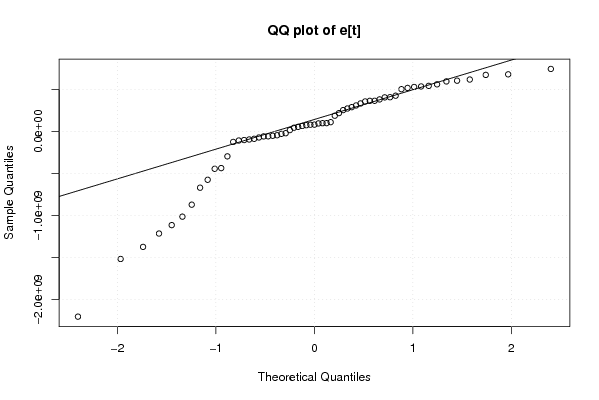
qqnorm(mylm$resid,main='QQ plot of e[t]')
qqline(mylm$resid)
grid()
dev.off()
if (par2 > 0)
{
bitmap(file='pic5.png')
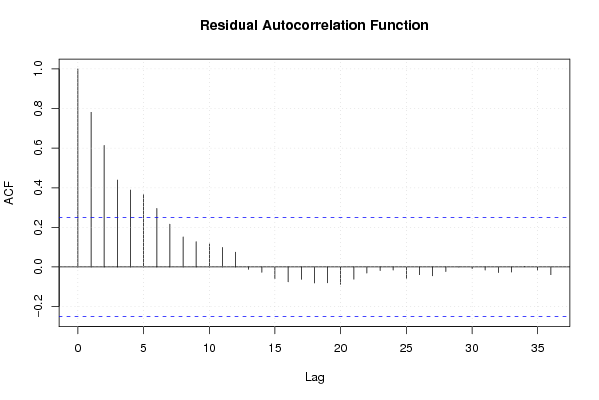
acf(mylm$resid,lag.max=par2,main='Residual Autocorrelation Function')
grid()
dev.off()
}
summary(x)
load(file='createtable')
a<-table.start()
a<-table.row.start(a)
a<-table.element(a,'Model: Y[t] = c + b X[t] + e[t]',2,TRUE)
a<-table.row.end(a)
a<-table.row.start(a)
a<-table.element(a,'c',1,TRUE)
a<-table.element(a,mylm$coeff[[1]])
a<-table.row.end(a)
a<-table.row.start(a)
a<-table.element(a,'b',1,TRUE)
a<-table.element(a,mylm$coeff[[2]])
a<-table.row.end(a)
a<-table.end(a)
table.save(a,file='mytable.tab')
a<-table.start()
a<-table.row.start(a)
a<-table.element(a,'Descriptive Statistics about e[t]',2,TRUE)
a<-table.row.end(a)
a<-table.row.start(a)
a<-table.element(a,'# observations',header=TRUE)
a<-table.element(a,length(mylm$resid))
a<-table.row.end(a)
a<-table.row.start(a)
a<-table.element(a,'minimum',header=TRUE)
a<-table.element(a,min(mylm$resid))
a<-table.row.end(a)
a<-table.row.start(a)
a<-table.element(a,'Q1',header=TRUE)
a<-table.element(a,quantile(mylm$resid,0.25))
a<-table.row.end(a)
a<-table.row.start(a)
a<-table.element(a,'median',header=TRUE)
a<-table.element(a,median(mylm$resid))
a<-table.row.end(a)
a<-table.row.start(a)
a<-table.element(a,'mean',header=TRUE)
a<-table.element(a,mean(mylm$resid))
a<-table.row.end(a)
a<-table.row.start(a)
a<-table.element(a,'Q3',header=TRUE)
a<-table.element(a,quantile(mylm$resid,0.75))
a<-table.row.end(a)
a<-table.row.start(a)
a<-table.element(a,'maximum',header=TRUE)
a<-table.element(a,max(mylm$resid))
a<-table.row.end(a)
a<-table.end(a)
table.save(a,file='mytable.tab')