Free Statistics

of Irreproducible Research!

Author's title

Author*The author of this computation has been verified*
R Software Modulerwasp_edabi.wasp
Title produced by softwareBivariate Explorative Data Analysis
Date of computationSat, 07 Nov 2009 14:15:28 -0700
Cite this page as followsStatistical Computations at FreeStatistics.org, Office for Research Development and Education, URL https://freestatistics.org/blog/index.php?v=date/2009/Nov/07/t12576286058ihnwf7uh5t5dl4.htm/, Retrieved Mon, 06 May 2024 17:15:06 +0000
Statistical Computations at FreeStatistics.org, Office for Research Development and Education, URL https://freestatistics.org/blog/index.php?pk=54485, Retrieved Mon, 06 May 2024 17:15:06 +0000
QR Codes:

Original text written by user:
IsPrivate?No (this computation is public)
User-defined keywords
Estimated Impact137
Family? (F = Feedback message, R = changed R code, M = changed R Module, P = changed Parameters, D = changed Data)
-       [Bivariate Explorative Data Analysis] [workshop5/Bivaria...] [2009-11-07 21:15:28] [f94f05f163a3ee3ab544c4fef41db0eb] [Current]
Feedback Forum

Post a new message
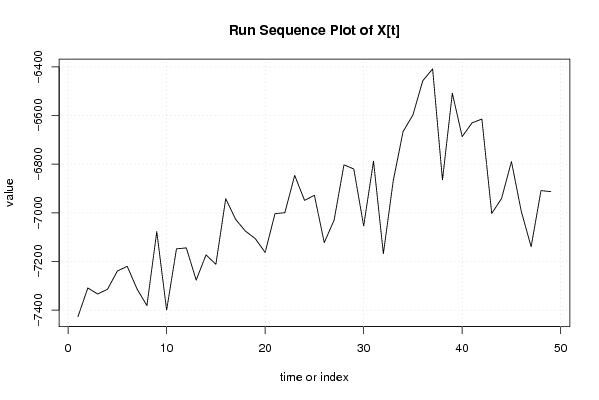
Dataseries X:
-7426,73
-7308,93
-7333,61
-7314,22
-7239,23
-7219,76
-7313,35
-7381,09
-7077,32
-7400,02
-7147,91
-7144,17
-7276,58
-7172,73
-7211,50
-6941,45
-7026,76
-7075,19
-7106,10
-7162,73
-7003,40
-6999,41
-6846,00
-6948,87
-6927,68
-7122,45
-7030,05
-6802,68
-6819,76
-7054,22
-6787,48
-7167,89
-6868,79
-6666,08
-6597,60
-6457,10
-6408,49
-6864,88
-6508,34
-6686,73
-6630,20
-6614,38
-7002,80
-6940,62
-6789,02
-6994,08
-7139,56
-6908,50
-6912,93
Dataseries Y:
2431,473354
2851,273553
5193,987643
4067,181965
5531,37159
5825,944194
4975,147524
5115,912101
7766,480008
4520,081772
5629,786475
5784,933441
3763,320134
4130,870429
5680,303305
5760,748704
5928,343033
4692,513096
5264,49685
5171,667497
6929,501746
4855,894509
5940,796465
6459,532472
5574,916233
4500,753023
5893,745786
7642,71624
6962,737381
6254,881998
7521,924074
7790,512333
8175,20745
8684,919782
7171,695709
9552,697275
7684,812346
5972,72349
8338,660273
8331,870436
5683,701348
4156,620731
3554,20292
3725,280605
4817,77689
3849,022097
3350,142064
5422,69882
3864,370641


Summary of computational transaction
Raw Inputview raw input (R code)
Raw Outputview raw output of R engine
Computing time4 seconds
R Server'RServer@AstonUniversity' @ vre.aston.ac.uk

\begin{tabular}{lllllllll}
\hline
Summary of computational transaction \tabularnewline
Raw Input & view raw input (R code)  \tabularnewline
Raw Output & view raw output of R engine  \tabularnewline
Computing time & 4 seconds \tabularnewline
R Server & 'RServer@AstonUniversity' @ vre.aston.ac.uk \tabularnewline
\hline
\end{tabular}
%Source: https://freestatistics.org/blog/index.php?pk=54485&T=0

[TABLE]
[ROW][C]Summary of computational transaction[/C][/ROW]
[ROW][C]Raw Input[/C][C]view raw input (R code) [/C][/ROW]
[ROW][C]Raw Output[/C][C]view raw output of R engine [/C][/ROW]
[ROW][C]Computing time[/C][C]4 seconds[/C][/ROW]
[ROW][C]R Server[/C][C]'RServer@AstonUniversity' @ vre.aston.ac.uk[/C][/ROW]
[/TABLE]
Source: https://freestatistics.org/blog/index.php?pk=54485&T=0

Globally Unique Identifier (entire table): ba.freestatistics.org/blog/index.php?pk=54485&T=0

As an alternative you can also use a QR Code:  

The GUIDs for individual cells are displayed in the table below:

Summary of computational transaction
Raw Inputview raw input (R code)
Raw Outputview raw output of R engine
Computing time4 seconds
R Server'RServer@AstonUniversity' @ vre.aston.ac.uk


Model: Y[t] = c + b X[t] + e[t]
c33080.5564482092
b3.91562979463218

\begin{tabular}{lllllllll}
\hline
Model: Y[t] = c + b X[t] + e[t] \tabularnewline
c & 33080.5564482092 \tabularnewline
b & 3.91562979463218 \tabularnewline
\hline
\end{tabular}
%Source: https://freestatistics.org/blog/index.php?pk=54485&T=1

[TABLE]
[ROW][C]Model: Y[t] = c + b X[t] + e[t][/C][/ROW]
[ROW][C]c[/C][C]33080.5564482092[/C][/ROW]
[ROW][C]b[/C][C]3.91562979463218[/C][/ROW]
[/TABLE]
Source: https://freestatistics.org/blog/index.php?pk=54485&T=1

Globally Unique Identifier (entire table): ba.freestatistics.org/blog/index.php?pk=54485&T=1

As an alternative you can also use a QR Code:  

The GUIDs for individual cells are displayed in the table below:

Model: Y[t] = c + b X[t] + e[t]
c33080.5564482092
b3.91562979463218


Descriptive Statistics about e[t]
# observations49
minimum-3024.47231618995
Q1-817.563598362717
median137.710047696611
mean2.66453525910038e-14
Q3829.133013003359
maximum2776.75953343692

\begin{tabular}{lllllllll}
\hline
Descriptive Statistics about e[t] \tabularnewline
# observations & 49 \tabularnewline
minimum & -3024.47231618995 \tabularnewline
Q1 & -817.563598362717 \tabularnewline
median & 137.710047696611 \tabularnewline
mean & 2.66453525910038e-14 \tabularnewline
Q3 & 829.133013003359 \tabularnewline
maximum & 2776.75953343692 \tabularnewline
\hline
\end{tabular}
%Source: https://freestatistics.org/blog/index.php?pk=54485&T=2

[TABLE]
[ROW][C]Descriptive Statistics about e[t][/C][/ROW]
[ROW][C]# observations[/C][C]49[/C][/ROW]
[ROW][C]minimum[/C][C]-3024.47231618995[/C][/ROW]
[ROW][C]Q1[/C][C]-817.563598362717[/C][/ROW]
[ROW][C]median[/C][C]137.710047696611[/C][/ROW]
[ROW][C]mean[/C][C]2.66453525910038e-14[/C][/ROW]
[ROW][C]Q3[/C][C]829.133013003359[/C][/ROW]
[ROW][C]maximum[/C][C]2776.75953343692[/C][/ROW]
[/TABLE]
Source: https://freestatistics.org/blog/index.php?pk=54485&T=2

Globally Unique Identifier (entire table): ba.freestatistics.org/blog/index.php?pk=54485&T=2

As an alternative you can also use a QR Code:  

The GUIDs for individual cells are displayed in the table below:

Descriptive Statistics about e[t]
# observations49
minimum-3024.47231618995
Q1-817.563598362717
median137.710047696611
mean2.66453525910038e-14
Q3829.133013003359
maximum2776.75953343692


Parameters (Session):
Parameters (R input):
par1 = 0 ; par2 = 36 ;
R code (references can be found in the software module):
par1 <- as.numeric(par1)
par2 <- as.numeric(par2)
x <- as.ts(x)
y <- as.ts(y)
mylm <- lm(y~x)
cbind(mylm$resid)
library(lattice)
bitmap(file='pic1.png')
plot(y,type='l',main='Run Sequence Plot of Y[t]',xlab='time or index',ylab='value')
grid()
dev.off()
bitmap(file='pic1a.png')
plot(x,type='l',main='Run Sequence Plot of X[t]',xlab='time or index',ylab='value')
grid()
dev.off()
bitmap(file='pic1b.png')
plot(x,y,main='Scatter Plot',xlab='X[t]',ylab='Y[t]')
grid()
dev.off()
bitmap(file='pic1c.png')
plot(mylm$resid,type='l',main='Run Sequence Plot of e[t]',xlab='time or index',ylab='value')
grid()
dev.off()
bitmap(file='pic2.png')
hist(mylm$resid,main='Histogram of e[t]')
dev.off()
bitmap(file='pic3.png')
if (par1 > 0)
{
densityplot(~mylm$resid,col='black',main=paste('Density Plot of e[t] bw = ',par1),bw=par1)
} else {
densityplot(~mylm$resid,col='black',main='Density Plot of e[t]')
}
dev.off()
bitmap(file='pic4.png')
qqnorm(mylm$resid,main='QQ plot of e[t]')
qqline(mylm$resid)
grid()
dev.off()
if (par2 > 0)
{
bitmap(file='pic5.png')
acf(mylm$resid,lag.max=par2,main='Residual Autocorrelation Function')
grid()
dev.off()
}
summary(x)
load(file='createtable')
a<-table.start()
a<-table.row.start(a)
a<-table.element(a,'Model: Y[t] = c + b X[t] + e[t]',2,TRUE)
a<-table.row.end(a)
a<-table.row.start(a)
a<-table.element(a,'c',1,TRUE)
a<-table.element(a,mylm$coeff[[1]])
a<-table.row.end(a)
a<-table.row.start(a)
a<-table.element(a,'b',1,TRUE)
a<-table.element(a,mylm$coeff[[2]])
a<-table.row.end(a)
a<-table.end(a)
table.save(a,file='mytable.tab')
a<-table.start()
a<-table.row.start(a)
a<-table.element(a,'Descriptive Statistics about e[t]',2,TRUE)
a<-table.row.end(a)
a<-table.row.start(a)
a<-table.element(a,'# observations',header=TRUE)
a<-table.element(a,length(mylm$resid))
a<-table.row.end(a)
a<-table.row.start(a)
a<-table.element(a,'minimum',header=TRUE)
a<-table.element(a,min(mylm$resid))
a<-table.row.end(a)
a<-table.row.start(a)
a<-table.element(a,'Q1',header=TRUE)
a<-table.element(a,quantile(mylm$resid,0.25))
a<-table.row.end(a)
a<-table.row.start(a)
a<-table.element(a,'median',header=TRUE)
a<-table.element(a,median(mylm$resid))
a<-table.row.end(a)
a<-table.row.start(a)
a<-table.element(a,'mean',header=TRUE)
a<-table.element(a,mean(mylm$resid))
a<-table.row.end(a)
a<-table.row.start(a)
a<-table.element(a,'Q3',header=TRUE)
a<-table.element(a,quantile(mylm$resid,0.75))
a<-table.row.end(a)
a<-table.row.start(a)
a<-table.element(a,'maximum',header=TRUE)
a<-table.element(a,max(mylm$resid))
a<-table.row.end(a)
a<-table.end(a)
table.save(a,file='mytable.tab')