Free Statistics

of Irreproducible Research!

Author's title

Author*The author of this computation has been verified*
R Software Modulerwasp_edabi.wasp
Title produced by softwareBivariate Explorative Data Analysis
Date of computationSat, 07 Nov 2009 06:36:29 -0700
Cite this page as followsStatistical Computations at FreeStatistics.org, Office for Research Development and Education, URL https://freestatistics.org/blog/index.php?v=date/2009/Nov/07/t1257601026zcn7cn0hgfto6wp.htm/, Retrieved Mon, 06 May 2024 17:54:34 +0000
Statistical Computations at FreeStatistics.org, Office for Research Development and Education, URL https://freestatistics.org/blog/index.php?pk=54404, Retrieved Mon, 06 May 2024 17:54:34 +0000
QR Codes:

Original text written by user:
IsPrivate?No (this computation is public)
User-defined keywords
Estimated Impact182
Family? (F = Feedback message, R = changed R code, M = changed R Module, P = changed Parameters, D = changed Data)
-       [Bivariate Explorative Data Analysis] [] [2009-11-07 13:36:29] [b83ad3e324a04589b985913c26f6921c] [Current]
Feedback Forum

Post a new message
Dataseries X:
-4757,94575
-3501,961939
4675,799026
-7958,854315
-15749,64956
-6124,716213
-184,4590898
14345,88187
27460,89236
21294,92474
10550,92664
10201,63045
4614,163773
5480,679012
9449,551401
3259,567589
-2973,602891
5714,73617
5349,964714
19426,52282
32541,6895
23421,48854
18701,25331
15422,67711
10693,59997
12077,42759
18654,9857
6885,427588
12330,61236
12512,78284
10978,979
22258,2714
33638,93903
21010,76665
9861,955217
-1578,057173
4338,06664
-999,9800276
-719,9371594
-11274,35526
-16375,85621
-21643,18668
-15397,97623
-4937,339076
-5575,357165
-2806,125728
-16267,7324
-21705,61908
-12931,76288
-14993,62288
-25009,96574
-19861,60859
-37016,01241
-31067,70192
-23619,74289
-20614,77527
-10320,49907
-12945,85811
-22959,08765
-16954,57051
-10663,64766
-5126,929561
6361,301875
1106,273297
-7004,022896
5033,989494
11966,79233
Dataseries Y:
-1814,938761
-2204,024389
3414,636476
-7742,342918
-13656,14768
5,537168254
15341,93457
29611,03726
39633,20496
39834,37622
25546,34886
24352,55777
16737,71535
15984,81466
17893,10228
10417,1879
5223,136563
17548,26661
29014,43804
41297,8763
49063,98236
33086,73241
24662,33855
21679,84202
18615,35916
15987,33518
17347,77345
5312,335178
9757,499506
15525,55085
27754,55102
41297,39682
41619,4892
24048,46522
8884,57483
-1555,565515
752,2015842
-6493,082658
-7342,743698
-18169,32924
-24011,31556
-21399,25054
-1337,137376
11827,75639
-255,3018794
-5429,853309
-20389,54846
-26904,94906
-19848,74707
-24563,89435
-33177,96967
-31476,78136
-45298,25391
-34656,34985
-15791,71616
-8909,88742
-13931,12725
-24430,2882
-38781,76413
-36786,69218
-35057,17504
-33470,85313
-29093,40456
-34699,63054
-42357,42162
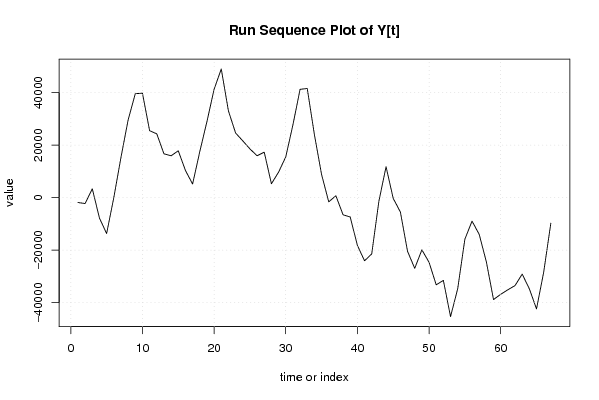
-28366,28127
-9675,585947


Summary of computational transaction
Raw Inputview raw input (R code)
Raw Outputview raw output of R engine
Computing time4 seconds
R Server'RServer@AstonUniversity' @ vre.aston.ac.uk

\begin{tabular}{lllllllll}
\hline
Summary of computational transaction \tabularnewline
Raw Input & view raw input (R code)  \tabularnewline
Raw Output & view raw output of R engine  \tabularnewline
Computing time & 4 seconds \tabularnewline
R Server & 'RServer@AstonUniversity' @ vre.aston.ac.uk \tabularnewline
\hline
\end{tabular}
%Source: https://freestatistics.org/blog/index.php?pk=54404&T=0

[TABLE]
[ROW][C]Summary of computational transaction[/C][/ROW]
[ROW][C]Raw Input[/C][C]view raw input (R code) [/C][/ROW]
[ROW][C]Raw Output[/C][C]view raw output of R engine [/C][/ROW]
[ROW][C]Computing time[/C][C]4 seconds[/C][/ROW]
[ROW][C]R Server[/C][C]'RServer@AstonUniversity' @ vre.aston.ac.uk[/C][/ROW]
[/TABLE]
Source: https://freestatistics.org/blog/index.php?pk=54404&T=0

Globally Unique Identifier (entire table): ba.freestatistics.org/blog/index.php?pk=54404&T=0

As an alternative you can also use a QR Code:  

The GUIDs for individual cells are displayed in the table below:

Summary of computational transaction
Raw Inputview raw input (R code)
Raw Outputview raw output of R engine
Computing time4 seconds
R Server'RServer@AstonUniversity' @ vre.aston.ac.uk


Model: Y[t] = c + b X[t] + e[t]
c-2.1950784821643e-07
b1.34058739846871

\begin{tabular}{lllllllll}
\hline
Model: Y[t] = c + b X[t] + e[t] \tabularnewline
c & -2.1950784821643e-07 \tabularnewline
b & 1.34058739846871 \tabularnewline
\hline
\end{tabular}
%Source: https://freestatistics.org/blog/index.php?pk=54404&T=1

[TABLE]
[ROW][C]Model: Y[t] = c + b X[t] + e[t][/C][/ROW]
[ROW][C]c[/C][C]-2.1950784821643e-07[/C][/ROW]
[ROW][C]b[/C][C]1.34058739846871[/C][/ROW]
[/TABLE]
Source: https://freestatistics.org/blog/index.php?pk=54404&T=1

Globally Unique Identifier (entire table): ba.freestatistics.org/blog/index.php?pk=54404&T=1

As an alternative you can also use a QR Code:  

The GUIDs for individual cells are displayed in the table below:

Model: Y[t] = c + b X[t] + e[t]
c-2.1950784821643e-07
b1.34058739846871


Descriptive Statistics about e[t]
# observations67
minimum-37621.2856912609
Q1-4399.93525870691
median1418.76859732061
mean2.22442296754748e-13
Q38426.86999224934
maximum21842.3427623789

\begin{tabular}{lllllllll}
\hline
Descriptive Statistics about e[t] \tabularnewline
# observations & 67 \tabularnewline
minimum & -37621.2856912609 \tabularnewline
Q1 & -4399.93525870691 \tabularnewline
median & 1418.76859732061 \tabularnewline
mean & 2.22442296754748e-13 \tabularnewline
Q3 & 8426.86999224934 \tabularnewline
maximum & 21842.3427623789 \tabularnewline
\hline
\end{tabular}
%Source: https://freestatistics.org/blog/index.php?pk=54404&T=2

[TABLE]
[ROW][C]Descriptive Statistics about e[t][/C][/ROW]
[ROW][C]# observations[/C][C]67[/C][/ROW]
[ROW][C]minimum[/C][C]-37621.2856912609[/C][/ROW]
[ROW][C]Q1[/C][C]-4399.93525870691[/C][/ROW]
[ROW][C]median[/C][C]1418.76859732061[/C][/ROW]
[ROW][C]mean[/C][C]2.22442296754748e-13[/C][/ROW]
[ROW][C]Q3[/C][C]8426.86999224934[/C][/ROW]
[ROW][C]maximum[/C][C]21842.3427623789[/C][/ROW]
[/TABLE]
Source: https://freestatistics.org/blog/index.php?pk=54404&T=2

Globally Unique Identifier (entire table): ba.freestatistics.org/blog/index.php?pk=54404&T=2

As an alternative you can also use a QR Code:  

The GUIDs for individual cells are displayed in the table below:

Descriptive Statistics about e[t]
# observations67
minimum-37621.2856912609
Q1-4399.93525870691
median1418.76859732061
mean2.22442296754748e-13
Q38426.86999224934
maximum21842.3427623789


Parameters (Session):
par1 = 0 ; par2 = 36 ;
Parameters (R input):
par1 = 0 ; par2 = 36 ;
R code (references can be found in the software module):
par1 <- as.numeric(par1)
par2 <- as.numeric(par2)
x <- as.ts(x)
y <- as.ts(y)
mylm <- lm(y~x)
cbind(mylm$resid)
library(lattice)
bitmap(file='pic1.png')
plot(y,type='l',main='Run Sequence Plot of Y[t]',xlab='time or index',ylab='value')
grid()
dev.off()
bitmap(file='pic1a.png')
plot(x,type='l',main='Run Sequence Plot of X[t]',xlab='time or index',ylab='value')
grid()
dev.off()
bitmap(file='pic1b.png')
plot(x,y,main='Scatter Plot',xlab='X[t]',ylab='Y[t]')
grid()
dev.off()
bitmap(file='pic1c.png')
plot(mylm$resid,type='l',main='Run Sequence Plot of e[t]',xlab='time or index',ylab='value')
grid()
dev.off()
bitmap(file='pic2.png')
hist(mylm$resid,main='Histogram of e[t]')
dev.off()
bitmap(file='pic3.png')
if (par1 > 0)
{
densityplot(~mylm$resid,col='black',main=paste('Density Plot of e[t] bw = ',par1),bw=par1)
} else {
densityplot(~mylm$resid,col='black',main='Density Plot of e[t]')
}
dev.off()
bitmap(file='pic4.png')
qqnorm(mylm$resid,main='QQ plot of e[t]')
qqline(mylm$resid)
grid()
dev.off()
if (par2 > 0)
{
bitmap(file='pic5.png')
acf(mylm$resid,lag.max=par2,main='Residual Autocorrelation Function')
grid()
dev.off()
}
summary(x)
load(file='createtable')
a<-table.start()
a<-table.row.start(a)
a<-table.element(a,'Model: Y[t] = c + b X[t] + e[t]',2,TRUE)
a<-table.row.end(a)
a<-table.row.start(a)
a<-table.element(a,'c',1,TRUE)
a<-table.element(a,mylm$coeff[[1]])
a<-table.row.end(a)
a<-table.row.start(a)
a<-table.element(a,'b',1,TRUE)
a<-table.element(a,mylm$coeff[[2]])
a<-table.row.end(a)
a<-table.end(a)
table.save(a,file='mytable.tab')
a<-table.start()
a<-table.row.start(a)
a<-table.element(a,'Descriptive Statistics about e[t]',2,TRUE)
a<-table.row.end(a)
a<-table.row.start(a)
a<-table.element(a,'# observations',header=TRUE)
a<-table.element(a,length(mylm$resid))
a<-table.row.end(a)
a<-table.row.start(a)
a<-table.element(a,'minimum',header=TRUE)
a<-table.element(a,min(mylm$resid))
a<-table.row.end(a)
a<-table.row.start(a)
a<-table.element(a,'Q1',header=TRUE)
a<-table.element(a,quantile(mylm$resid,0.25))
a<-table.row.end(a)
a<-table.row.start(a)
a<-table.element(a,'median',header=TRUE)
a<-table.element(a,median(mylm$resid))
a<-table.row.end(a)
a<-table.row.start(a)
a<-table.element(a,'mean',header=TRUE)
a<-table.element(a,mean(mylm$resid))
a<-table.row.end(a)
a<-table.row.start(a)
a<-table.element(a,'Q3',header=TRUE)
a<-table.element(a,quantile(mylm$resid,0.75))
a<-table.row.end(a)
a<-table.row.start(a)
a<-table.element(a,'maximum',header=TRUE)
a<-table.element(a,max(mylm$resid))
a<-table.row.end(a)
a<-table.end(a)
table.save(a,file='mytable.tab')