Free Statistics
of Irreproducible Research!
Description of Statistical Computation | |||||||||||||||||||||||||||||||||||||||||
|---|---|---|---|---|---|---|---|---|---|---|---|---|---|---|---|---|---|---|---|---|---|---|---|---|---|---|---|---|---|---|---|---|---|---|---|---|---|---|---|---|---|
| Author's title | |||||||||||||||||||||||||||||||||||||||||
| Author | *The author of this computation has been verified* | ||||||||||||||||||||||||||||||||||||||||
| R Software Module | rwasp_univariatedataseries.wasp | ||||||||||||||||||||||||||||||||||||||||
| Title produced by software | Univariate Data Series | ||||||||||||||||||||||||||||||||||||||||
| Date of computation | Thu, 05 Nov 2009 07:10:33 -0700 | ||||||||||||||||||||||||||||||||||||||||
| Cite this page as follows | Statistical Computations at FreeStatistics.org, Office for Research Development and Education, URL https://freestatistics.org/blog/index.php?v=date/2009/Nov/05/t1257430292ecjc0ii8ce7pxdh.htm/, Retrieved Thu, 02 May 2024 22:22:29 +0000 | ||||||||||||||||||||||||||||||||||||||||
| Statistical Computations at FreeStatistics.org, Office for Research Development and Education, URL https://freestatistics.org/blog/index.php?pk=54118, Retrieved Thu, 02 May 2024 22:22:29 +0000 | |||||||||||||||||||||||||||||||||||||||||
| QR Codes: | |||||||||||||||||||||||||||||||||||||||||
|
| |||||||||||||||||||||||||||||||||||||||||
| Original text written by user: | |||||||||||||||||||||||||||||||||||||||||
| IsPrivate? | No (this computation is public) | ||||||||||||||||||||||||||||||||||||||||
| User-defined keywords | |||||||||||||||||||||||||||||||||||||||||
| Estimated Impact | 130 | ||||||||||||||||||||||||||||||||||||||||
Tree of Dependent Computations | |||||||||||||||||||||||||||||||||||||||||
| Family? (F = Feedback message, R = changed R code, M = changed R Module, P = changed Parameters, D = changed Data) | |||||||||||||||||||||||||||||||||||||||||
| - [Univariate Data Series] [SHW WS5 - Part 1 ...] [2009-10-29 18:22:35] [253127ae8da904b75450fbd69fe4eb21] - M D [Univariate Data Series] [SHW WS5 - e(t) bi...] [2009-11-05 14:10:33] [b7e46d23597387652ca7420fdeb9acca] [Current] | |||||||||||||||||||||||||||||||||||||||||
| Feedback Forum | |||||||||||||||||||||||||||||||||||||||||
Post a new message | |||||||||||||||||||||||||||||||||||||||||
Dataset | |||||||||||||||||||||||||||||||||||||||||
| Dataseries X: | |||||||||||||||||||||||||||||||||||||||||
-213,8210971 207,7161938 64,00233585 208,9976319 12,45563704 48,45563704 -58,34709245 110,70896 204,1888445 -114,7101682 -84,1779371 -164,3242149 -77,95272934 372,8197109 54,7988296 324,6882565 -43,34221059 -165,4189664 -89,64670407 -98,33244688 -137,1400582 -324,4459056 -2,270514508 -14,62753244 -9,548424616 658,2740102 429,7341895 159,5128655 -41,83068289 -93,42990614 -255,7162261 -80,03283525 -248,9804887 -441,5798898 -321,3984409 -28,40097079 -209,4546712 -276,6261785 -305,2195218 -54,23263564 -329,041423 -308,433612 -98,80509761 -330,4226723 -80,04630484 -89,21699197 381,0679741 139,6988405 -65,44743738 80,87676143 708,6257905 812,0925613 159,9488133 -34,19122879 -38,34591646 -62,1084151 167,6857267 398,4017587 82,86582172 -396,5496006 | |||||||||||||||||||||||||||||||||||||||||
Tables (Output of Computation) | |||||||||||||||||||||||||||||||||||||||||
| |||||||||||||||||||||||||||||||||||||||||
Figures (Output of Computation) | |||||||||||||||||||||||||||||||||||||||||
Input Parameters & R Code | |||||||||||||||||||||||||||||||||||||||||
| Parameters (Session): | |||||||||||||||||||||||||||||||||||||||||
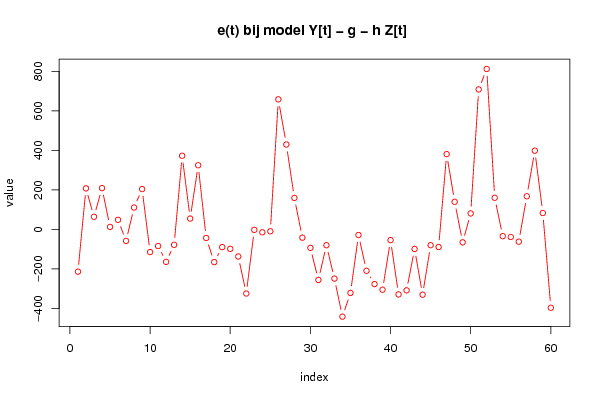
| par3 = e[t] bij model (Y[t] - g - h Z[t]) ; | |||||||||||||||||||||||||||||||||||||||||
| Parameters (R input): | |||||||||||||||||||||||||||||||||||||||||
| par1 = ; par2 = ; par3 = e[t] bij model (Y[t] - g - h Z[t]) ; | |||||||||||||||||||||||||||||||||||||||||
| R code (references can be found in the software module): | |||||||||||||||||||||||||||||||||||||||||
bitmap(file='test1.png') | |||||||||||||||||||||||||||||||||||||||||