Free Statistics
of Irreproducible Research!
Description of Statistical Computation | |||||||||||||||||||||||||||||||||||||||||||||||||||||
|---|---|---|---|---|---|---|---|---|---|---|---|---|---|---|---|---|---|---|---|---|---|---|---|---|---|---|---|---|---|---|---|---|---|---|---|---|---|---|---|---|---|---|---|---|---|---|---|---|---|---|---|---|---|
| Author's title | |||||||||||||||||||||||||||||||||||||||||||||||||||||
| Author | *The author of this computation has been verified* | ||||||||||||||||||||||||||||||||||||||||||||||||||||
| R Software Module | rwasp_edauni.wasp | ||||||||||||||||||||||||||||||||||||||||||||||||||||
| Title produced by software | Univariate Explorative Data Analysis | ||||||||||||||||||||||||||||||||||||||||||||||||||||
| Date of computation | Thu, 05 Nov 2009 03:51:20 -0700 | ||||||||||||||||||||||||||||||||||||||||||||||||||||
| Cite this page as follows | Statistical Computations at FreeStatistics.org, Office for Research Development and Education, URL https://freestatistics.org/blog/index.php?v=date/2009/Nov/05/t12574183347zhugu3n7nu0l1q.htm/, Retrieved Thu, 02 May 2024 20:56:31 +0000 | ||||||||||||||||||||||||||||||||||||||||||||||||||||
| Statistical Computations at FreeStatistics.org, Office for Research Development and Education, URL https://freestatistics.org/blog/index.php?pk=53970, Retrieved Thu, 02 May 2024 20:56:31 +0000 | |||||||||||||||||||||||||||||||||||||||||||||||||||||
| QR Codes: | |||||||||||||||||||||||||||||||||||||||||||||||||||||
|
| |||||||||||||||||||||||||||||||||||||||||||||||||||||
| Original text written by user: | |||||||||||||||||||||||||||||||||||||||||||||||||||||
| IsPrivate? | No (this computation is public) | ||||||||||||||||||||||||||||||||||||||||||||||||||||
| User-defined keywords | E(t) | ||||||||||||||||||||||||||||||||||||||||||||||||||||
| Estimated Impact | 85 | ||||||||||||||||||||||||||||||||||||||||||||||||||||
Tree of Dependent Computations | |||||||||||||||||||||||||||||||||||||||||||||||||||||
| Family? (F = Feedback message, R = changed R code, M = changed R Module, P = changed Parameters, D = changed Data) | |||||||||||||||||||||||||||||||||||||||||||||||||||||
| - [Univariate Explorative Data Analysis] [Ws 5 univariate E...] [2009-11-04 16:38:24] [62d3ced7fb1c10c35a82e9cb1d0d0e2b] - D [Univariate Explorative Data Analysis] [Ws 5] [2009-11-05 10:51:20] [d41d8cd98f00b204e9800998ecf8427e] [Current] - D [Univariate Explorative Data Analysis] [Ws 5] [2009-11-05 11:03:50] [74be16979710d4c4e7c6647856088456] | |||||||||||||||||||||||||||||||||||||||||||||||||||||
| Feedback Forum | |||||||||||||||||||||||||||||||||||||||||||||||||||||
Post a new message | |||||||||||||||||||||||||||||||||||||||||||||||||||||
Dataset | |||||||||||||||||||||||||||||||||||||||||||||||||||||
| Dataseries X: | |||||||||||||||||||||||||||||||||||||||||||||||||||||
-22,730 -16,730 -8,595 -8,449 -7,741 -6,460 -1,606 0,675 6,383 11,383 9,102 7,956 -1,325 3,237 4,810 7,518 7,383 -9,314 -10,741 -17,303 -15,584 -14,730 -17,157 -25,573 -35,989 -56,529 -64,788 -37,540 -24,124 -19,989 -16,989 -20,562 -17,562 -18,416 -26,832 -29,697 -28,697 -26,697 -26,551 -37,394 -46,248 -51,383 -62,518 -42,529 -35,956 -40,956 -46,091 -41,102 -30,540 -50,507 -31,102 -29,821 -23,259 -19,832 -22,686 -26,967 -31,394 -19,124 -29,405 -24,124 -25,978 -36,821 -35,394 -33,821 -33,394 -30,967 -24,832 -31,832 -46,956 -47,529 -49,102 -42,394 -51,967 -38,113 -38,967 -33,259 -26,416 -27,416 -33,405 -30,843 -32,124 -26,416 -23,843 -25,000 -23,427 -14,865 -16,292 -36,821 -22,281 -19,146 -22,573 -12,157 -16,292 -15,292 -19,146 -27,011 -26,584 -23,876 -38,157 -30,449 -33,303 -27,168 -24,314 -32,730 -40,865 -45,011 -51,427 -43,135 -41,135 -52,675 -59,507 -65,923 -58,204 -66,339 -64,485 -53,485 -50,058 -47,631 -44,923 -30,507 -31,507 | |||||||||||||||||||||||||||||||||||||||||||||||||||||
Tables (Output of Computation) | |||||||||||||||||||||||||||||||||||||||||||||||||||||
| |||||||||||||||||||||||||||||||||||||||||||||||||||||
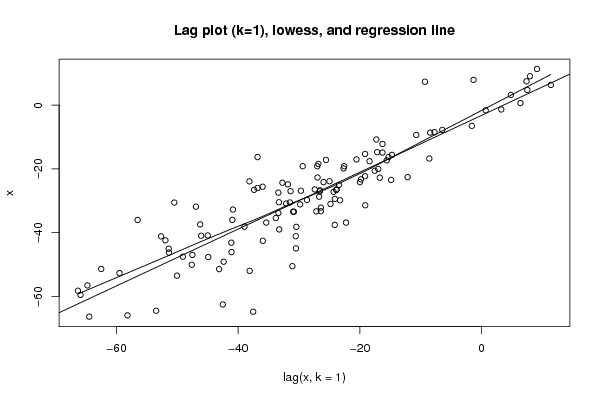
Figures (Output of Computation) | |||||||||||||||||||||||||||||||||||||||||||||||||||||
Input Parameters & R Code | |||||||||||||||||||||||||||||||||||||||||||||||||||||
| Parameters (Session): | |||||||||||||||||||||||||||||||||||||||||||||||||||||
| par1 = 0 ; par2 = 36 ; | |||||||||||||||||||||||||||||||||||||||||||||||||||||
| Parameters (R input): | |||||||||||||||||||||||||||||||||||||||||||||||||||||
| par1 = 0 ; par2 = 36 ; | |||||||||||||||||||||||||||||||||||||||||||||||||||||
| R code (references can be found in the software module): | |||||||||||||||||||||||||||||||||||||||||||||||||||||
par1 <- as.numeric(par1) | |||||||||||||||||||||||||||||||||||||||||||||||||||||