Free Statistics
of Irreproducible Research!
Description of Statistical Computation | |||||||||||||||||||||||||||||||||||||||||
|---|---|---|---|---|---|---|---|---|---|---|---|---|---|---|---|---|---|---|---|---|---|---|---|---|---|---|---|---|---|---|---|---|---|---|---|---|---|---|---|---|---|
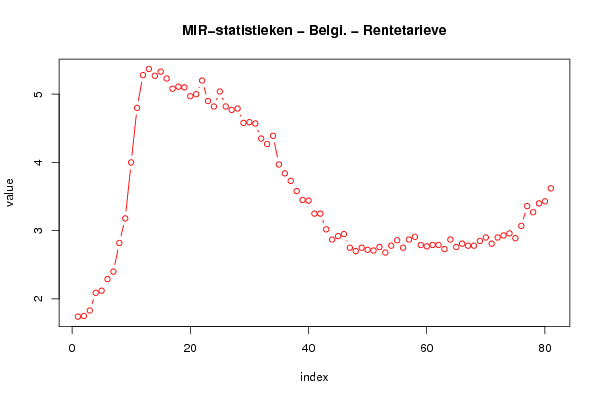
| Author's title | MIR-statistieken - Belgi� - Rentetarieven op leningen in EUR aan niet-finan... | ||||||||||||||||||||||||||||||||||||||||
| Author | *Unverified author* | ||||||||||||||||||||||||||||||||||||||||
| R Software Module | rwasp_univariatedataseries.wasp | ||||||||||||||||||||||||||||||||||||||||
| Title produced by software | Univariate Data Series | ||||||||||||||||||||||||||||||||||||||||
| Date of computation | Mon, 02 Nov 2009 15:01:33 -0700 | ||||||||||||||||||||||||||||||||||||||||
| Cite this page as follows | Statistical Computations at FreeStatistics.org, Office for Research Development and Education, URL https://freestatistics.org/blog/index.php?v=date/2009/Nov/02/t1257199327i31suiloswyf4us.htm/, Retrieved Sat, 04 May 2024 03:46:12 +0000 | ||||||||||||||||||||||||||||||||||||||||
| Statistical Computations at FreeStatistics.org, Office for Research Development and Education, URL https://freestatistics.org/blog/index.php?pk=53029, Retrieved Sat, 04 May 2024 03:46:12 +0000 | |||||||||||||||||||||||||||||||||||||||||
| QR Codes: | |||||||||||||||||||||||||||||||||||||||||
|
| |||||||||||||||||||||||||||||||||||||||||
| Original text written by user: | |||||||||||||||||||||||||||||||||||||||||
| IsPrivate? | No (this computation is public) | ||||||||||||||||||||||||||||||||||||||||
| User-defined keywords | |||||||||||||||||||||||||||||||||||||||||
| Estimated Impact | 136 | ||||||||||||||||||||||||||||||||||||||||
Tree of Dependent Computations | |||||||||||||||||||||||||||||||||||||||||
| Family? (F = Feedback message, R = changed R code, M = changed R Module, P = changed Parameters, D = changed Data) | |||||||||||||||||||||||||||||||||||||||||
| - [Univariate Data Series] [MIR-statistieken ...] [2009-11-02 22:01:33] [d41d8cd98f00b204e9800998ecf8427e] [Current] | |||||||||||||||||||||||||||||||||||||||||
| Feedback Forum | |||||||||||||||||||||||||||||||||||||||||
Post a new message | |||||||||||||||||||||||||||||||||||||||||
Dataset | |||||||||||||||||||||||||||||||||||||||||
| Dataseries X: | |||||||||||||||||||||||||||||||||||||||||
1,74 1,75 1,83 2,09 2,12 2,29 2,4 2,82 3,18 4 4,8 5,28 5,37 5,27 5,33 5,23 5,08 5,11 5,1 4,97 5 5,2 4,9 4,82 5,04 4,82 4,77 4,79 4,58 4,59 4,57 4,35 4,27 4,39 3,97 3,84 3,73 3,58 3,45 3,44 3,25 3,25 3,02 2,87 2,92 2,95 2,75 2,7 2,75 2,72 2,71 2,76 2,68 2,78 2,86 2,75 2,87 2,91 2,79 2,77 2,79 2,79 2,73 2,87 2,76 2,81 2,78 2,78 2,85 2,9 2,81 2,9 2,93 2,96 2,89 3,07 3,36 3,27 3,4 3,43 3,62 | |||||||||||||||||||||||||||||||||||||||||
Tables (Output of Computation) | |||||||||||||||||||||||||||||||||||||||||
| |||||||||||||||||||||||||||||||||||||||||
Figures (Output of Computation) | |||||||||||||||||||||||||||||||||||||||||
Input Parameters & R Code | |||||||||||||||||||||||||||||||||||||||||
| Parameters (Session): | |||||||||||||||||||||||||||||||||||||||||
| par1 = MIR-statistieken - Belgi� - Rentetarieven op leningen in EUR aan niet-financi�le vennootschappen - nieuwe contracten - Overige leningen voor een bedrag van meer dan 1 miljoen EUR - Variabel tarief en initi�le rentebepaling tot ��n jaar ; par2 = http://www.nbb.be/belgostat/SeriesLinker ; | |||||||||||||||||||||||||||||||||||||||||
| Parameters (R input): | |||||||||||||||||||||||||||||||||||||||||
| par1 = MIR-statistieken - Belgi� - Rentetarieven op leningen in EUR aan niet-financi�le vennootschappen - nieuwe contracten - Overige leningen voor een bedrag van meer dan 1 miljoen EUR - Variabel tarief en initi�le rentebepaling tot ��n jaar ; par2 = http://www.nbb.be/belgostat/SeriesLinker ; par3 = ; | |||||||||||||||||||||||||||||||||||||||||
| R code (references can be found in the software module): | |||||||||||||||||||||||||||||||||||||||||
bitmap(file='test1.png') | |||||||||||||||||||||||||||||||||||||||||