Free Statistics

of Irreproducible Research!

Author's title

Author*The author of this computation has been verified*
R Software Modulerwasp_edabi.wasp
Title produced by softwareBivariate Explorative Data Analysis
Date of computationMon, 02 Nov 2009 14:12:57 -0700
Cite this page as followsStatistical Computations at FreeStatistics.org, Office for Research Development and Education, URL https://freestatistics.org/blog/index.php?v=date/2009/Nov/02/t1257196468pfig6r8p49dayaw.htm/, Retrieved Fri, 03 May 2024 20:06:58 +0000
Statistical Computations at FreeStatistics.org, Office for Research Development and Education, URL https://freestatistics.org/blog/index.php?pk=52986, Retrieved Fri, 03 May 2024 20:06:58 +0000
QR Codes:

Original text written by user:
IsPrivate?No (this computation is public)
User-defined keywords
Estimated Impact114
Family? (F = Feedback message, R = changed R code, M = changed R Module, P = changed Parameters, D = changed Data)
-     [Partial Correlation] [Workshop 5 correl...] [2009-10-29 15:05:45] [eaf42bcf5162b5692bb3c7f9d4636222]
- RMPD  [Bivariate Explorative Data Analysis] [workshop 5 bivari...] [2009-10-29 16:50:15] [eaf42bcf5162b5692bb3c7f9d4636222]
-  M D      [Bivariate Explorative Data Analysis] [WS5 bivariate EDA...] [2009-11-02 21:12:57] [557d56ec4b06cd0135c259898de8ce95] [Current]
Feedback Forum

Post a new message
Dataseries X:
1,4
1,3
1,3
1,2
1,1
1,4
1,2
1,5
1,1
1,3
1,5
1,1
1,4
1,3
1,5
1,6
1,7
1,1
1,6
1,3
1,7
1,6
1,7
1,9
1,8
1,9
1,6
1,5
1,6
1,6
1,7
2
2
1,9
1,7
1,8
1,9
1,7
2
2,1
2,4
2,5
2,5
2,6
2,2
2,5
2,8
2,8
2,9
3
3,1
2,9
2,7
2,2
2,5
2,3
2,6
2,3
2,2
1,8
Dataseries Y:
9904,642857
13710,15385
13747,69231
14517
15185,81818
11422,28571
13819,66667
12749
16217
13238
12391
14780,09091
10815,42857
14770,84615
11831
11931,3125
10611,94118
15923,18182
11094,875
16209,53846
10100
12149,6875
11644,35294
9249,947368
8980,777778
10244,52632
12457,5625
13307,46667
10839,625
11827,625
10925,94118
10675,3
9297,3
10433,21053
12261,41176
10911,22222
9334,421053
11655,05882
11080
9840,142857
7448,916667
8362,6
8465,64
8220,923077
10432,86364
8537,4
8535,464286
7997,464286
6301,413793
7595,566667
7200,483871
6152,482759
6064,259259
7269,909091
6578,44
7708,26087
6401,153846
7042,043478
8296,409091
9613,333333


Summary of computational transaction
Raw Inputview raw input (R code)
Raw Outputview raw output of R engine
Computing time5 seconds
R Server'RServer@AstonUniversity' @ vre.aston.ac.uk

\begin{tabular}{lllllllll}
\hline
Summary of computational transaction \tabularnewline
Raw Input & view raw input (R code)  \tabularnewline
Raw Output & view raw output of R engine  \tabularnewline
Computing time & 5 seconds \tabularnewline
R Server & 'RServer@AstonUniversity' @ vre.aston.ac.uk \tabularnewline
\hline
\end{tabular}
%Source: https://freestatistics.org/blog/index.php?pk=52986&T=0

[TABLE]
[ROW][C]Summary of computational transaction[/C][/ROW]
[ROW][C]Raw Input[/C][C]view raw input (R code) [/C][/ROW]
[ROW][C]Raw Output[/C][C]view raw output of R engine [/C][/ROW]
[ROW][C]Computing time[/C][C]5 seconds[/C][/ROW]
[ROW][C]R Server[/C][C]'RServer@AstonUniversity' @ vre.aston.ac.uk[/C][/ROW]
[/TABLE]
Source: https://freestatistics.org/blog/index.php?pk=52986&T=0

Globally Unique Identifier (entire table): ba.freestatistics.org/blog/index.php?pk=52986&T=0

As an alternative you can also use a QR Code:  

The GUIDs for individual cells are displayed in the table below:

Summary of computational transaction
Raw Inputview raw input (R code)
Raw Outputview raw output of R engine
Computing time5 seconds
R Server'RServer@AstonUniversity' @ vre.aston.ac.uk


Model: Y[t] = c + b X[t] + e[t]
c18978.6528963701
b-4430.4064559542

\begin{tabular}{lllllllll}
\hline
Model: Y[t] = c + b X[t] + e[t] \tabularnewline
c & 18978.6528963701 \tabularnewline
b & -4430.4064559542 \tabularnewline
\hline
\end{tabular}
%Source: https://freestatistics.org/blog/index.php?pk=52986&T=1

[TABLE]
[ROW][C]Model: Y[t] = c + b X[t] + e[t][/C][/ROW]
[ROW][C]c[/C][C]18978.6528963701[/C][/ROW]
[ROW][C]b[/C][C]-4430.4064559542[/C][/ROW]
[/TABLE]
Source: https://freestatistics.org/blog/index.php?pk=52986&T=1

Globally Unique Identifier (entire table): ba.freestatistics.org/blog/index.php?pk=52986&T=1

As an alternative you can also use a QR Code:  

The GUIDs for individual cells are displayed in the table below:

Model: Y[t] = c + b X[t] + e[t]
c18978.6528963701
b-4430.4064559542


Descriptive Statistics about e[t]
# observations60
minimum-2871.44100103425
Q1-939.586253276588
median107.729154168065
mean2.82773804372027e-14
Q3696.495577912341
maximum2990.41395637035

\begin{tabular}{lllllllll}
\hline
Descriptive Statistics about e[t] \tabularnewline
# observations & 60 \tabularnewline
minimum & -2871.44100103425 \tabularnewline
Q1 & -939.586253276588 \tabularnewline
median & 107.729154168065 \tabularnewline
mean & 2.82773804372027e-14 \tabularnewline
Q3 & 696.495577912341 \tabularnewline
maximum & 2990.41395637035 \tabularnewline
\hline
\end{tabular}
%Source: https://freestatistics.org/blog/index.php?pk=52986&T=2

[TABLE]
[ROW][C]Descriptive Statistics about e[t][/C][/ROW]
[ROW][C]# observations[/C][C]60[/C][/ROW]
[ROW][C]minimum[/C][C]-2871.44100103425[/C][/ROW]
[ROW][C]Q1[/C][C]-939.586253276588[/C][/ROW]
[ROW][C]median[/C][C]107.729154168065[/C][/ROW]
[ROW][C]mean[/C][C]2.82773804372027e-14[/C][/ROW]
[ROW][C]Q3[/C][C]696.495577912341[/C][/ROW]
[ROW][C]maximum[/C][C]2990.41395637035[/C][/ROW]
[/TABLE]
Source: https://freestatistics.org/blog/index.php?pk=52986&T=2

Globally Unique Identifier (entire table): ba.freestatistics.org/blog/index.php?pk=52986&T=2

As an alternative you can also use a QR Code:  

The GUIDs for individual cells are displayed in the table below:

Descriptive Statistics about e[t]
# observations60
minimum-2871.44100103425
Q1-939.586253276588
median107.729154168065
mean2.82773804372027e-14
Q3696.495577912341
maximum2990.41395637035


Parameters (Session):
par1 = 0 ; par2 = 36 ;
Parameters (R input):
par1 = 0 ; par2 = 36 ;
R code (references can be found in the software module):
par1 <- as.numeric(par1)
par2 <- as.numeric(par2)
x <- as.ts(x)
y <- as.ts(y)
mylm <- lm(y~x)
cbind(mylm$resid)
library(lattice)
bitmap(file='pic1.png')
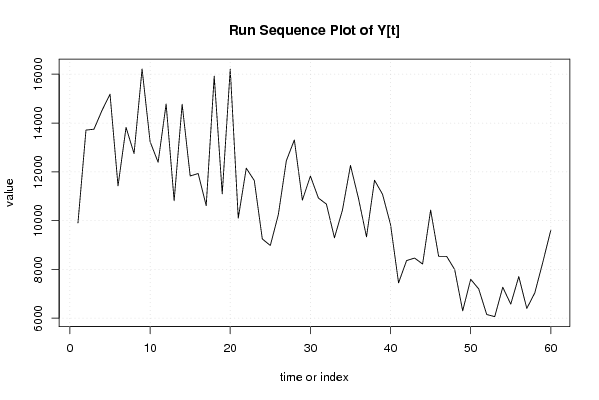
plot(y,type='l',main='Run Sequence Plot of Y[t]',xlab='time or index',ylab='value')
grid()
dev.off()
bitmap(file='pic1a.png')
plot(x,type='l',main='Run Sequence Plot of X[t]',xlab='time or index',ylab='value')
grid()
dev.off()
bitmap(file='pic1b.png')
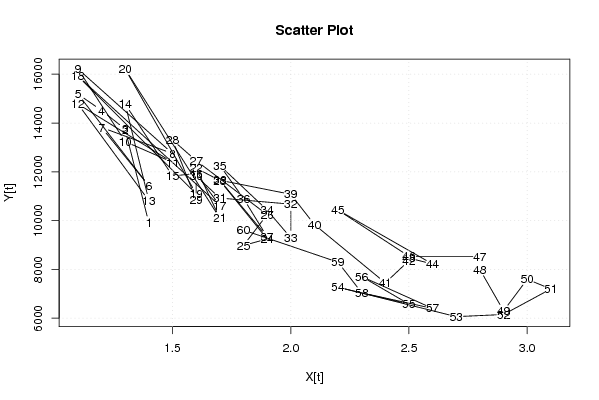
plot(x,y,main='Scatter Plot',xlab='X[t]',ylab='Y[t]')
grid()
dev.off()
bitmap(file='pic1c.png')
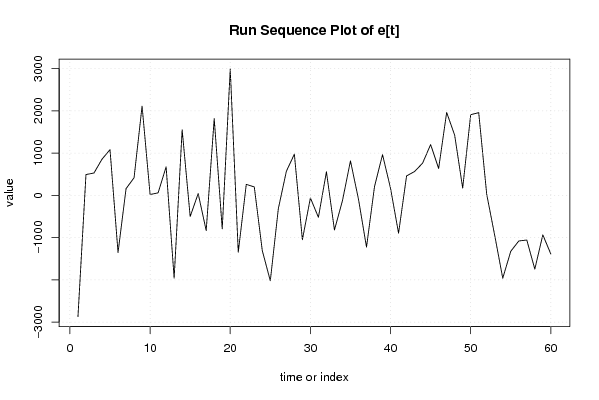
plot(mylm$resid,type='l',main='Run Sequence Plot of e[t]',xlab='time or index',ylab='value')
grid()
dev.off()
bitmap(file='pic2.png')
hist(mylm$resid,main='Histogram of e[t]')
dev.off()
bitmap(file='pic3.png')
if (par1 > 0)
{
densityplot(~mylm$resid,col='black',main=paste('Density Plot of e[t] bw = ',par1),bw=par1)
} else {
densityplot(~mylm$resid,col='black',main='Density Plot of e[t]')
}
dev.off()
bitmap(file='pic4.png')
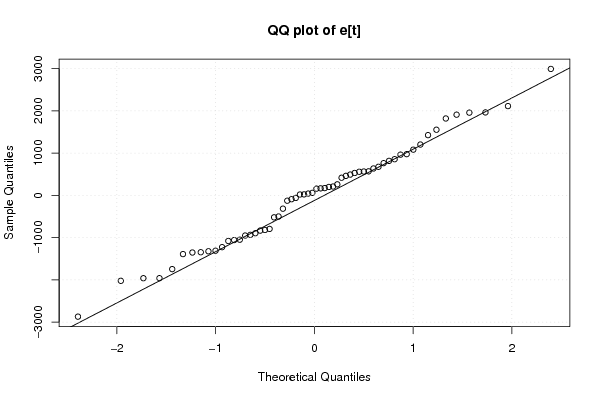
qqnorm(mylm$resid,main='QQ plot of e[t]')
qqline(mylm$resid)
grid()
dev.off()
if (par2 > 0)
{
bitmap(file='pic5.png')
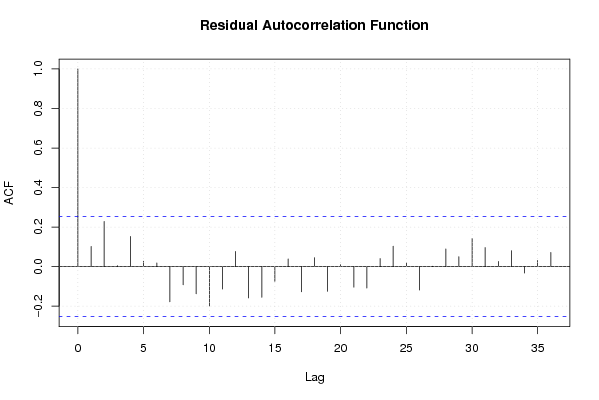
acf(mylm$resid,lag.max=par2,main='Residual Autocorrelation Function')
grid()
dev.off()
}
summary(x)
load(file='createtable')
a<-table.start()
a<-table.row.start(a)
a<-table.element(a,'Model: Y[t] = c + b X[t] + e[t]',2,TRUE)
a<-table.row.end(a)
a<-table.row.start(a)
a<-table.element(a,'c',1,TRUE)
a<-table.element(a,mylm$coeff[[1]])
a<-table.row.end(a)
a<-table.row.start(a)
a<-table.element(a,'b',1,TRUE)
a<-table.element(a,mylm$coeff[[2]])
a<-table.row.end(a)
a<-table.end(a)
table.save(a,file='mytable.tab')
a<-table.start()
a<-table.row.start(a)
a<-table.element(a,'Descriptive Statistics about e[t]',2,TRUE)
a<-table.row.end(a)
a<-table.row.start(a)
a<-table.element(a,'# observations',header=TRUE)
a<-table.element(a,length(mylm$resid))
a<-table.row.end(a)
a<-table.row.start(a)
a<-table.element(a,'minimum',header=TRUE)
a<-table.element(a,min(mylm$resid))
a<-table.row.end(a)
a<-table.row.start(a)
a<-table.element(a,'Q1',header=TRUE)
a<-table.element(a,quantile(mylm$resid,0.25))
a<-table.row.end(a)
a<-table.row.start(a)
a<-table.element(a,'median',header=TRUE)
a<-table.element(a,median(mylm$resid))
a<-table.row.end(a)
a<-table.row.start(a)
a<-table.element(a,'mean',header=TRUE)
a<-table.element(a,mean(mylm$resid))
a<-table.row.end(a)
a<-table.row.start(a)
a<-table.element(a,'Q3',header=TRUE)
a<-table.element(a,quantile(mylm$resid,0.75))
a<-table.row.end(a)
a<-table.row.start(a)
a<-table.element(a,'maximum',header=TRUE)
a<-table.element(a,max(mylm$resid))
a<-table.row.end(a)
a<-table.end(a)
table.save(a,file='mytable.tab')