Free Statistics

of Irreproducible Research!

Author's title

Author*The author of this computation has been verified*
R Software Modulerwasp_edabi.wasp
Title produced by softwareBivariate Explorative Data Analysis
Date of computationMon, 02 Nov 2009 13:38:40 -0700
Cite this page as followsStatistical Computations at FreeStatistics.org, Office for Research Development and Education, URL https://freestatistics.org/blog/index.php?v=date/2009/Nov/02/t12571944611u6dnjcr8tla0sh.htm/, Retrieved Fri, 03 May 2024 15:03:37 +0000
Statistical Computations at FreeStatistics.org, Office for Research Development and Education, URL https://freestatistics.org/blog/index.php?pk=52969, Retrieved Fri, 03 May 2024 15:03:37 +0000
QR Codes:

Original text written by user:
IsPrivate?No (this computation is public)
User-defined keywords
Estimated Impact149
Family? (F = Feedback message, R = changed R code, M = changed R Module, P = changed Parameters, D = changed Data)
-     [Bivariate Explorative Data Analysis] [WS 5] [2009-11-02 19:15:59] [023d83ebdf42a2acf423907b4076e8a1]
-    D    [Bivariate Explorative Data Analysis] [WS 5] [2009-11-02 20:38:40] [9f6463b67b1eb7bae5c03a796abf0348] [Current]
Feedback Forum

Post a new message
Dataseries X:
-43.46299021
-80.75309516
-70.74336158
38.9668564
103.8074054
-154.6120618
80.77812389
-8.071755014
98.25849525
-30.58100421
-44.78092348
40.3791734
-132.19098
-76.88100421
-106.2410204
-60.55099614
-2.200632843
-67.52066514
-28.0902534
-21.31993855
204.9200453
-150.9996641
90.49044089
3.190198694
-95.23997084
-53.65976094
-80.03964792
206.0103925
95.62085262
70.15086069
-4.308751793
-9.298856744
138.9711352
77.72149848
281.4313935
108.1314743
118.3119264
-143.9872663
73.21297587
215.4333311
67.37396079
-107.8253934
-100.1751915
-279.1043923
25.05610826
71.32658458
126.5560275
225.3961728
229.2960114
-32.31452952
256.6652767
74.69536553
8.935672307
161.5151556
-242.1946587
-173.2347233
-53.46489282
-290.1749493
-360.6546748
-187.924909
Dataseries Y:
-104.3228528
-171.3642244
-215.7228662
-133.9699868
-26.58093072
-258.1265975
-32.55203117
-94.68086414
41.89234377
-19.77428408
-18.40388067
44.62190258
-129.5594216
-50.96458948
-57.05684599
-17.93134275
27.22535774
-22.36155521
22.42601226
14.67274586
193.4889668
-141.7736931
100.1066106
-6.800489974
-103.3154616
-44.07404359
-91.14577152
167.5350613
90.87928764
59.18225146
-16.60445579
-47.64312038
100.7602759
59.1304689
235.5742541
72.38114038
76.37033171
-183.5795384
9.513535843
171.4591524
34.29768769
-121.3369608
-157.0214099
-322.7057413
9.850056448
72.29444983
95.86798799
249.1312608
289.0220777
89.91889362
423.6310857
182.9835906
144.8472988
319.6374419
-101.2462938
-46.42156961
30.06393293
-236.7016685
-303.3694895
-151.653482


Summary of computational transaction
Raw Inputview raw input (R code)
Raw Outputview raw output of R engine
Computing time5 seconds
R Server'Sir Ronald Aylmer Fisher' @ 193.190.124.24

\begin{tabular}{lllllllll}
\hline
Summary of computational transaction \tabularnewline
Raw Input & view raw input (R code)  \tabularnewline
Raw Output & view raw output of R engine  \tabularnewline
Computing time & 5 seconds \tabularnewline
R Server & 'Sir Ronald Aylmer Fisher' @ 193.190.124.24 \tabularnewline
\hline
\end{tabular}
%Source: https://freestatistics.org/blog/index.php?pk=52969&T=0

[TABLE]
[ROW][C]Summary of computational transaction[/C][/ROW]
[ROW][C]Raw Input[/C][C]view raw input (R code) [/C][/ROW]
[ROW][C]Raw Output[/C][C]view raw output of R engine [/C][/ROW]
[ROW][C]Computing time[/C][C]5 seconds[/C][/ROW]
[ROW][C]R Server[/C][C]'Sir Ronald Aylmer Fisher' @ 193.190.124.24[/C][/ROW]
[/TABLE]
Source: https://freestatistics.org/blog/index.php?pk=52969&T=0

Globally Unique Identifier (entire table): ba.freestatistics.org/blog/index.php?pk=52969&T=0

As an alternative you can also use a QR Code:  

The GUIDs for individual cells are displayed in the table below:

Summary of computational transaction
Raw Inputview raw input (R code)
Raw Outputview raw output of R engine
Computing time5 seconds
R Server'Sir Ronald Aylmer Fisher' @ 193.190.124.24


Model: Y[t] = c + b X[t] + e[t]
c6.11007120484276e-10
b0.946991543411035

\begin{tabular}{lllllllll}
\hline
Model: Y[t] = c + b X[t] + e[t] \tabularnewline
c & 6.11007120484276e-10 \tabularnewline
b & 0.946991543411035 \tabularnewline
\hline
\end{tabular}
%Source: https://freestatistics.org/blog/index.php?pk=52969&T=1

[TABLE]
[ROW][C]Model: Y[t] = c + b X[t] + e[t][/C][/ROW]
[ROW][C]c[/C][C]6.11007120484276e-10[/C][/ROW]
[ROW][C]b[/C][C]0.946991543411035[/C][/ROW]
[/TABLE]
Source: https://freestatistics.org/blog/index.php?pk=52969&T=1

Globally Unique Identifier (entire table): ba.freestatistics.org/blog/index.php?pk=52969&T=1

As an alternative you can also use a QR Code:  

The GUIDs for individual cells are displayed in the table below:

Model: Y[t] = c + b X[t] + e[t]
c6.11007120484276e-10
b0.946991543411035


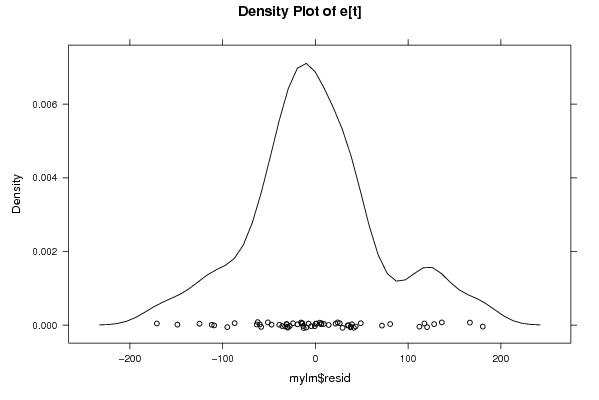
Descriptive Statistics about e[t]
# observations60
minimum-170.871270284723
Q1-33.3333082599054
median-5.81285090122018
mean7.11583569845686e-16
Q336.2851320794862
maximum180.571239177236

\begin{tabular}{lllllllll}
\hline
Descriptive Statistics about e[t] \tabularnewline
# observations & 60 \tabularnewline
minimum & -170.871270284723 \tabularnewline
Q1 & -33.3333082599054 \tabularnewline
median & -5.81285090122018 \tabularnewline
mean & 7.11583569845686e-16 \tabularnewline
Q3 & 36.2851320794862 \tabularnewline
maximum & 180.571239177236 \tabularnewline
\hline
\end{tabular}
%Source: https://freestatistics.org/blog/index.php?pk=52969&T=2

[TABLE]
[ROW][C]Descriptive Statistics about e[t][/C][/ROW]
[ROW][C]# observations[/C][C]60[/C][/ROW]
[ROW][C]minimum[/C][C]-170.871270284723[/C][/ROW]
[ROW][C]Q1[/C][C]-33.3333082599054[/C][/ROW]
[ROW][C]median[/C][C]-5.81285090122018[/C][/ROW]
[ROW][C]mean[/C][C]7.11583569845686e-16[/C][/ROW]
[ROW][C]Q3[/C][C]36.2851320794862[/C][/ROW]
[ROW][C]maximum[/C][C]180.571239177236[/C][/ROW]
[/TABLE]
Source: https://freestatistics.org/blog/index.php?pk=52969&T=2

Globally Unique Identifier (entire table): ba.freestatistics.org/blog/index.php?pk=52969&T=2

As an alternative you can also use a QR Code:  

The GUIDs for individual cells are displayed in the table below:

Descriptive Statistics about e[t]
# observations60
minimum-170.871270284723
Q1-33.3333082599054
median-5.81285090122018
mean7.11583569845686e-16
Q336.2851320794862
maximum180.571239177236


Parameters (Session):
par1 = 0 ; par2 = 36 ;
Parameters (R input):
par1 = 0 ; par2 = 36 ;
R code (references can be found in the software module):
par1 <- as.numeric(par1)
par2 <- as.numeric(par2)
x <- as.ts(x)
y <- as.ts(y)
mylm <- lm(y~x)
cbind(mylm$resid)
library(lattice)
bitmap(file='pic1.png')
plot(y,type='l',main='Run Sequence Plot of Y[t]',xlab='time or index',ylab='value')
grid()
dev.off()
bitmap(file='pic1a.png')
plot(x,type='l',main='Run Sequence Plot of X[t]',xlab='time or index',ylab='value')
grid()
dev.off()
bitmap(file='pic1b.png')
plot(x,y,main='Scatter Plot',xlab='X[t]',ylab='Y[t]')
grid()
dev.off()
bitmap(file='pic1c.png')
plot(mylm$resid,type='l',main='Run Sequence Plot of e[t]',xlab='time or index',ylab='value')
grid()
dev.off()
bitmap(file='pic2.png')
hist(mylm$resid,main='Histogram of e[t]')
dev.off()
bitmap(file='pic3.png')
if (par1 > 0)
{
densityplot(~mylm$resid,col='black',main=paste('Density Plot of e[t] bw = ',par1),bw=par1)
} else {
densityplot(~mylm$resid,col='black',main='Density Plot of e[t]')
}
dev.off()
bitmap(file='pic4.png')
qqnorm(mylm$resid,main='QQ plot of e[t]')
qqline(mylm$resid)
grid()
dev.off()
if (par2 > 0)
{
bitmap(file='pic5.png')
acf(mylm$resid,lag.max=par2,main='Residual Autocorrelation Function')
grid()
dev.off()
}
summary(x)
load(file='createtable')
a<-table.start()
a<-table.row.start(a)
a<-table.element(a,'Model: Y[t] = c + b X[t] + e[t]',2,TRUE)
a<-table.row.end(a)
a<-table.row.start(a)
a<-table.element(a,'c',1,TRUE)
a<-table.element(a,mylm$coeff[[1]])
a<-table.row.end(a)
a<-table.row.start(a)
a<-table.element(a,'b',1,TRUE)
a<-table.element(a,mylm$coeff[[2]])
a<-table.row.end(a)
a<-table.end(a)
table.save(a,file='mytable.tab')
a<-table.start()
a<-table.row.start(a)
a<-table.element(a,'Descriptive Statistics about e[t]',2,TRUE)
a<-table.row.end(a)
a<-table.row.start(a)
a<-table.element(a,'# observations',header=TRUE)
a<-table.element(a,length(mylm$resid))
a<-table.row.end(a)
a<-table.row.start(a)
a<-table.element(a,'minimum',header=TRUE)
a<-table.element(a,min(mylm$resid))
a<-table.row.end(a)
a<-table.row.start(a)
a<-table.element(a,'Q1',header=TRUE)
a<-table.element(a,quantile(mylm$resid,0.25))
a<-table.row.end(a)
a<-table.row.start(a)
a<-table.element(a,'median',header=TRUE)
a<-table.element(a,median(mylm$resid))
a<-table.row.end(a)
a<-table.row.start(a)
a<-table.element(a,'mean',header=TRUE)
a<-table.element(a,mean(mylm$resid))
a<-table.row.end(a)
a<-table.row.start(a)
a<-table.element(a,'Q3',header=TRUE)
a<-table.element(a,quantile(mylm$resid,0.75))
a<-table.row.end(a)
a<-table.row.start(a)
a<-table.element(a,'maximum',header=TRUE)
a<-table.element(a,max(mylm$resid))
a<-table.row.end(a)
a<-table.end(a)
table.save(a,file='mytable.tab')