Free Statistics
of Irreproducible Research!
Description of Statistical Computation | |
|---|---|
| Author's title | |
| Author | *Unverified author* |
| R Software Module | Rscript (source code is shown below) |
| Title produced by software | R console |
| Date of computation | Tue, 26 May 2009 13:16:03 -0600 |
| Cite this page as follows | Statistical Computations at FreeStatistics.org, Office for Research Development and Education, URL https://freestatistics.org/blog/index.php?v=date/2009/May/26/t1243365364pxe1c04czje2ktu.htm/, Retrieved Sun, 13 Jul 2025 06:08:03 +0000 |
| Statistical Computations at FreeStatistics.org, Office for Research Development and Education, URL https://freestatistics.org/blog/index.php?pk=40390, Retrieved Sun, 13 Jul 2025 06:08:03 +0000 | |
| QR Codes: | |
|
| |
| Original text written by user: | |
| IsPrivate? | No (this computation is public) |
| User-defined keywords | |
| Estimated Impact | 178 |
Tree of Dependent Computations | |
| Family? (F = Feedback message, R = changed R code, M = changed R Module, P = changed Parameters, D = changed Data) | |
| - [R console] [test] [2009-05-26 19:16:03] [b768c7adc2675864c15627b87ad9ef22] [Current] | |
| Feedback Forum | |
Post a new message | |
Dataset | |
| Dataseries X: | |
1.03457377339473 0.0245556021740766 -1.13082849565603 0.486280072315775 -0.521945662252802 0.253110485130989 -0.516971093849468 2.30900360630029 -0.598791614339322 0.152722698678174 1.45571726434729 0.746966022337334 -1.56285162797616 -0.109565054797920 -0.620190297996724 -0.204451413200669 -0.595187226820748 -0.604039555496071 -0.329562404854239 0.132386132109465 1.55514942919151 -0.994680843342577 0.861469643086633 0.269788492664246 -0.604191000837449 0.890207440343845 -0.76192963164353 0.725879169264903 0.165620885683184 -2.45948733708593 0.765249295751463 1.65809986697784 -0.563480082565552 -2.1133721374791 1.15027057685573 1.32319519416386 -0.396736252753726 -1.65370105620254 -1.00283630218436 0.0816733560560382 -0.826554785803117 -1.23849135069879 0.00352136084280422 0.493819157632048 0.292486860326535 0.184127998271585 -0.178469814193132 1.55240434137003 0.064523288364968 -1.74989792470977 0.745458414118657 -0.0731497120046219 -0.831156043664095 -0.40908937208561 -0.99516798434161 1.68473644340854 -2.20656009261607 -0.82275668644212 -1.02472395923675 -0.71275947046212 -0.470544781503504 -0.112132945500297 -0.498643339666308 1.68512007476340 0.751992895060032 0.585079556396017 -1.44867934245137 -0.84944070495288 1.18792320991735 -0.979109093788344 0.820935016833558 -0.549035468670756 0.128690356328958 -0.830025524526681 -1.29448203078145 0.605108276529092 0.364801516167286 -1.4921704657591 -1.00166359787754 -1.61175543843240 -1.4353131681112 1.66613588638101 -0.811128397206669 -0.954001542801282 -0.255149232657320 0.367225979613626 -0.139010990490679 -1.20001430607324 1.46361380294951 0.499971370023098 0.854165112193906 -1.10755020428843 -0.988531022693853 -1.39883653515158 1.05706591956020 -0.972947301797297 -0.384897302914933 1.73121513554866 0.801665811027092 -0.972074036436578 | |
Tables (Output of Computation) | |
> first_number = 5
> second_number = 7
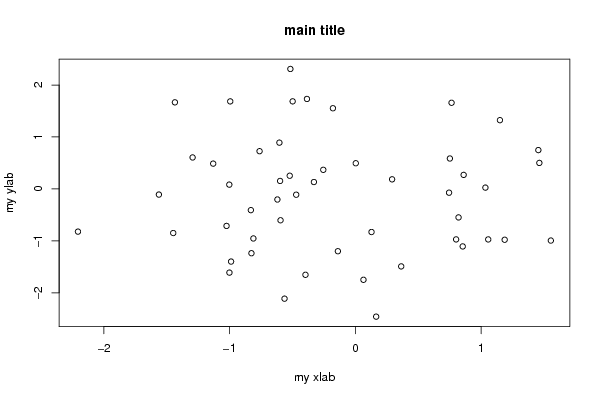
> strpar = 'main title'
> {
+ myfun <- function(x, y) {
+ x + y
+ }
+
+ plot(RCx, main = strpar, xlab = 'my xlab', ylab = 'my ylab')
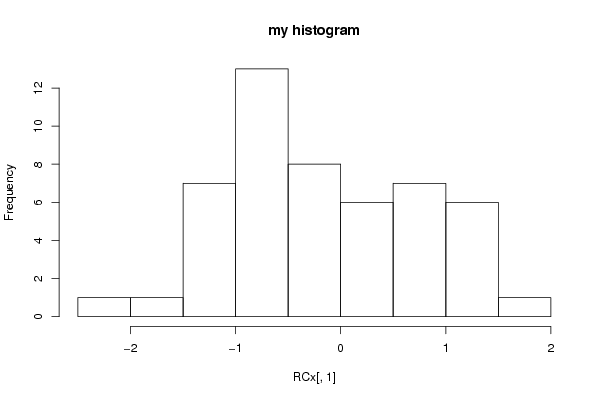
+ hist(R .... [TRUNCATED]
[1] 12
| |
Figures (Output of Computation) | |
Input Parameters & R Code | |
| Parameters (Session): | |
| par1 = 5 ; par2 = 7 ; par3 = maintitle ; | |
| Parameters (R input): | |
| R code (body of R function): | |
{ | |