Free Statistics
of Irreproducible Research!
Description of Statistical Computation | |
|---|---|
| Author's title | |
| Author | *The author of this computation has been verified* |
| R Software Module | Rscript (source code is shown below) |
| Title produced by software | R console |
| Date of computation | Tue, 26 May 2009 12:45:10 -0600 |
| Cite this page as follows | Statistical Computations at FreeStatistics.org, Office for Research Development and Education, URL https://freestatistics.org/blog/index.php?v=date/2009/May/26/t12433635121r419r9jl0xii7a.htm/, Retrieved Fri, 04 Jul 2025 09:05:00 +0000 |
| Statistical Computations at FreeStatistics.org, Office for Research Development and Education, URL https://freestatistics.org/blog/index.php?pk=40389, Retrieved Fri, 04 Jul 2025 09:05:00 +0000 | |
| QR Codes: | |
|
| |
| Original text written by user: | |
| IsPrivate? | No (this computation is public) |
| User-defined keywords | |
| Estimated Impact | 180 |
Tree of Dependent Computations | |
| Family? (F = Feedback message, R = changed R code, M = changed R Module, P = changed Parameters, D = changed Data) | |
| - [R console] [test] [2009-05-26 18:45:10] [21232f297a57a5a743894a0e4a801fc3] [Current] | |
| Feedback Forum | |
Post a new message | |
Dataset | |
| Dataseries X: | |
-0.338101979982859 1.07560366006595 1.61517817253464 0.27177523963557 1.46623723549711 2.43518963477864 -1.16921145070498 -2.13572328176156 2.04673875489599 -1.14438131839759 1.86245250050615 1.89840382646629 0.197874288603110 0.783699729322663 0.094285661240692 0.752221293367222 0.138190210424811 -0.0359559976882205 1.38554531465189 -0.0986602656243184 1.30045555724086 0.212441987745742 1.34089698233620 0.169312213659954 -0.0961782339845624 1.50103210618458 -0.780074656896415 -1.45015886781091 -1.49438620950872 -0.383409283033484 -0.0309021459333578 -0.517533727086405 0.578577456532813 0.123480943293102 1.28235923764757 0.443567188036232 -0.812132705669072 0.381158010778059 -1.36800191931175 -0.0326032206419685 0.737585964813648 0.0441304953197405 -0.0654184085374901 -0.0156247063669792 1.23601858289255 -1.91776057865065 0.239834635486128 -1.71728404311063 -1.02893474557611 0.563875228911772 0.858361797393027 -1.02322032049525 -0.73398982468841 -0.771034729117318 0.0423415130058404 1.49060953791028 0.417267494715022 -1.41309234648471 -0.940955683846885 -1.08070800349471 0.566055403548737 -0.350116395230149 -0.167916820724795 0.195547719469267 1.30532938911243 -1.83126779101603 0.586751691768974 0.263720646024998 -0.327096086999817 -0.880247971899773 -0.236426376793519 -1.80008644764038 1.03832697699977 0.165300353837405 2.83374625634423 -1.00489529426847 -2.23443492305495 0.42564260464691 -0.781329458547474 0.109872914563844 -0.465957271754763 -1.06600746862589 0.79877650996243 -0.00590484514981881 -1.02270808989335 0.0777656169691661 -1.80536567990662 -0.0939932240781655 0.602706035080329 0.482741424442534 0.92733596084424 1.30858472571284 1.84172786436566 -0.726261882802078 2.87651118307476 -0.554035248045014 -0.701110555634601 1.58828590375430 0.765812752489184 0.62715760014381 | |
Tables (Output of Computation) | |
> first_number = 5
> second_number = 7
> strpar = 'hello'
> {
+ myfun <- function(x, y) {
+ x + y
+ }
+
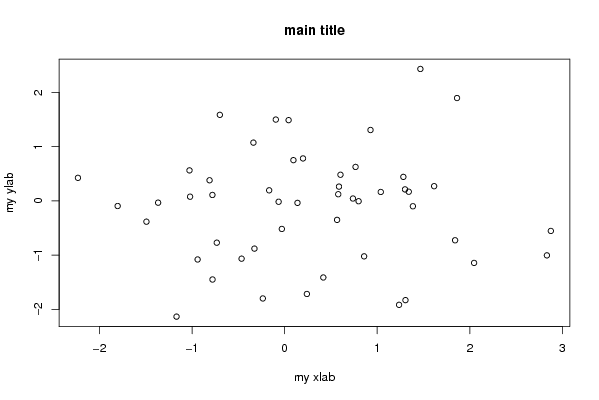
+ plot(RCx, main = 'main title', xlab = 'my xlab', ylab = 'my ylab')
+ .... [TRUNCATED]
[1] 12
| |
Figures (Output of Computation) | |
Input Parameters & R Code | |
| Parameters (Session): | |
| par1 = 5 ; par2 = 7 ; par3 = hello ; | |
| Parameters (R input): | |
| R code (body of R function): | |
{ | |