Free Statistics
of Irreproducible Research!
Description of Statistical Computation | |
|---|---|
| Author's title | |
| Author | *Unverified author* |
| R Software Module | Rscript (source code is shown below) |
| Title produced by software | R console |
| Date of computation | Tue, 26 May 2009 11:21:51 -0600 |
| Cite this page as follows | Statistical Computations at FreeStatistics.org, Office for Research Development and Education, URL https://freestatistics.org/blog/index.php?v=date/2009/May/26/t12433585136t2h5jsknnlh5k3.htm/, Retrieved Sat, 04 May 2024 06:40:49 +0000 |
| Statistical Computations at FreeStatistics.org, Office for Research Development and Education, URL https://freestatistics.org/blog/index.php?pk=40388, Retrieved Sat, 04 May 2024 06:40:49 +0000 | |
| QR Codes: | |
|
| |
| Original text written by user: | |
| IsPrivate? | No (this computation is public) |
| User-defined keywords | |
| Estimated Impact | 103 |
Tree of Dependent Computations | |
| Family? (F = Feedback message, R = changed R code, M = changed R Module, P = changed Parameters, D = changed Data) | |
| - [R console] [test] [2009-05-26 17:21:51] [b768c7adc2675864c15627b87ad9ef22] [Current] | |
| Feedback Forum | |
Post a new message | |
Dataset | |
| Dataseries X: | |
1.60268677251076 -0.72704545863379 -0.398760994705664 -1.84044997117756 -0.520718733415379 -0.454084099474306 -1.14734093795366 -1.2223855630778 0.720364516092828 -1.56209499025438 0.89776205693605 -1.00056200248604 1.94275617971439 1.09417211719816 -0.988252957774802 -1.06525610347759 0.443159018559008 -1.07934696262386 -0.300838619417483 0.347546690134059 0.0557873664864579 -0.874259418166189 -0.951677250203393 -1.22531175032575 -0.259539881979148 1.91859629897014 -1.49747982301546 0.661701670534958 -0.0920277430092727 -0.495781638090520 -0.0610938223712004 0.322759361054833 0.597704347611818 1.25932038149721 -1.60134147164640 -0.531831518614577 -0.577859983244823 0.201394759295428 1.26129297471964 -0.486770312480207 0.035086988266972 0.476984947693785 0.117309107939755 -0.105211670530800 1.91559665199787 0.310964029588765 -0.438787178619635 1.49257370494630 -1.52933941181804 -0.827777158178477 -0.808567738467449 -0.796509403594217 -0.249886237821232 0.612599799052933 -1.91589480372752 0.948767668341468 -1.98690535866424 1.4592992140905 -0.331769503630082 -4.32806701751097 0.599933229372578 -1.05248257210172 -0.492397102906119 0.0304809213770457 -2.23215970231781 0.806652555467097 -0.969806919146049 1.50073605551804 -0.691663044270109 0.363549273752919 1.22525216295556 -0.418609599289129 0.939531746998762 0.68474603538394 0.160685442038680 1.87919371613215 0.249608016931458 0.0323276786010892 -0.347316568213601 -1.69952901498531 0.525432578430667 -0.34586940628456 -0.912906132485805 1.02226392673946 -1.14577895719514 0.894387907061798 -0.873140835409553 0.230078006255352 -1.63242897256885 1.45072079766635 1.20941150964002 0.372900523120252 -0.599032372691586 -0.547819289074332 0.187074993941043 -0.510115232426194 2.01624785371682 1.44269466667620 -1.05831578277864 0.998455432512351 | |
Tables (Output of Computation) | |
> first_number = 5
> second_number = 7
> strpar = 'hello'
> {
+ myfun <- function(x, y) {
+ x + y
+ }
+
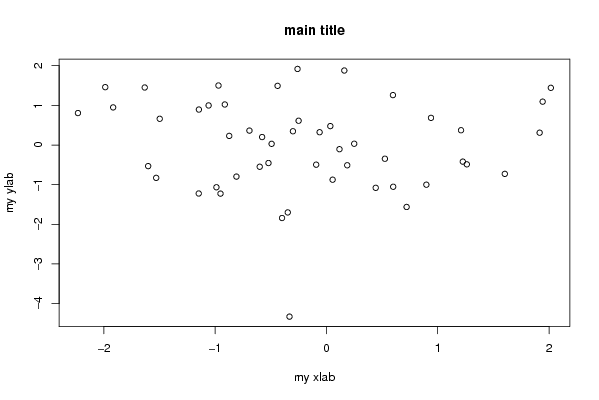
+ plot(RCx, main = 'main title', xlab = 'my xlab', ylab = 'my ylab')
+ .... [TRUNCATED]
[1] 12
| |
Figures (Output of Computation) | |
Input Parameters & R Code | |
| Parameters (Session): | |
| par1 = 5 ; par2 = 7 ; par3 = hello ; | |
| Parameters (R input): | |
| R code (body of R function): | |
{ | |