Free Statistics

of Irreproducible Research!

Author's title

autocorrelation zonder trend-aantal geboortes per maand(2000-2006)-Olivier ...

Author*Unverified author*
R Software Modulerwasp_autocorrelation.wasp
Title produced by software(Partial) Autocorrelation Function
Date of computationTue, 26 May 2009 07:28:26 -0600
Cite this page as followsStatistical Computations at FreeStatistics.org, Office for Research Development and Education, URL https://freestatistics.org/blog/index.php?v=date/2009/May/26/t12433445820wrlyp3njbhki9a.htm/, Retrieved Sat, 04 May 2024 18:29:52 +0000
Statistical Computations at FreeStatistics.org, Office for Research Development and Education, URL https://freestatistics.org/blog/index.php?pk=40369, Retrieved Sat, 04 May 2024 18:29:52 +0000
QR Codes:

Original text written by user:
IsPrivate?No (this computation is public)
User-defined keywords
Estimated Impact135
Family? (F = Feedback message, R = changed R code, M = changed R Module, P = changed Parameters, D = changed Data)
-       [(Partial) Autocorrelation Function] [autocorrelation z...] [2009-05-26 13:28:26] [0a468acfbffe35a0b1f3f2151d8ad87e] [Current]
Feedback Forum

Post a new message
Dataseries X:
9.733
9.259
9.864
9.215
10.103
9.380
9.896
10.117
9.451
9.700
9.081
9.084
9.743
8.587
9.731
9.563
9.998
9.437
10.038
9.918
9.252
9.737
9.035
9.133
9.487
8.700
9.627
8.947
9.283
8.829
9.947
9.628
9.318
9.605
8.640
9.214
9.567
8.547
9.185
9.470
9.123
9.278
10.170
9.434
9.655
9.429
8.739
9.552
9.687
9.019
9.672
9.206
9.069
9.788
10.312
10.105
9.863
9.656
9.295
9.946
9.701
9.049
10.190
9.706
9.765
9.893
9.994
10.433
10.073
10.112
9.266
9.820
10.097
9.115
10.411
9.678
10.408
10.153
10.368
10.581
10.597
10.680
9.738
9.556


Summary of computational transaction
Raw Inputview raw input (R code)
Raw Outputview raw output of R engine
Computing time2 seconds
R Server'Sir Ronald Aylmer Fisher' @ 193.190.124.24

\begin{tabular}{lllllllll}
\hline
Summary of computational transaction \tabularnewline
Raw Input & view raw input (R code)  \tabularnewline
Raw Output & view raw output of R engine  \tabularnewline
Computing time & 2 seconds \tabularnewline
R Server & 'Sir Ronald Aylmer Fisher' @ 193.190.124.24 \tabularnewline
\hline
\end{tabular}
%Source: https://freestatistics.org/blog/index.php?pk=40369&T=0

[TABLE]
[ROW][C]Summary of computational transaction[/C][/ROW]
[ROW][C]Raw Input[/C][C]view raw input (R code) [/C][/ROW]
[ROW][C]Raw Output[/C][C]view raw output of R engine [/C][/ROW]
[ROW][C]Computing time[/C][C]2 seconds[/C][/ROW]
[ROW][C]R Server[/C][C]'Sir Ronald Aylmer Fisher' @ 193.190.124.24[/C][/ROW]
[/TABLE]
Source: https://freestatistics.org/blog/index.php?pk=40369&T=0

Globally Unique Identifier (entire table): ba.freestatistics.org/blog/index.php?pk=40369&T=0

As an alternative you can also use a QR Code:  

The GUIDs for individual cells are displayed in the table below:

Summary of computational transaction
Raw Inputview raw input (R code)
Raw Outputview raw output of R engine
Computing time2 seconds
R Server'Sir Ronald Aylmer Fisher' @ 193.190.124.24


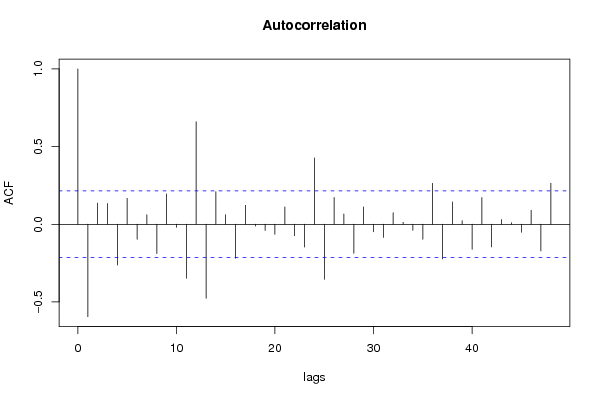
Autocorrelation Function
Time lag kACF(k)T-STATP-value
1-0.594422-5.41540
20.1366041.24450.108405
30.1338221.21920.113116
4-0.261539-2.38270.009735
50.1671951.52320.065753
6-0.095917-0.87380.192363
70.0618330.56330.287365
8-0.188648-1.71870.044702
90.1956221.78220.039187
10-0.018554-0.1690.43309
11-0.347809-3.16870.001072
120.6609066.02110
13-0.476404-4.34022e-05
140.2092291.90620.030045
150.0620150.5650.286805
16-0.219093-1.9960.024605
170.1221761.11310.134444
18-0.010597-0.09650.461661
19-0.039377-0.35870.360348
20-0.064179-0.58470.280168
210.111231.01340.156919
22-0.073693-0.67140.251924
23-0.146871-1.33810.092266
240.4268033.88840.000101
25-0.353859-3.22380.000905
260.172821.57450.059592
270.0670560.61090.271466
28-0.186434-1.69850.046581
290.112141.02160.15496
30-0.048551-0.44230.329704
31-0.084209-0.76720.222574
320.0739910.67410.251065
330.0127590.11620.453871
34-0.038379-0.34960.363744
35-0.096752-0.88150.19031
360.2636342.40180.009273
37-0.222548-2.02750.02291
380.1443011.31460.096126
390.0233110.21240.416169
40-0.160489-1.46210.073741
410.1721071.5680.060347
42-0.145613-1.32660.09414
430.0310370.28280.389032
440.009780.08910.464609
45-0.05178-0.47170.319176
460.0908390.82760.205141
47-0.171222-1.55990.061294
480.2645232.40990.009083

\begin{tabular}{lllllllll}
\hline
Autocorrelation Function \tabularnewline
Time lag k & ACF(k) & T-STAT & P-value \tabularnewline
1 & -0.594422 & -5.4154 & 0 \tabularnewline
2 & 0.136604 & 1.2445 & 0.108405 \tabularnewline
3 & 0.133822 & 1.2192 & 0.113116 \tabularnewline
4 & -0.261539 & -2.3827 & 0.009735 \tabularnewline
5 & 0.167195 & 1.5232 & 0.065753 \tabularnewline
6 & -0.095917 & -0.8738 & 0.192363 \tabularnewline
7 & 0.061833 & 0.5633 & 0.287365 \tabularnewline
8 & -0.188648 & -1.7187 & 0.044702 \tabularnewline
9 & 0.195622 & 1.7822 & 0.039187 \tabularnewline
10 & -0.018554 & -0.169 & 0.43309 \tabularnewline
11 & -0.347809 & -3.1687 & 0.001072 \tabularnewline
12 & 0.660906 & 6.0211 & 0 \tabularnewline
13 & -0.476404 & -4.3402 & 2e-05 \tabularnewline
14 & 0.209229 & 1.9062 & 0.030045 \tabularnewline
15 & 0.062015 & 0.565 & 0.286805 \tabularnewline
16 & -0.219093 & -1.996 & 0.024605 \tabularnewline
17 & 0.122176 & 1.1131 & 0.134444 \tabularnewline
18 & -0.010597 & -0.0965 & 0.461661 \tabularnewline
19 & -0.039377 & -0.3587 & 0.360348 \tabularnewline
20 & -0.064179 & -0.5847 & 0.280168 \tabularnewline
21 & 0.11123 & 1.0134 & 0.156919 \tabularnewline
22 & -0.073693 & -0.6714 & 0.251924 \tabularnewline
23 & -0.146871 & -1.3381 & 0.092266 \tabularnewline
24 & 0.426803 & 3.8884 & 0.000101 \tabularnewline
25 & -0.353859 & -3.2238 & 0.000905 \tabularnewline
26 & 0.17282 & 1.5745 & 0.059592 \tabularnewline
27 & 0.067056 & 0.6109 & 0.271466 \tabularnewline
28 & -0.186434 & -1.6985 & 0.046581 \tabularnewline
29 & 0.11214 & 1.0216 & 0.15496 \tabularnewline
30 & -0.048551 & -0.4423 & 0.329704 \tabularnewline
31 & -0.084209 & -0.7672 & 0.222574 \tabularnewline
32 & 0.073991 & 0.6741 & 0.251065 \tabularnewline
33 & 0.012759 & 0.1162 & 0.453871 \tabularnewline
34 & -0.038379 & -0.3496 & 0.363744 \tabularnewline
35 & -0.096752 & -0.8815 & 0.19031 \tabularnewline
36 & 0.263634 & 2.4018 & 0.009273 \tabularnewline
37 & -0.222548 & -2.0275 & 0.02291 \tabularnewline
38 & 0.144301 & 1.3146 & 0.096126 \tabularnewline
39 & 0.023311 & 0.2124 & 0.416169 \tabularnewline
40 & -0.160489 & -1.4621 & 0.073741 \tabularnewline
41 & 0.172107 & 1.568 & 0.060347 \tabularnewline
42 & -0.145613 & -1.3266 & 0.09414 \tabularnewline
43 & 0.031037 & 0.2828 & 0.389032 \tabularnewline
44 & 0.00978 & 0.0891 & 0.464609 \tabularnewline
45 & -0.05178 & -0.4717 & 0.319176 \tabularnewline
46 & 0.090839 & 0.8276 & 0.205141 \tabularnewline
47 & -0.171222 & -1.5599 & 0.061294 \tabularnewline
48 & 0.264523 & 2.4099 & 0.009083 \tabularnewline
\hline
\end{tabular}
%Source: https://freestatistics.org/blog/index.php?pk=40369&T=1

[TABLE]
[ROW][C]Autocorrelation Function[/C][/ROW]
[ROW][C]Time lag k[/C][C]ACF(k)[/C][C]T-STAT[/C][C]P-value[/C][/ROW]
[ROW][C]1[/C][C]-0.594422[/C][C]-5.4154[/C][C]0[/C][/ROW]
[ROW][C]2[/C][C]0.136604[/C][C]1.2445[/C][C]0.108405[/C][/ROW]
[ROW][C]3[/C][C]0.133822[/C][C]1.2192[/C][C]0.113116[/C][/ROW]
[ROW][C]4[/C][C]-0.261539[/C][C]-2.3827[/C][C]0.009735[/C][/ROW]
[ROW][C]5[/C][C]0.167195[/C][C]1.5232[/C][C]0.065753[/C][/ROW]
[ROW][C]6[/C][C]-0.095917[/C][C]-0.8738[/C][C]0.192363[/C][/ROW]
[ROW][C]7[/C][C]0.061833[/C][C]0.5633[/C][C]0.287365[/C][/ROW]
[ROW][C]8[/C][C]-0.188648[/C][C]-1.7187[/C][C]0.044702[/C][/ROW]
[ROW][C]9[/C][C]0.195622[/C][C]1.7822[/C][C]0.039187[/C][/ROW]
[ROW][C]10[/C][C]-0.018554[/C][C]-0.169[/C][C]0.43309[/C][/ROW]
[ROW][C]11[/C][C]-0.347809[/C][C]-3.1687[/C][C]0.001072[/C][/ROW]
[ROW][C]12[/C][C]0.660906[/C][C]6.0211[/C][C]0[/C][/ROW]
[ROW][C]13[/C][C]-0.476404[/C][C]-4.3402[/C][C]2e-05[/C][/ROW]
[ROW][C]14[/C][C]0.209229[/C][C]1.9062[/C][C]0.030045[/C][/ROW]
[ROW][C]15[/C][C]0.062015[/C][C]0.565[/C][C]0.286805[/C][/ROW]
[ROW][C]16[/C][C]-0.219093[/C][C]-1.996[/C][C]0.024605[/C][/ROW]
[ROW][C]17[/C][C]0.122176[/C][C]1.1131[/C][C]0.134444[/C][/ROW]
[ROW][C]18[/C][C]-0.010597[/C][C]-0.0965[/C][C]0.461661[/C][/ROW]
[ROW][C]19[/C][C]-0.039377[/C][C]-0.3587[/C][C]0.360348[/C][/ROW]
[ROW][C]20[/C][C]-0.064179[/C][C]-0.5847[/C][C]0.280168[/C][/ROW]
[ROW][C]21[/C][C]0.11123[/C][C]1.0134[/C][C]0.156919[/C][/ROW]
[ROW][C]22[/C][C]-0.073693[/C][C]-0.6714[/C][C]0.251924[/C][/ROW]
[ROW][C]23[/C][C]-0.146871[/C][C]-1.3381[/C][C]0.092266[/C][/ROW]
[ROW][C]24[/C][C]0.426803[/C][C]3.8884[/C][C]0.000101[/C][/ROW]
[ROW][C]25[/C][C]-0.353859[/C][C]-3.2238[/C][C]0.000905[/C][/ROW]
[ROW][C]26[/C][C]0.17282[/C][C]1.5745[/C][C]0.059592[/C][/ROW]
[ROW][C]27[/C][C]0.067056[/C][C]0.6109[/C][C]0.271466[/C][/ROW]
[ROW][C]28[/C][C]-0.186434[/C][C]-1.6985[/C][C]0.046581[/C][/ROW]
[ROW][C]29[/C][C]0.11214[/C][C]1.0216[/C][C]0.15496[/C][/ROW]
[ROW][C]30[/C][C]-0.048551[/C][C]-0.4423[/C][C]0.329704[/C][/ROW]
[ROW][C]31[/C][C]-0.084209[/C][C]-0.7672[/C][C]0.222574[/C][/ROW]
[ROW][C]32[/C][C]0.073991[/C][C]0.6741[/C][C]0.251065[/C][/ROW]
[ROW][C]33[/C][C]0.012759[/C][C]0.1162[/C][C]0.453871[/C][/ROW]
[ROW][C]34[/C][C]-0.038379[/C][C]-0.3496[/C][C]0.363744[/C][/ROW]
[ROW][C]35[/C][C]-0.096752[/C][C]-0.8815[/C][C]0.19031[/C][/ROW]
[ROW][C]36[/C][C]0.263634[/C][C]2.4018[/C][C]0.009273[/C][/ROW]
[ROW][C]37[/C][C]-0.222548[/C][C]-2.0275[/C][C]0.02291[/C][/ROW]
[ROW][C]38[/C][C]0.144301[/C][C]1.3146[/C][C]0.096126[/C][/ROW]
[ROW][C]39[/C][C]0.023311[/C][C]0.2124[/C][C]0.416169[/C][/ROW]
[ROW][C]40[/C][C]-0.160489[/C][C]-1.4621[/C][C]0.073741[/C][/ROW]
[ROW][C]41[/C][C]0.172107[/C][C]1.568[/C][C]0.060347[/C][/ROW]
[ROW][C]42[/C][C]-0.145613[/C][C]-1.3266[/C][C]0.09414[/C][/ROW]
[ROW][C]43[/C][C]0.031037[/C][C]0.2828[/C][C]0.389032[/C][/ROW]
[ROW][C]44[/C][C]0.00978[/C][C]0.0891[/C][C]0.464609[/C][/ROW]
[ROW][C]45[/C][C]-0.05178[/C][C]-0.4717[/C][C]0.319176[/C][/ROW]
[ROW][C]46[/C][C]0.090839[/C][C]0.8276[/C][C]0.205141[/C][/ROW]
[ROW][C]47[/C][C]-0.171222[/C][C]-1.5599[/C][C]0.061294[/C][/ROW]
[ROW][C]48[/C][C]0.264523[/C][C]2.4099[/C][C]0.009083[/C][/ROW]
[/TABLE]
Source: https://freestatistics.org/blog/index.php?pk=40369&T=1

Globally Unique Identifier (entire table): ba.freestatistics.org/blog/index.php?pk=40369&T=1

As an alternative you can also use a QR Code:  

The GUIDs for individual cells are displayed in the table below:

Autocorrelation Function
Time lag kACF(k)T-STATP-value
1-0.594422-5.41540
20.1366041.24450.108405
30.1338221.21920.113116
4-0.261539-2.38270.009735
50.1671951.52320.065753
6-0.095917-0.87380.192363
70.0618330.56330.287365
8-0.188648-1.71870.044702
90.1956221.78220.039187
10-0.018554-0.1690.43309
11-0.347809-3.16870.001072
120.6609066.02110
13-0.476404-4.34022e-05
140.2092291.90620.030045
150.0620150.5650.286805
16-0.219093-1.9960.024605
170.1221761.11310.134444
18-0.010597-0.09650.461661
19-0.039377-0.35870.360348
20-0.064179-0.58470.280168
210.111231.01340.156919
22-0.073693-0.67140.251924
23-0.146871-1.33810.092266
240.4268033.88840.000101
25-0.353859-3.22380.000905
260.172821.57450.059592
270.0670560.61090.271466
28-0.186434-1.69850.046581
290.112141.02160.15496
30-0.048551-0.44230.329704
31-0.084209-0.76720.222574
320.0739910.67410.251065
330.0127590.11620.453871
34-0.038379-0.34960.363744
35-0.096752-0.88150.19031
360.2636342.40180.009273
37-0.222548-2.02750.02291
380.1443011.31460.096126
390.0233110.21240.416169
40-0.160489-1.46210.073741
410.1721071.5680.060347
42-0.145613-1.32660.09414
430.0310370.28280.389032
440.009780.08910.464609
45-0.05178-0.47170.319176
460.0908390.82760.205141
47-0.171222-1.55990.061294
480.2645232.40990.009083


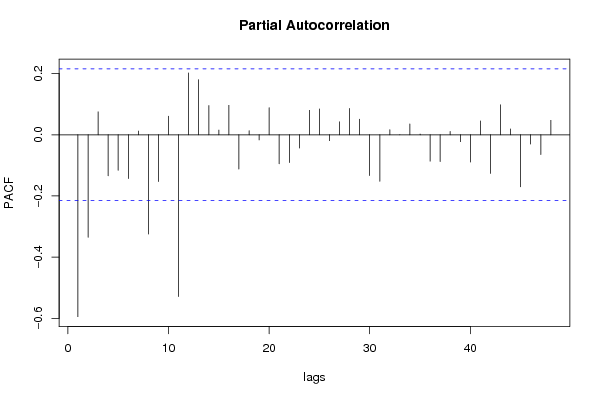
Partial Autocorrelation Function
Time lag kPACF(k)T-STATP-value
1-0.594422-5.41540
2-0.335157-3.05340.00152
30.0749320.68270.248362
4-0.134008-1.22090.112796
5-0.116257-1.05920.146302
6-0.143316-1.30570.097636
70.0120170.10950.456545
8-0.324321-2.95470.002036
9-0.152766-1.39180.083856
100.0606860.55290.290918
11-0.528474-4.81463e-06
120.2019361.83970.034692
130.1799281.63920.052476
140.0953790.86890.193691
150.0151960.13840.445113
160.0961420.87590.191807
17-0.111744-1.0180.15581
180.0133260.12140.45183
19-0.01673-0.15240.439612
200.088320.80460.211665
21-0.094508-0.8610.195856
22-0.090592-0.82530.205775
23-0.043549-0.39670.346286
240.0799070.7280.234334
250.0845160.770.221751
26-0.019233-0.17520.430668
270.0422760.38520.350555
280.0857410.78110.218473
290.0510910.46550.32141
30-0.133038-1.2120.114468
31-0.152191-1.38650.08465
320.0166850.1520.439774
333.1e-053e-040.499887
340.0352760.32140.374364
350.0022530.02050.491838
36-0.086274-0.7860.217056
37-0.087311-0.79540.214312
380.0108590.09890.460716
39-0.022557-0.20550.418839
40-0.08929-0.81350.209139
410.0449680.40970.34155
42-0.126351-1.15110.126495
430.0977180.89020.187953
440.01890.17220.431856
45-0.169795-1.54690.062845
46-0.030439-0.27730.391114
47-0.064522-0.58780.279123
480.0471850.42990.334199

\begin{tabular}{lllllllll}
\hline
Partial Autocorrelation Function \tabularnewline
Time lag k & PACF(k) & T-STAT & P-value \tabularnewline
1 & -0.594422 & -5.4154 & 0 \tabularnewline
2 & -0.335157 & -3.0534 & 0.00152 \tabularnewline
3 & 0.074932 & 0.6827 & 0.248362 \tabularnewline
4 & -0.134008 & -1.2209 & 0.112796 \tabularnewline
5 & -0.116257 & -1.0592 & 0.146302 \tabularnewline
6 & -0.143316 & -1.3057 & 0.097636 \tabularnewline
7 & 0.012017 & 0.1095 & 0.456545 \tabularnewline
8 & -0.324321 & -2.9547 & 0.002036 \tabularnewline
9 & -0.152766 & -1.3918 & 0.083856 \tabularnewline
10 & 0.060686 & 0.5529 & 0.290918 \tabularnewline
11 & -0.528474 & -4.8146 & 3e-06 \tabularnewline
12 & 0.201936 & 1.8397 & 0.034692 \tabularnewline
13 & 0.179928 & 1.6392 & 0.052476 \tabularnewline
14 & 0.095379 & 0.8689 & 0.193691 \tabularnewline
15 & 0.015196 & 0.1384 & 0.445113 \tabularnewline
16 & 0.096142 & 0.8759 & 0.191807 \tabularnewline
17 & -0.111744 & -1.018 & 0.15581 \tabularnewline
18 & 0.013326 & 0.1214 & 0.45183 \tabularnewline
19 & -0.01673 & -0.1524 & 0.439612 \tabularnewline
20 & 0.08832 & 0.8046 & 0.211665 \tabularnewline
21 & -0.094508 & -0.861 & 0.195856 \tabularnewline
22 & -0.090592 & -0.8253 & 0.205775 \tabularnewline
23 & -0.043549 & -0.3967 & 0.346286 \tabularnewline
24 & 0.079907 & 0.728 & 0.234334 \tabularnewline
25 & 0.084516 & 0.77 & 0.221751 \tabularnewline
26 & -0.019233 & -0.1752 & 0.430668 \tabularnewline
27 & 0.042276 & 0.3852 & 0.350555 \tabularnewline
28 & 0.085741 & 0.7811 & 0.218473 \tabularnewline
29 & 0.051091 & 0.4655 & 0.32141 \tabularnewline
30 & -0.133038 & -1.212 & 0.114468 \tabularnewline
31 & -0.152191 & -1.3865 & 0.08465 \tabularnewline
32 & 0.016685 & 0.152 & 0.439774 \tabularnewline
33 & 3.1e-05 & 3e-04 & 0.499887 \tabularnewline
34 & 0.035276 & 0.3214 & 0.374364 \tabularnewline
35 & 0.002253 & 0.0205 & 0.491838 \tabularnewline
36 & -0.086274 & -0.786 & 0.217056 \tabularnewline
37 & -0.087311 & -0.7954 & 0.214312 \tabularnewline
38 & 0.010859 & 0.0989 & 0.460716 \tabularnewline
39 & -0.022557 & -0.2055 & 0.418839 \tabularnewline
40 & -0.08929 & -0.8135 & 0.209139 \tabularnewline
41 & 0.044968 & 0.4097 & 0.34155 \tabularnewline
42 & -0.126351 & -1.1511 & 0.126495 \tabularnewline
43 & 0.097718 & 0.8902 & 0.187953 \tabularnewline
44 & 0.0189 & 0.1722 & 0.431856 \tabularnewline
45 & -0.169795 & -1.5469 & 0.062845 \tabularnewline
46 & -0.030439 & -0.2773 & 0.391114 \tabularnewline
47 & -0.064522 & -0.5878 & 0.279123 \tabularnewline
48 & 0.047185 & 0.4299 & 0.334199 \tabularnewline
\hline
\end{tabular}
%Source: https://freestatistics.org/blog/index.php?pk=40369&T=2

[TABLE]
[ROW][C]Partial Autocorrelation Function[/C][/ROW]
[ROW][C]Time lag k[/C][C]PACF(k)[/C][C]T-STAT[/C][C]P-value[/C][/ROW]
[ROW][C]1[/C][C]-0.594422[/C][C]-5.4154[/C][C]0[/C][/ROW]
[ROW][C]2[/C][C]-0.335157[/C][C]-3.0534[/C][C]0.00152[/C][/ROW]
[ROW][C]3[/C][C]0.074932[/C][C]0.6827[/C][C]0.248362[/C][/ROW]
[ROW][C]4[/C][C]-0.134008[/C][C]-1.2209[/C][C]0.112796[/C][/ROW]
[ROW][C]5[/C][C]-0.116257[/C][C]-1.0592[/C][C]0.146302[/C][/ROW]
[ROW][C]6[/C][C]-0.143316[/C][C]-1.3057[/C][C]0.097636[/C][/ROW]
[ROW][C]7[/C][C]0.012017[/C][C]0.1095[/C][C]0.456545[/C][/ROW]
[ROW][C]8[/C][C]-0.324321[/C][C]-2.9547[/C][C]0.002036[/C][/ROW]
[ROW][C]9[/C][C]-0.152766[/C][C]-1.3918[/C][C]0.083856[/C][/ROW]
[ROW][C]10[/C][C]0.060686[/C][C]0.5529[/C][C]0.290918[/C][/ROW]
[ROW][C]11[/C][C]-0.528474[/C][C]-4.8146[/C][C]3e-06[/C][/ROW]
[ROW][C]12[/C][C]0.201936[/C][C]1.8397[/C][C]0.034692[/C][/ROW]
[ROW][C]13[/C][C]0.179928[/C][C]1.6392[/C][C]0.052476[/C][/ROW]
[ROW][C]14[/C][C]0.095379[/C][C]0.8689[/C][C]0.193691[/C][/ROW]
[ROW][C]15[/C][C]0.015196[/C][C]0.1384[/C][C]0.445113[/C][/ROW]
[ROW][C]16[/C][C]0.096142[/C][C]0.8759[/C][C]0.191807[/C][/ROW]
[ROW][C]17[/C][C]-0.111744[/C][C]-1.018[/C][C]0.15581[/C][/ROW]
[ROW][C]18[/C][C]0.013326[/C][C]0.1214[/C][C]0.45183[/C][/ROW]
[ROW][C]19[/C][C]-0.01673[/C][C]-0.1524[/C][C]0.439612[/C][/ROW]
[ROW][C]20[/C][C]0.08832[/C][C]0.8046[/C][C]0.211665[/C][/ROW]
[ROW][C]21[/C][C]-0.094508[/C][C]-0.861[/C][C]0.195856[/C][/ROW]
[ROW][C]22[/C][C]-0.090592[/C][C]-0.8253[/C][C]0.205775[/C][/ROW]
[ROW][C]23[/C][C]-0.043549[/C][C]-0.3967[/C][C]0.346286[/C][/ROW]
[ROW][C]24[/C][C]0.079907[/C][C]0.728[/C][C]0.234334[/C][/ROW]
[ROW][C]25[/C][C]0.084516[/C][C]0.77[/C][C]0.221751[/C][/ROW]
[ROW][C]26[/C][C]-0.019233[/C][C]-0.1752[/C][C]0.430668[/C][/ROW]
[ROW][C]27[/C][C]0.042276[/C][C]0.3852[/C][C]0.350555[/C][/ROW]
[ROW][C]28[/C][C]0.085741[/C][C]0.7811[/C][C]0.218473[/C][/ROW]
[ROW][C]29[/C][C]0.051091[/C][C]0.4655[/C][C]0.32141[/C][/ROW]
[ROW][C]30[/C][C]-0.133038[/C][C]-1.212[/C][C]0.114468[/C][/ROW]
[ROW][C]31[/C][C]-0.152191[/C][C]-1.3865[/C][C]0.08465[/C][/ROW]
[ROW][C]32[/C][C]0.016685[/C][C]0.152[/C][C]0.439774[/C][/ROW]
[ROW][C]33[/C][C]3.1e-05[/C][C]3e-04[/C][C]0.499887[/C][/ROW]
[ROW][C]34[/C][C]0.035276[/C][C]0.3214[/C][C]0.374364[/C][/ROW]
[ROW][C]35[/C][C]0.002253[/C][C]0.0205[/C][C]0.491838[/C][/ROW]
[ROW][C]36[/C][C]-0.086274[/C][C]-0.786[/C][C]0.217056[/C][/ROW]
[ROW][C]37[/C][C]-0.087311[/C][C]-0.7954[/C][C]0.214312[/C][/ROW]
[ROW][C]38[/C][C]0.010859[/C][C]0.0989[/C][C]0.460716[/C][/ROW]
[ROW][C]39[/C][C]-0.022557[/C][C]-0.2055[/C][C]0.418839[/C][/ROW]
[ROW][C]40[/C][C]-0.08929[/C][C]-0.8135[/C][C]0.209139[/C][/ROW]
[ROW][C]41[/C][C]0.044968[/C][C]0.4097[/C][C]0.34155[/C][/ROW]
[ROW][C]42[/C][C]-0.126351[/C][C]-1.1511[/C][C]0.126495[/C][/ROW]
[ROW][C]43[/C][C]0.097718[/C][C]0.8902[/C][C]0.187953[/C][/ROW]
[ROW][C]44[/C][C]0.0189[/C][C]0.1722[/C][C]0.431856[/C][/ROW]
[ROW][C]45[/C][C]-0.169795[/C][C]-1.5469[/C][C]0.062845[/C][/ROW]
[ROW][C]46[/C][C]-0.030439[/C][C]-0.2773[/C][C]0.391114[/C][/ROW]
[ROW][C]47[/C][C]-0.064522[/C][C]-0.5878[/C][C]0.279123[/C][/ROW]
[ROW][C]48[/C][C]0.047185[/C][C]0.4299[/C][C]0.334199[/C][/ROW]
[/TABLE]
Source: https://freestatistics.org/blog/index.php?pk=40369&T=2

Globally Unique Identifier (entire table): ba.freestatistics.org/blog/index.php?pk=40369&T=2

As an alternative you can also use a QR Code:  

The GUIDs for individual cells are displayed in the table below:

Partial Autocorrelation Function
Time lag kPACF(k)T-STATP-value
1-0.594422-5.41540
2-0.335157-3.05340.00152
30.0749320.68270.248362
4-0.134008-1.22090.112796
5-0.116257-1.05920.146302
6-0.143316-1.30570.097636
70.0120170.10950.456545
8-0.324321-2.95470.002036
9-0.152766-1.39180.083856
100.0606860.55290.290918
11-0.528474-4.81463e-06
120.2019361.83970.034692
130.1799281.63920.052476
140.0953790.86890.193691
150.0151960.13840.445113
160.0961420.87590.191807
17-0.111744-1.0180.15581
180.0133260.12140.45183
19-0.01673-0.15240.439612
200.088320.80460.211665
21-0.094508-0.8610.195856
22-0.090592-0.82530.205775
23-0.043549-0.39670.346286
240.0799070.7280.234334
250.0845160.770.221751
26-0.019233-0.17520.430668
270.0422760.38520.350555
280.0857410.78110.218473
290.0510910.46550.32141
30-0.133038-1.2120.114468
31-0.152191-1.38650.08465
320.0166850.1520.439774
333.1e-053e-040.499887
340.0352760.32140.374364
350.0022530.02050.491838
36-0.086274-0.7860.217056
37-0.087311-0.79540.214312
380.0108590.09890.460716
39-0.022557-0.20550.418839
40-0.08929-0.81350.209139
410.0449680.40970.34155
42-0.126351-1.15110.126495
430.0977180.89020.187953
440.01890.17220.431856
45-0.169795-1.54690.062845
46-0.030439-0.27730.391114
47-0.064522-0.58780.279123
480.0471850.42990.334199


Parameters (Session):
par1 = 48 ; par2 = 1 ; par3 = 1 ; par4 = 0 ; par5 = 12 ;
Parameters (R input):
par1 = 48 ; par2 = 1 ; par3 = 1 ; par4 = 0 ; par5 = 12 ;
R code (references can be found in the software module):
if (par1 == 'Default') {
par1 = 10*log10(length(x))
} else {
par1 <- as.numeric(par1)
}
par2 <- as.numeric(par2)
par3 <- as.numeric(par3)
par4 <- as.numeric(par4)
par5 <- as.numeric(par5)
if (par2 == 0) {
x <- log(x)
} else {
x <- (x ^ par2 - 1) / par2
}
if (par3 > 0) x <- diff(x,lag=1,difference=par3)
if (par4 > 0) x <- diff(x,lag=par5,difference=par4)
bitmap(file='pic1.png')
racf <- acf(x,par1,main='Autocorrelation',xlab='lags',ylab='ACF')
dev.off()
bitmap(file='pic2.png')
rpacf <- pacf(x,par1,main='Partial Autocorrelation',xlab='lags',ylab='PACF')
dev.off()
(myacf <- c(racf$acf))
(mypacf <- c(rpacf$acf))
lengthx <- length(x)
sqrtn <- sqrt(lengthx)
load(file='createtable')
a<-table.start()
a<-table.row.start(a)
a<-table.element(a,'Autocorrelation Function',4,TRUE)
a<-table.row.end(a)
a<-table.row.start(a)
a<-table.element(a,'Time lag k',header=TRUE)
a<-table.element(a,hyperlink('basics.htm','ACF(k)','click here for more information about the Autocorrelation Function'),header=TRUE)
a<-table.element(a,'T-STAT',header=TRUE)
a<-table.element(a,'P-value',header=TRUE)
a<-table.row.end(a)
for (i in 2:(par1+1)) {
a<-table.row.start(a)
a<-table.element(a,i-1,header=TRUE)
a<-table.element(a,round(myacf[i],6))
mytstat <- myacf[i]*sqrtn
a<-table.element(a,round(mytstat,4))
a<-table.element(a,round(1-pt(abs(mytstat),lengthx),6))
a<-table.row.end(a)
}
a<-table.end(a)
table.save(a,file='mytable.tab')
a<-table.start()
a<-table.row.start(a)
a<-table.element(a,'Partial Autocorrelation Function',4,TRUE)
a<-table.row.end(a)
a<-table.row.start(a)
a<-table.element(a,'Time lag k',header=TRUE)
a<-table.element(a,hyperlink('basics.htm','PACF(k)','click here for more information about the Partial Autocorrelation Function'),header=TRUE)
a<-table.element(a,'T-STAT',header=TRUE)
a<-table.element(a,'P-value',header=TRUE)
a<-table.row.end(a)
for (i in 1:par1) {
a<-table.row.start(a)
a<-table.element(a,i,header=TRUE)
a<-table.element(a,round(mypacf[i],6))
mytstat <- mypacf[i]*sqrtn
a<-table.element(a,round(mytstat,4))
a<-table.element(a,round(1-pt(abs(mytstat),lengthx),6))
a<-table.row.end(a)
}
a<-table.end(a)
table.save(a,file='mytable1.tab')