Free Statistics

of Irreproducible Research!

Author's title

Author*Unverified author*
R Software Modulerwasp_autocorrelation.wasp
Title produced by software(Partial) Autocorrelation Function
Date of computationTue, 26 May 2009 07:25:03 -0600
Cite this page as followsStatistical Computations at FreeStatistics.org, Office for Research Development and Education, URL https://freestatistics.org/blog/index.php?v=date/2009/May/26/t1243344385t60bspx9e7qaldd.htm/, Retrieved Sat, 04 May 2024 14:09:08 +0000
Statistical Computations at FreeStatistics.org, Office for Research Development and Education, URL https://freestatistics.org/blog/index.php?pk=40368, Retrieved Sat, 04 May 2024 14:09:08 +0000
QR Codes:

Original text written by user:
IsPrivate?No (this computation is public)
User-defined keywords
Estimated Impact140
Family? (F = Feedback message, R = changed R code, M = changed R Module, P = changed Parameters, D = changed Data)
-       [(Partial) Autocorrelation Function] [autocorrelation-a...] [2009-05-26 13:25:03] [0a468acfbffe35a0b1f3f2151d8ad87e] [Current]
Feedback Forum

Post a new message
Dataseries X:
9.733
9.259
9.864
9.215
10.103
9.380
9.896
10.117
9.451
9.700
9.081
9.084
9.743
8.587
9.731
9.563
9.998
9.437
10.038
9.918
9.252
9.737
9.035
9.133
9.487
8.700
9.627
8.947
9.283
8.829
9.947
9.628
9.318
9.605
8.640
9.214
9.567
8.547
9.185
9.470
9.123
9.278
10.170
9.434
9.655
9.429
8.739
9.552
9.687
9.019
9.672
9.206
9.069
9.788
10.312
10.105
9.863
9.656
9.295
9.946
9.701
9.049
10.190
9.706
9.765
9.893
9.994
10.433
10.073
10.112
9.266
9.820
10.097
9.115
10.411
9.678
10.408
10.153
10.368
10.581
10.597
10.680
9.738
9.556


Summary of computational transaction
Raw Inputview raw input (R code)
Raw Outputview raw output of R engine
Computing time2 seconds
R Server'Sir Ronald Aylmer Fisher' @ 193.190.124.24

\begin{tabular}{lllllllll}
\hline
Summary of computational transaction \tabularnewline
Raw Input & view raw input (R code)  \tabularnewline
Raw Output & view raw output of R engine  \tabularnewline
Computing time & 2 seconds \tabularnewline
R Server & 'Sir Ronald Aylmer Fisher' @ 193.190.124.24 \tabularnewline
\hline
\end{tabular}
%Source: https://freestatistics.org/blog/index.php?pk=40368&T=0

[TABLE]
[ROW][C]Summary of computational transaction[/C][/ROW]
[ROW][C]Raw Input[/C][C]view raw input (R code) [/C][/ROW]
[ROW][C]Raw Output[/C][C]view raw output of R engine [/C][/ROW]
[ROW][C]Computing time[/C][C]2 seconds[/C][/ROW]
[ROW][C]R Server[/C][C]'Sir Ronald Aylmer Fisher' @ 193.190.124.24[/C][/ROW]
[/TABLE]
Source: https://freestatistics.org/blog/index.php?pk=40368&T=0

Globally Unique Identifier (entire table): ba.freestatistics.org/blog/index.php?pk=40368&T=0

As an alternative you can also use a QR Code:  

The GUIDs for individual cells are displayed in the table below:

Summary of computational transaction
Raw Inputview raw input (R code)
Raw Outputview raw output of R engine
Computing time2 seconds
R Server'Sir Ronald Aylmer Fisher' @ 193.190.124.24


Autocorrelation Function
Time lag kACF(k)T-STATP-value
10.2619152.40050.009291
20.404223.70470.000189
30.3440733.15350.001119
40.0903850.82840.204897
50.217111.98980.02493
60.1010990.92660.178399
70.1228471.12590.131704
80.0527820.48380.31491
90.2630342.41070.009051
100.1853351.69860.046546
110.13511.23820.109544
120.6008585.5070
130.08680.79550.214271
140.2811182.57650.005865
150.1622251.48680.070403
16-0.047187-0.43250.333251
170.0650280.5960.276393
18-0.000764-0.0070.497216
19-0.054903-0.50320.308071
20-0.050604-0.46380.321999
210.0523240.47960.316394
22-0.010382-0.09510.462211
230.0366640.3360.368842
240.3016972.76510.003497
25-0.064335-0.58960.278509
260.094680.86780.193999
27-0.005899-0.05410.478508
28-0.200562-1.83820.034785
29-0.121471-1.11330.134378
30-0.204295-1.87240.032316
31-0.223846-2.05160.021663
32-0.119334-1.09370.138604
33-0.12171-1.11550.133911
34-0.143336-1.31370.096263
35-0.104272-0.95570.170992
360.0759630.69620.244108
37-0.135282-1.23990.109236
38-0.014282-0.13090.448085
39-0.108079-0.99060.162374
40-0.237352-2.17540.016206
41-0.128346-1.17630.121396
42-0.272006-2.4930.007315
43-0.208949-1.9150.029445
44-0.187666-1.720.044559
45-0.181203-1.66080.050246
46-0.097818-0.89650.186269
47-0.146075-1.33880.092124
480.0561910.5150.303953

\begin{tabular}{lllllllll}
\hline
Autocorrelation Function \tabularnewline
Time lag k & ACF(k) & T-STAT & P-value \tabularnewline
1 & 0.261915 & 2.4005 & 0.009291 \tabularnewline
2 & 0.40422 & 3.7047 & 0.000189 \tabularnewline
3 & 0.344073 & 3.1535 & 0.001119 \tabularnewline
4 & 0.090385 & 0.8284 & 0.204897 \tabularnewline
5 & 0.21711 & 1.9898 & 0.02493 \tabularnewline
6 & 0.101099 & 0.9266 & 0.178399 \tabularnewline
7 & 0.122847 & 1.1259 & 0.131704 \tabularnewline
8 & 0.052782 & 0.4838 & 0.31491 \tabularnewline
9 & 0.263034 & 2.4107 & 0.009051 \tabularnewline
10 & 0.185335 & 1.6986 & 0.046546 \tabularnewline
11 & 0.1351 & 1.2382 & 0.109544 \tabularnewline
12 & 0.600858 & 5.507 & 0 \tabularnewline
13 & 0.0868 & 0.7955 & 0.214271 \tabularnewline
14 & 0.281118 & 2.5765 & 0.005865 \tabularnewline
15 & 0.162225 & 1.4868 & 0.070403 \tabularnewline
16 & -0.047187 & -0.4325 & 0.333251 \tabularnewline
17 & 0.065028 & 0.596 & 0.276393 \tabularnewline
18 & -0.000764 & -0.007 & 0.497216 \tabularnewline
19 & -0.054903 & -0.5032 & 0.308071 \tabularnewline
20 & -0.050604 & -0.4638 & 0.321999 \tabularnewline
21 & 0.052324 & 0.4796 & 0.316394 \tabularnewline
22 & -0.010382 & -0.0951 & 0.462211 \tabularnewline
23 & 0.036664 & 0.336 & 0.368842 \tabularnewline
24 & 0.301697 & 2.7651 & 0.003497 \tabularnewline
25 & -0.064335 & -0.5896 & 0.278509 \tabularnewline
26 & 0.09468 & 0.8678 & 0.193999 \tabularnewline
27 & -0.005899 & -0.0541 & 0.478508 \tabularnewline
28 & -0.200562 & -1.8382 & 0.034785 \tabularnewline
29 & -0.121471 & -1.1133 & 0.134378 \tabularnewline
30 & -0.204295 & -1.8724 & 0.032316 \tabularnewline
31 & -0.223846 & -2.0516 & 0.021663 \tabularnewline
32 & -0.119334 & -1.0937 & 0.138604 \tabularnewline
33 & -0.12171 & -1.1155 & 0.133911 \tabularnewline
34 & -0.143336 & -1.3137 & 0.096263 \tabularnewline
35 & -0.104272 & -0.9557 & 0.170992 \tabularnewline
36 & 0.075963 & 0.6962 & 0.244108 \tabularnewline
37 & -0.135282 & -1.2399 & 0.109236 \tabularnewline
38 & -0.014282 & -0.1309 & 0.448085 \tabularnewline
39 & -0.108079 & -0.9906 & 0.162374 \tabularnewline
40 & -0.237352 & -2.1754 & 0.016206 \tabularnewline
41 & -0.128346 & -1.1763 & 0.121396 \tabularnewline
42 & -0.272006 & -2.493 & 0.007315 \tabularnewline
43 & -0.208949 & -1.915 & 0.029445 \tabularnewline
44 & -0.187666 & -1.72 & 0.044559 \tabularnewline
45 & -0.181203 & -1.6608 & 0.050246 \tabularnewline
46 & -0.097818 & -0.8965 & 0.186269 \tabularnewline
47 & -0.146075 & -1.3388 & 0.092124 \tabularnewline
48 & 0.056191 & 0.515 & 0.303953 \tabularnewline
\hline
\end{tabular}
%Source: https://freestatistics.org/blog/index.php?pk=40368&T=1

[TABLE]
[ROW][C]Autocorrelation Function[/C][/ROW]
[ROW][C]Time lag k[/C][C]ACF(k)[/C][C]T-STAT[/C][C]P-value[/C][/ROW]
[ROW][C]1[/C][C]0.261915[/C][C]2.4005[/C][C]0.009291[/C][/ROW]
[ROW][C]2[/C][C]0.40422[/C][C]3.7047[/C][C]0.000189[/C][/ROW]
[ROW][C]3[/C][C]0.344073[/C][C]3.1535[/C][C]0.001119[/C][/ROW]
[ROW][C]4[/C][C]0.090385[/C][C]0.8284[/C][C]0.204897[/C][/ROW]
[ROW][C]5[/C][C]0.21711[/C][C]1.9898[/C][C]0.02493[/C][/ROW]
[ROW][C]6[/C][C]0.101099[/C][C]0.9266[/C][C]0.178399[/C][/ROW]
[ROW][C]7[/C][C]0.122847[/C][C]1.1259[/C][C]0.131704[/C][/ROW]
[ROW][C]8[/C][C]0.052782[/C][C]0.4838[/C][C]0.31491[/C][/ROW]
[ROW][C]9[/C][C]0.263034[/C][C]2.4107[/C][C]0.009051[/C][/ROW]
[ROW][C]10[/C][C]0.185335[/C][C]1.6986[/C][C]0.046546[/C][/ROW]
[ROW][C]11[/C][C]0.1351[/C][C]1.2382[/C][C]0.109544[/C][/ROW]
[ROW][C]12[/C][C]0.600858[/C][C]5.507[/C][C]0[/C][/ROW]
[ROW][C]13[/C][C]0.0868[/C][C]0.7955[/C][C]0.214271[/C][/ROW]
[ROW][C]14[/C][C]0.281118[/C][C]2.5765[/C][C]0.005865[/C][/ROW]
[ROW][C]15[/C][C]0.162225[/C][C]1.4868[/C][C]0.070403[/C][/ROW]
[ROW][C]16[/C][C]-0.047187[/C][C]-0.4325[/C][C]0.333251[/C][/ROW]
[ROW][C]17[/C][C]0.065028[/C][C]0.596[/C][C]0.276393[/C][/ROW]
[ROW][C]18[/C][C]-0.000764[/C][C]-0.007[/C][C]0.497216[/C][/ROW]
[ROW][C]19[/C][C]-0.054903[/C][C]-0.5032[/C][C]0.308071[/C][/ROW]
[ROW][C]20[/C][C]-0.050604[/C][C]-0.4638[/C][C]0.321999[/C][/ROW]
[ROW][C]21[/C][C]0.052324[/C][C]0.4796[/C][C]0.316394[/C][/ROW]
[ROW][C]22[/C][C]-0.010382[/C][C]-0.0951[/C][C]0.462211[/C][/ROW]
[ROW][C]23[/C][C]0.036664[/C][C]0.336[/C][C]0.368842[/C][/ROW]
[ROW][C]24[/C][C]0.301697[/C][C]2.7651[/C][C]0.003497[/C][/ROW]
[ROW][C]25[/C][C]-0.064335[/C][C]-0.5896[/C][C]0.278509[/C][/ROW]
[ROW][C]26[/C][C]0.09468[/C][C]0.8678[/C][C]0.193999[/C][/ROW]
[ROW][C]27[/C][C]-0.005899[/C][C]-0.0541[/C][C]0.478508[/C][/ROW]
[ROW][C]28[/C][C]-0.200562[/C][C]-1.8382[/C][C]0.034785[/C][/ROW]
[ROW][C]29[/C][C]-0.121471[/C][C]-1.1133[/C][C]0.134378[/C][/ROW]
[ROW][C]30[/C][C]-0.204295[/C][C]-1.8724[/C][C]0.032316[/C][/ROW]
[ROW][C]31[/C][C]-0.223846[/C][C]-2.0516[/C][C]0.021663[/C][/ROW]
[ROW][C]32[/C][C]-0.119334[/C][C]-1.0937[/C][C]0.138604[/C][/ROW]
[ROW][C]33[/C][C]-0.12171[/C][C]-1.1155[/C][C]0.133911[/C][/ROW]
[ROW][C]34[/C][C]-0.143336[/C][C]-1.3137[/C][C]0.096263[/C][/ROW]
[ROW][C]35[/C][C]-0.104272[/C][C]-0.9557[/C][C]0.170992[/C][/ROW]
[ROW][C]36[/C][C]0.075963[/C][C]0.6962[/C][C]0.244108[/C][/ROW]
[ROW][C]37[/C][C]-0.135282[/C][C]-1.2399[/C][C]0.109236[/C][/ROW]
[ROW][C]38[/C][C]-0.014282[/C][C]-0.1309[/C][C]0.448085[/C][/ROW]
[ROW][C]39[/C][C]-0.108079[/C][C]-0.9906[/C][C]0.162374[/C][/ROW]
[ROW][C]40[/C][C]-0.237352[/C][C]-2.1754[/C][C]0.016206[/C][/ROW]
[ROW][C]41[/C][C]-0.128346[/C][C]-1.1763[/C][C]0.121396[/C][/ROW]
[ROW][C]42[/C][C]-0.272006[/C][C]-2.493[/C][C]0.007315[/C][/ROW]
[ROW][C]43[/C][C]-0.208949[/C][C]-1.915[/C][C]0.029445[/C][/ROW]
[ROW][C]44[/C][C]-0.187666[/C][C]-1.72[/C][C]0.044559[/C][/ROW]
[ROW][C]45[/C][C]-0.181203[/C][C]-1.6608[/C][C]0.050246[/C][/ROW]
[ROW][C]46[/C][C]-0.097818[/C][C]-0.8965[/C][C]0.186269[/C][/ROW]
[ROW][C]47[/C][C]-0.146075[/C][C]-1.3388[/C][C]0.092124[/C][/ROW]
[ROW][C]48[/C][C]0.056191[/C][C]0.515[/C][C]0.303953[/C][/ROW]
[/TABLE]
Source: https://freestatistics.org/blog/index.php?pk=40368&T=1

Globally Unique Identifier (entire table): ba.freestatistics.org/blog/index.php?pk=40368&T=1

As an alternative you can also use a QR Code:  

The GUIDs for individual cells are displayed in the table below:

Autocorrelation Function
Time lag kACF(k)T-STATP-value
10.2619152.40050.009291
20.404223.70470.000189
30.3440733.15350.001119
40.0903850.82840.204897
50.217111.98980.02493
60.1010990.92660.178399
70.1228471.12590.131704
80.0527820.48380.31491
90.2630342.41070.009051
100.1853351.69860.046546
110.13511.23820.109544
120.6008585.5070
130.08680.79550.214271
140.2811182.57650.005865
150.1622251.48680.070403
16-0.047187-0.43250.333251
170.0650280.5960.276393
18-0.000764-0.0070.497216
19-0.054903-0.50320.308071
20-0.050604-0.46380.321999
210.0523240.47960.316394
22-0.010382-0.09510.462211
230.0366640.3360.368842
240.3016972.76510.003497
25-0.064335-0.58960.278509
260.094680.86780.193999
27-0.005899-0.05410.478508
28-0.200562-1.83820.034785
29-0.121471-1.11330.134378
30-0.204295-1.87240.032316
31-0.223846-2.05160.021663
32-0.119334-1.09370.138604
33-0.12171-1.11550.133911
34-0.143336-1.31370.096263
35-0.104272-0.95570.170992
360.0759630.69620.244108
37-0.135282-1.23990.109236
38-0.014282-0.13090.448085
39-0.108079-0.99060.162374
40-0.237352-2.17540.016206
41-0.128346-1.17630.121396
42-0.272006-2.4930.007315
43-0.208949-1.9150.029445
44-0.187666-1.720.044559
45-0.181203-1.66080.050246
46-0.097818-0.89650.186269
47-0.146075-1.33880.092124
480.0561910.5150.303953


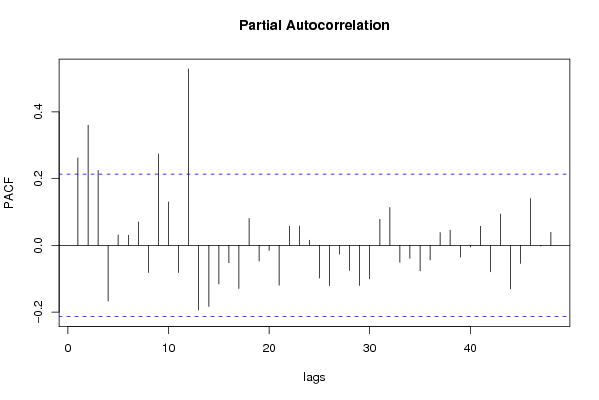
Partial Autocorrelation Function
Time lag kPACF(k)T-STATP-value
10.2619152.40050.009291
20.360343.30260.000704
30.224532.05790.021352
4-0.167203-1.53240.064586
50.0313580.28740.387257
60.029980.27480.392084
70.0701630.64310.260971
8-0.08132-0.74530.229082
90.2740112.51140.006971
100.1300171.19160.118381
11-0.0817-0.74880.228037
120.5290424.84873e-06
13-0.19414-1.77930.039402
14-0.183145-1.67860.048478
15-0.115626-1.05970.146153
16-0.052531-0.48150.315723
17-0.129425-1.18620.119444
180.0808590.74110.230353
19-0.0471-0.43170.333539
20-0.015234-0.13960.444646
21-0.119372-1.09410.138528
220.0570430.52280.301243
230.0577750.52950.298922
240.0156270.14320.44323
25-0.097826-0.89660.186251
26-0.120542-1.10480.136203
27-0.026486-0.24270.404396
28-0.07521-0.68930.246264
29-0.120077-1.10050.137124
30-0.100081-0.91730.180817
310.0780040.71490.238321
320.1137321.04240.150115
33-0.050985-0.46730.320753
34-0.038642-0.35420.362053
35-0.076128-0.69770.243637
36-0.043703-0.40050.344887
370.0382920.3510.36325
380.0455480.41750.338705
39-0.034885-0.31970.374985
40-0.005098-0.04670.481423
410.0572930.52510.300448
42-0.079272-0.72650.234764
430.0937040.85880.196444
44-0.13017-1.1930.118108
45-0.054101-0.49580.31065
460.1401611.28460.101232
47-0.001834-0.01680.493314
480.0390850.35820.360538

\begin{tabular}{lllllllll}
\hline
Partial Autocorrelation Function \tabularnewline
Time lag k & PACF(k) & T-STAT & P-value \tabularnewline
1 & 0.261915 & 2.4005 & 0.009291 \tabularnewline
2 & 0.36034 & 3.3026 & 0.000704 \tabularnewline
3 & 0.22453 & 2.0579 & 0.021352 \tabularnewline
4 & -0.167203 & -1.5324 & 0.064586 \tabularnewline
5 & 0.031358 & 0.2874 & 0.387257 \tabularnewline
6 & 0.02998 & 0.2748 & 0.392084 \tabularnewline
7 & 0.070163 & 0.6431 & 0.260971 \tabularnewline
8 & -0.08132 & -0.7453 & 0.229082 \tabularnewline
9 & 0.274011 & 2.5114 & 0.006971 \tabularnewline
10 & 0.130017 & 1.1916 & 0.118381 \tabularnewline
11 & -0.0817 & -0.7488 & 0.228037 \tabularnewline
12 & 0.529042 & 4.8487 & 3e-06 \tabularnewline
13 & -0.19414 & -1.7793 & 0.039402 \tabularnewline
14 & -0.183145 & -1.6786 & 0.048478 \tabularnewline
15 & -0.115626 & -1.0597 & 0.146153 \tabularnewline
16 & -0.052531 & -0.4815 & 0.315723 \tabularnewline
17 & -0.129425 & -1.1862 & 0.119444 \tabularnewline
18 & 0.080859 & 0.7411 & 0.230353 \tabularnewline
19 & -0.0471 & -0.4317 & 0.333539 \tabularnewline
20 & -0.015234 & -0.1396 & 0.444646 \tabularnewline
21 & -0.119372 & -1.0941 & 0.138528 \tabularnewline
22 & 0.057043 & 0.5228 & 0.301243 \tabularnewline
23 & 0.057775 & 0.5295 & 0.298922 \tabularnewline
24 & 0.015627 & 0.1432 & 0.44323 \tabularnewline
25 & -0.097826 & -0.8966 & 0.186251 \tabularnewline
26 & -0.120542 & -1.1048 & 0.136203 \tabularnewline
27 & -0.026486 & -0.2427 & 0.404396 \tabularnewline
28 & -0.07521 & -0.6893 & 0.246264 \tabularnewline
29 & -0.120077 & -1.1005 & 0.137124 \tabularnewline
30 & -0.100081 & -0.9173 & 0.180817 \tabularnewline
31 & 0.078004 & 0.7149 & 0.238321 \tabularnewline
32 & 0.113732 & 1.0424 & 0.150115 \tabularnewline
33 & -0.050985 & -0.4673 & 0.320753 \tabularnewline
34 & -0.038642 & -0.3542 & 0.362053 \tabularnewline
35 & -0.076128 & -0.6977 & 0.243637 \tabularnewline
36 & -0.043703 & -0.4005 & 0.344887 \tabularnewline
37 & 0.038292 & 0.351 & 0.36325 \tabularnewline
38 & 0.045548 & 0.4175 & 0.338705 \tabularnewline
39 & -0.034885 & -0.3197 & 0.374985 \tabularnewline
40 & -0.005098 & -0.0467 & 0.481423 \tabularnewline
41 & 0.057293 & 0.5251 & 0.300448 \tabularnewline
42 & -0.079272 & -0.7265 & 0.234764 \tabularnewline
43 & 0.093704 & 0.8588 & 0.196444 \tabularnewline
44 & -0.13017 & -1.193 & 0.118108 \tabularnewline
45 & -0.054101 & -0.4958 & 0.31065 \tabularnewline
46 & 0.140161 & 1.2846 & 0.101232 \tabularnewline
47 & -0.001834 & -0.0168 & 0.493314 \tabularnewline
48 & 0.039085 & 0.3582 & 0.360538 \tabularnewline
\hline
\end{tabular}
%Source: https://freestatistics.org/blog/index.php?pk=40368&T=2

[TABLE]
[ROW][C]Partial Autocorrelation Function[/C][/ROW]
[ROW][C]Time lag k[/C][C]PACF(k)[/C][C]T-STAT[/C][C]P-value[/C][/ROW]
[ROW][C]1[/C][C]0.261915[/C][C]2.4005[/C][C]0.009291[/C][/ROW]
[ROW][C]2[/C][C]0.36034[/C][C]3.3026[/C][C]0.000704[/C][/ROW]
[ROW][C]3[/C][C]0.22453[/C][C]2.0579[/C][C]0.021352[/C][/ROW]
[ROW][C]4[/C][C]-0.167203[/C][C]-1.5324[/C][C]0.064586[/C][/ROW]
[ROW][C]5[/C][C]0.031358[/C][C]0.2874[/C][C]0.387257[/C][/ROW]
[ROW][C]6[/C][C]0.02998[/C][C]0.2748[/C][C]0.392084[/C][/ROW]
[ROW][C]7[/C][C]0.070163[/C][C]0.6431[/C][C]0.260971[/C][/ROW]
[ROW][C]8[/C][C]-0.08132[/C][C]-0.7453[/C][C]0.229082[/C][/ROW]
[ROW][C]9[/C][C]0.274011[/C][C]2.5114[/C][C]0.006971[/C][/ROW]
[ROW][C]10[/C][C]0.130017[/C][C]1.1916[/C][C]0.118381[/C][/ROW]
[ROW][C]11[/C][C]-0.0817[/C][C]-0.7488[/C][C]0.228037[/C][/ROW]
[ROW][C]12[/C][C]0.529042[/C][C]4.8487[/C][C]3e-06[/C][/ROW]
[ROW][C]13[/C][C]-0.19414[/C][C]-1.7793[/C][C]0.039402[/C][/ROW]
[ROW][C]14[/C][C]-0.183145[/C][C]-1.6786[/C][C]0.048478[/C][/ROW]
[ROW][C]15[/C][C]-0.115626[/C][C]-1.0597[/C][C]0.146153[/C][/ROW]
[ROW][C]16[/C][C]-0.052531[/C][C]-0.4815[/C][C]0.315723[/C][/ROW]
[ROW][C]17[/C][C]-0.129425[/C][C]-1.1862[/C][C]0.119444[/C][/ROW]
[ROW][C]18[/C][C]0.080859[/C][C]0.7411[/C][C]0.230353[/C][/ROW]
[ROW][C]19[/C][C]-0.0471[/C][C]-0.4317[/C][C]0.333539[/C][/ROW]
[ROW][C]20[/C][C]-0.015234[/C][C]-0.1396[/C][C]0.444646[/C][/ROW]
[ROW][C]21[/C][C]-0.119372[/C][C]-1.0941[/C][C]0.138528[/C][/ROW]
[ROW][C]22[/C][C]0.057043[/C][C]0.5228[/C][C]0.301243[/C][/ROW]
[ROW][C]23[/C][C]0.057775[/C][C]0.5295[/C][C]0.298922[/C][/ROW]
[ROW][C]24[/C][C]0.015627[/C][C]0.1432[/C][C]0.44323[/C][/ROW]
[ROW][C]25[/C][C]-0.097826[/C][C]-0.8966[/C][C]0.186251[/C][/ROW]
[ROW][C]26[/C][C]-0.120542[/C][C]-1.1048[/C][C]0.136203[/C][/ROW]
[ROW][C]27[/C][C]-0.026486[/C][C]-0.2427[/C][C]0.404396[/C][/ROW]
[ROW][C]28[/C][C]-0.07521[/C][C]-0.6893[/C][C]0.246264[/C][/ROW]
[ROW][C]29[/C][C]-0.120077[/C][C]-1.1005[/C][C]0.137124[/C][/ROW]
[ROW][C]30[/C][C]-0.100081[/C][C]-0.9173[/C][C]0.180817[/C][/ROW]
[ROW][C]31[/C][C]0.078004[/C][C]0.7149[/C][C]0.238321[/C][/ROW]
[ROW][C]32[/C][C]0.113732[/C][C]1.0424[/C][C]0.150115[/C][/ROW]
[ROW][C]33[/C][C]-0.050985[/C][C]-0.4673[/C][C]0.320753[/C][/ROW]
[ROW][C]34[/C][C]-0.038642[/C][C]-0.3542[/C][C]0.362053[/C][/ROW]
[ROW][C]35[/C][C]-0.076128[/C][C]-0.6977[/C][C]0.243637[/C][/ROW]
[ROW][C]36[/C][C]-0.043703[/C][C]-0.4005[/C][C]0.344887[/C][/ROW]
[ROW][C]37[/C][C]0.038292[/C][C]0.351[/C][C]0.36325[/C][/ROW]
[ROW][C]38[/C][C]0.045548[/C][C]0.4175[/C][C]0.338705[/C][/ROW]
[ROW][C]39[/C][C]-0.034885[/C][C]-0.3197[/C][C]0.374985[/C][/ROW]
[ROW][C]40[/C][C]-0.005098[/C][C]-0.0467[/C][C]0.481423[/C][/ROW]
[ROW][C]41[/C][C]0.057293[/C][C]0.5251[/C][C]0.300448[/C][/ROW]
[ROW][C]42[/C][C]-0.079272[/C][C]-0.7265[/C][C]0.234764[/C][/ROW]
[ROW][C]43[/C][C]0.093704[/C][C]0.8588[/C][C]0.196444[/C][/ROW]
[ROW][C]44[/C][C]-0.13017[/C][C]-1.193[/C][C]0.118108[/C][/ROW]
[ROW][C]45[/C][C]-0.054101[/C][C]-0.4958[/C][C]0.31065[/C][/ROW]
[ROW][C]46[/C][C]0.140161[/C][C]1.2846[/C][C]0.101232[/C][/ROW]
[ROW][C]47[/C][C]-0.001834[/C][C]-0.0168[/C][C]0.493314[/C][/ROW]
[ROW][C]48[/C][C]0.039085[/C][C]0.3582[/C][C]0.360538[/C][/ROW]
[/TABLE]
Source: https://freestatistics.org/blog/index.php?pk=40368&T=2

Globally Unique Identifier (entire table): ba.freestatistics.org/blog/index.php?pk=40368&T=2

As an alternative you can also use a QR Code:  

The GUIDs for individual cells are displayed in the table below:

Partial Autocorrelation Function
Time lag kPACF(k)T-STATP-value
10.2619152.40050.009291
20.360343.30260.000704
30.224532.05790.021352
4-0.167203-1.53240.064586
50.0313580.28740.387257
60.029980.27480.392084
70.0701630.64310.260971
8-0.08132-0.74530.229082
90.2740112.51140.006971
100.1300171.19160.118381
11-0.0817-0.74880.228037
120.5290424.84873e-06
13-0.19414-1.77930.039402
14-0.183145-1.67860.048478
15-0.115626-1.05970.146153
16-0.052531-0.48150.315723
17-0.129425-1.18620.119444
180.0808590.74110.230353
19-0.0471-0.43170.333539
20-0.015234-0.13960.444646
21-0.119372-1.09410.138528
220.0570430.52280.301243
230.0577750.52950.298922
240.0156270.14320.44323
25-0.097826-0.89660.186251
26-0.120542-1.10480.136203
27-0.026486-0.24270.404396
28-0.07521-0.68930.246264
29-0.120077-1.10050.137124
30-0.100081-0.91730.180817
310.0780040.71490.238321
320.1137321.04240.150115
33-0.050985-0.46730.320753
34-0.038642-0.35420.362053
35-0.076128-0.69770.243637
36-0.043703-0.40050.344887
370.0382920.3510.36325
380.0455480.41750.338705
39-0.034885-0.31970.374985
40-0.005098-0.04670.481423
410.0572930.52510.300448
42-0.079272-0.72650.234764
430.0937040.85880.196444
44-0.13017-1.1930.118108
45-0.054101-0.49580.31065
460.1401611.28460.101232
47-0.001834-0.01680.493314
480.0390850.35820.360538


Parameters (Session):
par1 = 48 ; par2 = 1 ; par3 = 0 ; par4 = 0 ; par5 = 12 ;
Parameters (R input):
par1 = 48 ; par2 = 1 ; par3 = 0 ; par4 = 0 ; par5 = 12 ;
R code (references can be found in the software module):
if (par1 == 'Default') {
par1 = 10*log10(length(x))
} else {
par1 <- as.numeric(par1)
}
par2 <- as.numeric(par2)
par3 <- as.numeric(par3)
par4 <- as.numeric(par4)
par5 <- as.numeric(par5)
if (par2 == 0) {
x <- log(x)
} else {
x <- (x ^ par2 - 1) / par2
}
if (par3 > 0) x <- diff(x,lag=1,difference=par3)
if (par4 > 0) x <- diff(x,lag=par5,difference=par4)
bitmap(file='pic1.png')
racf <- acf(x,par1,main='Autocorrelation',xlab='lags',ylab='ACF')
dev.off()
bitmap(file='pic2.png')
rpacf <- pacf(x,par1,main='Partial Autocorrelation',xlab='lags',ylab='PACF')
dev.off()
(myacf <- c(racf$acf))
(mypacf <- c(rpacf$acf))
lengthx <- length(x)
sqrtn <- sqrt(lengthx)
load(file='createtable')
a<-table.start()
a<-table.row.start(a)
a<-table.element(a,'Autocorrelation Function',4,TRUE)
a<-table.row.end(a)
a<-table.row.start(a)
a<-table.element(a,'Time lag k',header=TRUE)
a<-table.element(a,hyperlink('basics.htm','ACF(k)','click here for more information about the Autocorrelation Function'),header=TRUE)
a<-table.element(a,'T-STAT',header=TRUE)
a<-table.element(a,'P-value',header=TRUE)
a<-table.row.end(a)
for (i in 2:(par1+1)) {
a<-table.row.start(a)
a<-table.element(a,i-1,header=TRUE)
a<-table.element(a,round(myacf[i],6))
mytstat <- myacf[i]*sqrtn
a<-table.element(a,round(mytstat,4))
a<-table.element(a,round(1-pt(abs(mytstat),lengthx),6))
a<-table.row.end(a)
}
a<-table.end(a)
table.save(a,file='mytable.tab')
a<-table.start()
a<-table.row.start(a)
a<-table.element(a,'Partial Autocorrelation Function',4,TRUE)
a<-table.row.end(a)
a<-table.row.start(a)
a<-table.element(a,'Time lag k',header=TRUE)
a<-table.element(a,hyperlink('basics.htm','PACF(k)','click here for more information about the Partial Autocorrelation Function'),header=TRUE)
a<-table.element(a,'T-STAT',header=TRUE)
a<-table.element(a,'P-value',header=TRUE)
a<-table.row.end(a)
for (i in 1:par1) {
a<-table.row.start(a)
a<-table.element(a,i,header=TRUE)
a<-table.element(a,round(mypacf[i],6))
mytstat <- mypacf[i]*sqrtn
a<-table.element(a,round(mytstat,4))
a<-table.element(a,round(1-pt(abs(mytstat),lengthx),6))
a<-table.row.end(a)
}
a<-table.end(a)
table.save(a,file='mytable1.tab')