Free Statistics

of Irreproducible Research!

Author's title

Author*Unverified author*
R Software Modulerwasp_autocorrelation.wasp
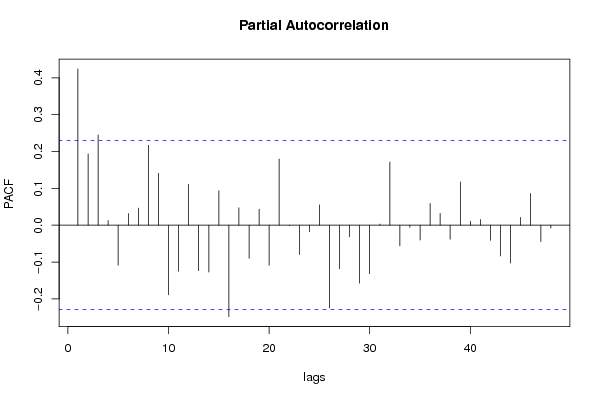
Title produced by software(Partial) Autocorrelation Function
Date of computationSat, 16 May 2009 07:42:07 -0600
Cite this page as followsStatistical Computations at FreeStatistics.org, Office for Research Development and Education, URL https://freestatistics.org/blog/index.php?v=date/2009/May/16/t12424814384f3dg60odex1kl3.htm/, Retrieved Tue, 07 May 2024 13:27:06 +0000
Statistical Computations at FreeStatistics.org, Office for Research Development and Education, URL https://freestatistics.org/blog/index.php?pk=40176, Retrieved Tue, 07 May 2024 13:27:06 +0000
QR Codes:

Original text written by user:
IsPrivate?No (this computation is public)
User-defined keywords
Estimated Impact160
Family? (F = Feedback message, R = changed R code, M = changed R Module, P = changed Parameters, D = changed Data)
-       [(Partial) Autocorrelation Function] [bouwvergunningen ...] [2009-05-16 13:42:07] [d41d8cd98f00b204e9800998ecf8427e] [Current]
Feedback Forum

Post a new message
Dataseries X:
1639
1296
1063
1282
1365
1268
1532
1455
1393
1515
1510
1225
1577
1417
1224
1693
1633
1639
1914
1586
1552
2081
1500
1437
1470
1849
1387
1592
1590
1798
1935
1887
2027
2080
1556
1682
1785
1869
1781
2082
2571
1862
1938
1505
1767
1607
1578
1495
1615
1700
1337
1531
1623
1543
1638
1520
1416
1820
1596
1358
1267
1742
1402
1388
1646
1670
1531
1730
1407
1795
1504
1371
1734


Summary of computational transaction
Raw Inputview raw input (R code)
Raw Outputview raw output of R engine
Computing time1 seconds
R Server'Gwilym Jenkins' @ 72.249.127.135

\begin{tabular}{lllllllll}
\hline
Summary of computational transaction \tabularnewline
Raw Input & view raw input (R code)  \tabularnewline
Raw Output & view raw output of R engine  \tabularnewline
Computing time & 1 seconds \tabularnewline
R Server & 'Gwilym Jenkins' @ 72.249.127.135 \tabularnewline
\hline
\end{tabular}
%Source: https://freestatistics.org/blog/index.php?pk=40176&T=0

[TABLE]
[ROW][C]Summary of computational transaction[/C][/ROW]
[ROW][C]Raw Input[/C][C]view raw input (R code) [/C][/ROW]
[ROW][C]Raw Output[/C][C]view raw output of R engine [/C][/ROW]
[ROW][C]Computing time[/C][C]1 seconds[/C][/ROW]
[ROW][C]R Server[/C][C]'Gwilym Jenkins' @ 72.249.127.135[/C][/ROW]
[/TABLE]
Source: https://freestatistics.org/blog/index.php?pk=40176&T=0

Globally Unique Identifier (entire table): ba.freestatistics.org/blog/index.php?pk=40176&T=0

As an alternative you can also use a QR Code:  

The GUIDs for individual cells are displayed in the table below:

Summary of computational transaction
Raw Inputview raw input (R code)
Raw Outputview raw output of R engine
Computing time1 seconds
R Server'Gwilym Jenkins' @ 72.249.127.135


Autocorrelation Function
Time lag kACF(k)T-STATP-value
10.4242583.62490.000266
20.3386972.89380.002507
30.3913183.34340.000654
40.2656772.26990.013082
50.1262021.07830.142232
60.1636971.39860.083079
70.1534041.31070.097037
80.2417652.06560.021207
90.2689632.2980.012214
100.0910580.7780.219541
110.085860.73360.232776
120.1967621.68110.048506
13-0.032375-0.27660.391429
14-0.122184-1.04390.149978
150.0465250.39750.346076
16-0.155537-1.32890.094009
17-0.094766-0.80970.210379
18-0.117759-1.00610.158838
19-0.112007-0.9570.170865
20-0.161643-1.38110.085734
210.00410.0350.486074
22-0.11888-1.01570.156561
23-0.140595-1.20120.11677
24-0.060855-0.51990.302337
25-0.108909-0.93050.177585
26-0.275882-2.35710.01055
27-0.220864-1.88710.031564
28-0.272836-2.33110.011256
29-0.313399-2.67770.004576
30-0.275207-2.35140.010703
31-0.295422-2.52410.006887
32-0.1418-1.21150.114798
33-0.116288-0.99360.161859
34-0.144775-1.2370.110034
35-0.242659-2.07330.020838
36-0.053688-0.45870.323903
37-0.153745-1.31360.096547
38-0.266454-2.27660.012872
39-0.114328-0.97680.165943
40-0.003004-0.02570.489795
41-0.073054-0.62420.267229
420.0091250.0780.469036
43-0.006338-0.05420.478481
440.0202910.17340.43142
450.0472010.40330.343959
460.0478730.4090.341859
470.0103680.08860.464826
480.1021310.87260.192869

\begin{tabular}{lllllllll}
\hline
Autocorrelation Function \tabularnewline
Time lag k & ACF(k) & T-STAT & P-value \tabularnewline
1 & 0.424258 & 3.6249 & 0.000266 \tabularnewline
2 & 0.338697 & 2.8938 & 0.002507 \tabularnewline
3 & 0.391318 & 3.3434 & 0.000654 \tabularnewline
4 & 0.265677 & 2.2699 & 0.013082 \tabularnewline
5 & 0.126202 & 1.0783 & 0.142232 \tabularnewline
6 & 0.163697 & 1.3986 & 0.083079 \tabularnewline
7 & 0.153404 & 1.3107 & 0.097037 \tabularnewline
8 & 0.241765 & 2.0656 & 0.021207 \tabularnewline
9 & 0.268963 & 2.298 & 0.012214 \tabularnewline
10 & 0.091058 & 0.778 & 0.219541 \tabularnewline
11 & 0.08586 & 0.7336 & 0.232776 \tabularnewline
12 & 0.196762 & 1.6811 & 0.048506 \tabularnewline
13 & -0.032375 & -0.2766 & 0.391429 \tabularnewline
14 & -0.122184 & -1.0439 & 0.149978 \tabularnewline
15 & 0.046525 & 0.3975 & 0.346076 \tabularnewline
16 & -0.155537 & -1.3289 & 0.094009 \tabularnewline
17 & -0.094766 & -0.8097 & 0.210379 \tabularnewline
18 & -0.117759 & -1.0061 & 0.158838 \tabularnewline
19 & -0.112007 & -0.957 & 0.170865 \tabularnewline
20 & -0.161643 & -1.3811 & 0.085734 \tabularnewline
21 & 0.0041 & 0.035 & 0.486074 \tabularnewline
22 & -0.11888 & -1.0157 & 0.156561 \tabularnewline
23 & -0.140595 & -1.2012 & 0.11677 \tabularnewline
24 & -0.060855 & -0.5199 & 0.302337 \tabularnewline
25 & -0.108909 & -0.9305 & 0.177585 \tabularnewline
26 & -0.275882 & -2.3571 & 0.01055 \tabularnewline
27 & -0.220864 & -1.8871 & 0.031564 \tabularnewline
28 & -0.272836 & -2.3311 & 0.011256 \tabularnewline
29 & -0.313399 & -2.6777 & 0.004576 \tabularnewline
30 & -0.275207 & -2.3514 & 0.010703 \tabularnewline
31 & -0.295422 & -2.5241 & 0.006887 \tabularnewline
32 & -0.1418 & -1.2115 & 0.114798 \tabularnewline
33 & -0.116288 & -0.9936 & 0.161859 \tabularnewline
34 & -0.144775 & -1.237 & 0.110034 \tabularnewline
35 & -0.242659 & -2.0733 & 0.020838 \tabularnewline
36 & -0.053688 & -0.4587 & 0.323903 \tabularnewline
37 & -0.153745 & -1.3136 & 0.096547 \tabularnewline
38 & -0.266454 & -2.2766 & 0.012872 \tabularnewline
39 & -0.114328 & -0.9768 & 0.165943 \tabularnewline
40 & -0.003004 & -0.0257 & 0.489795 \tabularnewline
41 & -0.073054 & -0.6242 & 0.267229 \tabularnewline
42 & 0.009125 & 0.078 & 0.469036 \tabularnewline
43 & -0.006338 & -0.0542 & 0.478481 \tabularnewline
44 & 0.020291 & 0.1734 & 0.43142 \tabularnewline
45 & 0.047201 & 0.4033 & 0.343959 \tabularnewline
46 & 0.047873 & 0.409 & 0.341859 \tabularnewline
47 & 0.010368 & 0.0886 & 0.464826 \tabularnewline
48 & 0.102131 & 0.8726 & 0.192869 \tabularnewline
\hline
\end{tabular}
%Source: https://freestatistics.org/blog/index.php?pk=40176&T=1

[TABLE]
[ROW][C]Autocorrelation Function[/C][/ROW]
[ROW][C]Time lag k[/C][C]ACF(k)[/C][C]T-STAT[/C][C]P-value[/C][/ROW]
[ROW][C]1[/C][C]0.424258[/C][C]3.6249[/C][C]0.000266[/C][/ROW]
[ROW][C]2[/C][C]0.338697[/C][C]2.8938[/C][C]0.002507[/C][/ROW]
[ROW][C]3[/C][C]0.391318[/C][C]3.3434[/C][C]0.000654[/C][/ROW]
[ROW][C]4[/C][C]0.265677[/C][C]2.2699[/C][C]0.013082[/C][/ROW]
[ROW][C]5[/C][C]0.126202[/C][C]1.0783[/C][C]0.142232[/C][/ROW]
[ROW][C]6[/C][C]0.163697[/C][C]1.3986[/C][C]0.083079[/C][/ROW]
[ROW][C]7[/C][C]0.153404[/C][C]1.3107[/C][C]0.097037[/C][/ROW]
[ROW][C]8[/C][C]0.241765[/C][C]2.0656[/C][C]0.021207[/C][/ROW]
[ROW][C]9[/C][C]0.268963[/C][C]2.298[/C][C]0.012214[/C][/ROW]
[ROW][C]10[/C][C]0.091058[/C][C]0.778[/C][C]0.219541[/C][/ROW]
[ROW][C]11[/C][C]0.08586[/C][C]0.7336[/C][C]0.232776[/C][/ROW]
[ROW][C]12[/C][C]0.196762[/C][C]1.6811[/C][C]0.048506[/C][/ROW]
[ROW][C]13[/C][C]-0.032375[/C][C]-0.2766[/C][C]0.391429[/C][/ROW]
[ROW][C]14[/C][C]-0.122184[/C][C]-1.0439[/C][C]0.149978[/C][/ROW]
[ROW][C]15[/C][C]0.046525[/C][C]0.3975[/C][C]0.346076[/C][/ROW]
[ROW][C]16[/C][C]-0.155537[/C][C]-1.3289[/C][C]0.094009[/C][/ROW]
[ROW][C]17[/C][C]-0.094766[/C][C]-0.8097[/C][C]0.210379[/C][/ROW]
[ROW][C]18[/C][C]-0.117759[/C][C]-1.0061[/C][C]0.158838[/C][/ROW]
[ROW][C]19[/C][C]-0.112007[/C][C]-0.957[/C][C]0.170865[/C][/ROW]
[ROW][C]20[/C][C]-0.161643[/C][C]-1.3811[/C][C]0.085734[/C][/ROW]
[ROW][C]21[/C][C]0.0041[/C][C]0.035[/C][C]0.486074[/C][/ROW]
[ROW][C]22[/C][C]-0.11888[/C][C]-1.0157[/C][C]0.156561[/C][/ROW]
[ROW][C]23[/C][C]-0.140595[/C][C]-1.2012[/C][C]0.11677[/C][/ROW]
[ROW][C]24[/C][C]-0.060855[/C][C]-0.5199[/C][C]0.302337[/C][/ROW]
[ROW][C]25[/C][C]-0.108909[/C][C]-0.9305[/C][C]0.177585[/C][/ROW]
[ROW][C]26[/C][C]-0.275882[/C][C]-2.3571[/C][C]0.01055[/C][/ROW]
[ROW][C]27[/C][C]-0.220864[/C][C]-1.8871[/C][C]0.031564[/C][/ROW]
[ROW][C]28[/C][C]-0.272836[/C][C]-2.3311[/C][C]0.011256[/C][/ROW]
[ROW][C]29[/C][C]-0.313399[/C][C]-2.6777[/C][C]0.004576[/C][/ROW]
[ROW][C]30[/C][C]-0.275207[/C][C]-2.3514[/C][C]0.010703[/C][/ROW]
[ROW][C]31[/C][C]-0.295422[/C][C]-2.5241[/C][C]0.006887[/C][/ROW]
[ROW][C]32[/C][C]-0.1418[/C][C]-1.2115[/C][C]0.114798[/C][/ROW]
[ROW][C]33[/C][C]-0.116288[/C][C]-0.9936[/C][C]0.161859[/C][/ROW]
[ROW][C]34[/C][C]-0.144775[/C][C]-1.237[/C][C]0.110034[/C][/ROW]
[ROW][C]35[/C][C]-0.242659[/C][C]-2.0733[/C][C]0.020838[/C][/ROW]
[ROW][C]36[/C][C]-0.053688[/C][C]-0.4587[/C][C]0.323903[/C][/ROW]
[ROW][C]37[/C][C]-0.153745[/C][C]-1.3136[/C][C]0.096547[/C][/ROW]
[ROW][C]38[/C][C]-0.266454[/C][C]-2.2766[/C][C]0.012872[/C][/ROW]
[ROW][C]39[/C][C]-0.114328[/C][C]-0.9768[/C][C]0.165943[/C][/ROW]
[ROW][C]40[/C][C]-0.003004[/C][C]-0.0257[/C][C]0.489795[/C][/ROW]
[ROW][C]41[/C][C]-0.073054[/C][C]-0.6242[/C][C]0.267229[/C][/ROW]
[ROW][C]42[/C][C]0.009125[/C][C]0.078[/C][C]0.469036[/C][/ROW]
[ROW][C]43[/C][C]-0.006338[/C][C]-0.0542[/C][C]0.478481[/C][/ROW]
[ROW][C]44[/C][C]0.020291[/C][C]0.1734[/C][C]0.43142[/C][/ROW]
[ROW][C]45[/C][C]0.047201[/C][C]0.4033[/C][C]0.343959[/C][/ROW]
[ROW][C]46[/C][C]0.047873[/C][C]0.409[/C][C]0.341859[/C][/ROW]
[ROW][C]47[/C][C]0.010368[/C][C]0.0886[/C][C]0.464826[/C][/ROW]
[ROW][C]48[/C][C]0.102131[/C][C]0.8726[/C][C]0.192869[/C][/ROW]
[/TABLE]
Source: https://freestatistics.org/blog/index.php?pk=40176&T=1

Globally Unique Identifier (entire table): ba.freestatistics.org/blog/index.php?pk=40176&T=1

As an alternative you can also use a QR Code:  

The GUIDs for individual cells are displayed in the table below:

Autocorrelation Function
Time lag kACF(k)T-STATP-value
10.4242583.62490.000266
20.3386972.89380.002507
30.3913183.34340.000654
40.2656772.26990.013082
50.1262021.07830.142232
60.1636971.39860.083079
70.1534041.31070.097037
80.2417652.06560.021207
90.2689632.2980.012214
100.0910580.7780.219541
110.085860.73360.232776
120.1967621.68110.048506
13-0.032375-0.27660.391429
14-0.122184-1.04390.149978
150.0465250.39750.346076
16-0.155537-1.32890.094009
17-0.094766-0.80970.210379
18-0.117759-1.00610.158838
19-0.112007-0.9570.170865
20-0.161643-1.38110.085734
210.00410.0350.486074
22-0.11888-1.01570.156561
23-0.140595-1.20120.11677
24-0.060855-0.51990.302337
25-0.108909-0.93050.177585
26-0.275882-2.35710.01055
27-0.220864-1.88710.031564
28-0.272836-2.33110.011256
29-0.313399-2.67770.004576
30-0.275207-2.35140.010703
31-0.295422-2.52410.006887
32-0.1418-1.21150.114798
33-0.116288-0.99360.161859
34-0.144775-1.2370.110034
35-0.242659-2.07330.020838
36-0.053688-0.45870.323903
37-0.153745-1.31360.096547
38-0.266454-2.27660.012872
39-0.114328-0.97680.165943
40-0.003004-0.02570.489795
41-0.073054-0.62420.267229
420.0091250.0780.469036
43-0.006338-0.05420.478481
440.0202910.17340.43142
450.0472010.40330.343959
460.0478730.4090.341859
470.0103680.08860.464826
480.1021310.87260.192869


Partial Autocorrelation Function
Time lag kPACF(k)T-STATP-value
10.4242583.62490.000266
20.1935381.65360.051253
30.2449332.09270.019925
40.0124760.10660.457701
5-0.108792-0.92950.177842
60.0315290.26940.394197
70.0463070.39560.346759
80.2168141.85250.034001
90.1409211.2040.116234
10-0.189286-1.61730.055067
11-0.124904-1.06720.144704
120.1109580.9480.173122
13-0.123544-1.05560.147326
14-0.127481-1.08920.139825
150.0934830.79870.213522
16-0.248425-2.12250.018592
170.0472050.40330.343945
18-0.090084-0.76970.221988
190.0435120.37180.355571
20-0.108647-0.92830.178162
210.1795881.53440.064627
22-0.001476-0.01260.494985
23-0.079831-0.68210.248673
24-0.018093-0.15460.438786
250.0551370.47110.319492
26-0.224659-1.91950.029415
27-0.118501-1.01250.157328
28-0.031674-0.27060.393724
29-0.157631-1.34680.091106
30-0.13159-1.12430.132283
310.003140.02680.489335
320.1715561.46580.073502
33-0.056214-0.48030.316229
34-0.005724-0.04890.480564
35-0.040547-0.34640.365005
360.0586220.50090.308987
370.0318680.27230.393087
38-0.038028-0.32490.373089
390.1171221.00070.160141
400.0108260.09250.463278
410.0153340.1310.448062
42-0.041009-0.35040.363531
43-0.08363-0.71450.238588
44-0.102851-0.87880.191208
450.020920.17870.429319
460.0858080.73310.232908
47-0.044602-0.38110.352126
48-0.007959-0.0680.472985

\begin{tabular}{lllllllll}
\hline
Partial Autocorrelation Function \tabularnewline
Time lag k & PACF(k) & T-STAT & P-value \tabularnewline
1 & 0.424258 & 3.6249 & 0.000266 \tabularnewline
2 & 0.193538 & 1.6536 & 0.051253 \tabularnewline
3 & 0.244933 & 2.0927 & 0.019925 \tabularnewline
4 & 0.012476 & 0.1066 & 0.457701 \tabularnewline
5 & -0.108792 & -0.9295 & 0.177842 \tabularnewline
6 & 0.031529 & 0.2694 & 0.394197 \tabularnewline
7 & 0.046307 & 0.3956 & 0.346759 \tabularnewline
8 & 0.216814 & 1.8525 & 0.034001 \tabularnewline
9 & 0.140921 & 1.204 & 0.116234 \tabularnewline
10 & -0.189286 & -1.6173 & 0.055067 \tabularnewline
11 & -0.124904 & -1.0672 & 0.144704 \tabularnewline
12 & 0.110958 & 0.948 & 0.173122 \tabularnewline
13 & -0.123544 & -1.0556 & 0.147326 \tabularnewline
14 & -0.127481 & -1.0892 & 0.139825 \tabularnewline
15 & 0.093483 & 0.7987 & 0.213522 \tabularnewline
16 & -0.248425 & -2.1225 & 0.018592 \tabularnewline
17 & 0.047205 & 0.4033 & 0.343945 \tabularnewline
18 & -0.090084 & -0.7697 & 0.221988 \tabularnewline
19 & 0.043512 & 0.3718 & 0.355571 \tabularnewline
20 & -0.108647 & -0.9283 & 0.178162 \tabularnewline
21 & 0.179588 & 1.5344 & 0.064627 \tabularnewline
22 & -0.001476 & -0.0126 & 0.494985 \tabularnewline
23 & -0.079831 & -0.6821 & 0.248673 \tabularnewline
24 & -0.018093 & -0.1546 & 0.438786 \tabularnewline
25 & 0.055137 & 0.4711 & 0.319492 \tabularnewline
26 & -0.224659 & -1.9195 & 0.029415 \tabularnewline
27 & -0.118501 & -1.0125 & 0.157328 \tabularnewline
28 & -0.031674 & -0.2706 & 0.393724 \tabularnewline
29 & -0.157631 & -1.3468 & 0.091106 \tabularnewline
30 & -0.13159 & -1.1243 & 0.132283 \tabularnewline
31 & 0.00314 & 0.0268 & 0.489335 \tabularnewline
32 & 0.171556 & 1.4658 & 0.073502 \tabularnewline
33 & -0.056214 & -0.4803 & 0.316229 \tabularnewline
34 & -0.005724 & -0.0489 & 0.480564 \tabularnewline
35 & -0.040547 & -0.3464 & 0.365005 \tabularnewline
36 & 0.058622 & 0.5009 & 0.308987 \tabularnewline
37 & 0.031868 & 0.2723 & 0.393087 \tabularnewline
38 & -0.038028 & -0.3249 & 0.373089 \tabularnewline
39 & 0.117122 & 1.0007 & 0.160141 \tabularnewline
40 & 0.010826 & 0.0925 & 0.463278 \tabularnewline
41 & 0.015334 & 0.131 & 0.448062 \tabularnewline
42 & -0.041009 & -0.3504 & 0.363531 \tabularnewline
43 & -0.08363 & -0.7145 & 0.238588 \tabularnewline
44 & -0.102851 & -0.8788 & 0.191208 \tabularnewline
45 & 0.02092 & 0.1787 & 0.429319 \tabularnewline
46 & 0.085808 & 0.7331 & 0.232908 \tabularnewline
47 & -0.044602 & -0.3811 & 0.352126 \tabularnewline
48 & -0.007959 & -0.068 & 0.472985 \tabularnewline
\hline
\end{tabular}
%Source: https://freestatistics.org/blog/index.php?pk=40176&T=2

[TABLE]
[ROW][C]Partial Autocorrelation Function[/C][/ROW]
[ROW][C]Time lag k[/C][C]PACF(k)[/C][C]T-STAT[/C][C]P-value[/C][/ROW]
[ROW][C]1[/C][C]0.424258[/C][C]3.6249[/C][C]0.000266[/C][/ROW]
[ROW][C]2[/C][C]0.193538[/C][C]1.6536[/C][C]0.051253[/C][/ROW]
[ROW][C]3[/C][C]0.244933[/C][C]2.0927[/C][C]0.019925[/C][/ROW]
[ROW][C]4[/C][C]0.012476[/C][C]0.1066[/C][C]0.457701[/C][/ROW]
[ROW][C]5[/C][C]-0.108792[/C][C]-0.9295[/C][C]0.177842[/C][/ROW]
[ROW][C]6[/C][C]0.031529[/C][C]0.2694[/C][C]0.394197[/C][/ROW]
[ROW][C]7[/C][C]0.046307[/C][C]0.3956[/C][C]0.346759[/C][/ROW]
[ROW][C]8[/C][C]0.216814[/C][C]1.8525[/C][C]0.034001[/C][/ROW]
[ROW][C]9[/C][C]0.140921[/C][C]1.204[/C][C]0.116234[/C][/ROW]
[ROW][C]10[/C][C]-0.189286[/C][C]-1.6173[/C][C]0.055067[/C][/ROW]
[ROW][C]11[/C][C]-0.124904[/C][C]-1.0672[/C][C]0.144704[/C][/ROW]
[ROW][C]12[/C][C]0.110958[/C][C]0.948[/C][C]0.173122[/C][/ROW]
[ROW][C]13[/C][C]-0.123544[/C][C]-1.0556[/C][C]0.147326[/C][/ROW]
[ROW][C]14[/C][C]-0.127481[/C][C]-1.0892[/C][C]0.139825[/C][/ROW]
[ROW][C]15[/C][C]0.093483[/C][C]0.7987[/C][C]0.213522[/C][/ROW]
[ROW][C]16[/C][C]-0.248425[/C][C]-2.1225[/C][C]0.018592[/C][/ROW]
[ROW][C]17[/C][C]0.047205[/C][C]0.4033[/C][C]0.343945[/C][/ROW]
[ROW][C]18[/C][C]-0.090084[/C][C]-0.7697[/C][C]0.221988[/C][/ROW]
[ROW][C]19[/C][C]0.043512[/C][C]0.3718[/C][C]0.355571[/C][/ROW]
[ROW][C]20[/C][C]-0.108647[/C][C]-0.9283[/C][C]0.178162[/C][/ROW]
[ROW][C]21[/C][C]0.179588[/C][C]1.5344[/C][C]0.064627[/C][/ROW]
[ROW][C]22[/C][C]-0.001476[/C][C]-0.0126[/C][C]0.494985[/C][/ROW]
[ROW][C]23[/C][C]-0.079831[/C][C]-0.6821[/C][C]0.248673[/C][/ROW]
[ROW][C]24[/C][C]-0.018093[/C][C]-0.1546[/C][C]0.438786[/C][/ROW]
[ROW][C]25[/C][C]0.055137[/C][C]0.4711[/C][C]0.319492[/C][/ROW]
[ROW][C]26[/C][C]-0.224659[/C][C]-1.9195[/C][C]0.029415[/C][/ROW]
[ROW][C]27[/C][C]-0.118501[/C][C]-1.0125[/C][C]0.157328[/C][/ROW]
[ROW][C]28[/C][C]-0.031674[/C][C]-0.2706[/C][C]0.393724[/C][/ROW]
[ROW][C]29[/C][C]-0.157631[/C][C]-1.3468[/C][C]0.091106[/C][/ROW]
[ROW][C]30[/C][C]-0.13159[/C][C]-1.1243[/C][C]0.132283[/C][/ROW]
[ROW][C]31[/C][C]0.00314[/C][C]0.0268[/C][C]0.489335[/C][/ROW]
[ROW][C]32[/C][C]0.171556[/C][C]1.4658[/C][C]0.073502[/C][/ROW]
[ROW][C]33[/C][C]-0.056214[/C][C]-0.4803[/C][C]0.316229[/C][/ROW]
[ROW][C]34[/C][C]-0.005724[/C][C]-0.0489[/C][C]0.480564[/C][/ROW]
[ROW][C]35[/C][C]-0.040547[/C][C]-0.3464[/C][C]0.365005[/C][/ROW]
[ROW][C]36[/C][C]0.058622[/C][C]0.5009[/C][C]0.308987[/C][/ROW]
[ROW][C]37[/C][C]0.031868[/C][C]0.2723[/C][C]0.393087[/C][/ROW]
[ROW][C]38[/C][C]-0.038028[/C][C]-0.3249[/C][C]0.373089[/C][/ROW]
[ROW][C]39[/C][C]0.117122[/C][C]1.0007[/C][C]0.160141[/C][/ROW]
[ROW][C]40[/C][C]0.010826[/C][C]0.0925[/C][C]0.463278[/C][/ROW]
[ROW][C]41[/C][C]0.015334[/C][C]0.131[/C][C]0.448062[/C][/ROW]
[ROW][C]42[/C][C]-0.041009[/C][C]-0.3504[/C][C]0.363531[/C][/ROW]
[ROW][C]43[/C][C]-0.08363[/C][C]-0.7145[/C][C]0.238588[/C][/ROW]
[ROW][C]44[/C][C]-0.102851[/C][C]-0.8788[/C][C]0.191208[/C][/ROW]
[ROW][C]45[/C][C]0.02092[/C][C]0.1787[/C][C]0.429319[/C][/ROW]
[ROW][C]46[/C][C]0.085808[/C][C]0.7331[/C][C]0.232908[/C][/ROW]
[ROW][C]47[/C][C]-0.044602[/C][C]-0.3811[/C][C]0.352126[/C][/ROW]
[ROW][C]48[/C][C]-0.007959[/C][C]-0.068[/C][C]0.472985[/C][/ROW]
[/TABLE]
Source: https://freestatistics.org/blog/index.php?pk=40176&T=2

Globally Unique Identifier (entire table): ba.freestatistics.org/blog/index.php?pk=40176&T=2

As an alternative you can also use a QR Code:  

The GUIDs for individual cells are displayed in the table below:

Partial Autocorrelation Function
Time lag kPACF(k)T-STATP-value
10.4242583.62490.000266
20.1935381.65360.051253
30.2449332.09270.019925
40.0124760.10660.457701
5-0.108792-0.92950.177842
60.0315290.26940.394197
70.0463070.39560.346759
80.2168141.85250.034001
90.1409211.2040.116234
10-0.189286-1.61730.055067
11-0.124904-1.06720.144704
120.1109580.9480.173122
13-0.123544-1.05560.147326
14-0.127481-1.08920.139825
150.0934830.79870.213522
16-0.248425-2.12250.018592
170.0472050.40330.343945
18-0.090084-0.76970.221988
190.0435120.37180.355571
20-0.108647-0.92830.178162
210.1795881.53440.064627
22-0.001476-0.01260.494985
23-0.079831-0.68210.248673
24-0.018093-0.15460.438786
250.0551370.47110.319492
26-0.224659-1.91950.029415
27-0.118501-1.01250.157328
28-0.031674-0.27060.393724
29-0.157631-1.34680.091106
30-0.13159-1.12430.132283
310.003140.02680.489335
320.1715561.46580.073502
33-0.056214-0.48030.316229
34-0.005724-0.04890.480564
35-0.040547-0.34640.365005
360.0586220.50090.308987
370.0318680.27230.393087
38-0.038028-0.32490.373089
390.1171221.00070.160141
400.0108260.09250.463278
410.0153340.1310.448062
42-0.041009-0.35040.363531
43-0.08363-0.71450.238588
44-0.102851-0.87880.191208
450.020920.17870.429319
460.0858080.73310.232908
47-0.044602-0.38110.352126
48-0.007959-0.0680.472985


Parameters (Session):
par1 = 48 ; par2 = 1 ; par3 = 0 ; par4 = 0 ; par5 = 12 ;
Parameters (R input):
par1 = 48 ; par2 = 1 ; par3 = 0 ; par4 = 0 ; par5 = 12 ;
R code (references can be found in the software module):
if (par1 == 'Default') {
par1 = 10*log10(length(x))
} else {
par1 <- as.numeric(par1)
}
par2 <- as.numeric(par2)
par3 <- as.numeric(par3)
par4 <- as.numeric(par4)
par5 <- as.numeric(par5)
if (par2 == 0) {
x <- log(x)
} else {
x <- (x ^ par2 - 1) / par2
}
if (par3 > 0) x <- diff(x,lag=1,difference=par3)
if (par4 > 0) x <- diff(x,lag=par5,difference=par4)
bitmap(file='pic1.png')
racf <- acf(x,par1,main='Autocorrelation',xlab='lags',ylab='ACF')
dev.off()
bitmap(file='pic2.png')
rpacf <- pacf(x,par1,main='Partial Autocorrelation',xlab='lags',ylab='PACF')
dev.off()
(myacf <- c(racf$acf))
(mypacf <- c(rpacf$acf))
lengthx <- length(x)
sqrtn <- sqrt(lengthx)
load(file='createtable')
a<-table.start()
a<-table.row.start(a)
a<-table.element(a,'Autocorrelation Function',4,TRUE)
a<-table.row.end(a)
a<-table.row.start(a)
a<-table.element(a,'Time lag k',header=TRUE)
a<-table.element(a,hyperlink('basics.htm','ACF(k)','click here for more information about the Autocorrelation Function'),header=TRUE)
a<-table.element(a,'T-STAT',header=TRUE)
a<-table.element(a,'P-value',header=TRUE)
a<-table.row.end(a)
for (i in 2:(par1+1)) {
a<-table.row.start(a)
a<-table.element(a,i-1,header=TRUE)
a<-table.element(a,round(myacf[i],6))
mytstat <- myacf[i]*sqrtn
a<-table.element(a,round(mytstat,4))
a<-table.element(a,round(1-pt(abs(mytstat),lengthx),6))
a<-table.row.end(a)
}
a<-table.end(a)
table.save(a,file='mytable.tab')
a<-table.start()
a<-table.row.start(a)
a<-table.element(a,'Partial Autocorrelation Function',4,TRUE)
a<-table.row.end(a)
a<-table.row.start(a)
a<-table.element(a,'Time lag k',header=TRUE)
a<-table.element(a,hyperlink('basics.htm','PACF(k)','click here for more information about the Partial Autocorrelation Function'),header=TRUE)
a<-table.element(a,'T-STAT',header=TRUE)
a<-table.element(a,'P-value',header=TRUE)
a<-table.row.end(a)
for (i in 1:par1) {
a<-table.row.start(a)
a<-table.element(a,i,header=TRUE)
a<-table.element(a,round(mypacf[i],6))
mytstat <- mypacf[i]*sqrtn
a<-table.element(a,round(mytstat,4))
a<-table.element(a,round(1-pt(abs(mytstat),lengthx),6))
a<-table.row.end(a)
}
a<-table.end(a)
table.save(a,file='mytable1.tab')