Free Statistics

of Irreproducible Research!

Author's title

Author*Unverified author*
R Software Modulerwasp_autocorrelation.wasp
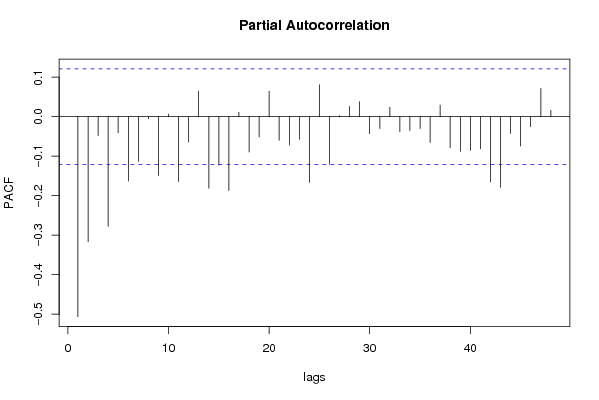
Title produced by software(Partial) Autocorrelation Function
Date of computationThu, 14 May 2009 15:46:59 -0600
Cite this page as followsStatistical Computations at FreeStatistics.org, Office for Research Development and Education, URL https://freestatistics.org/blog/index.php?v=date/2009/May/14/t1242337664mpukv2bsqo9rxft.htm/, Retrieved Mon, 29 Apr 2024 00:13:09 +0000
Statistical Computations at FreeStatistics.org, Office for Research Development and Education, URL https://freestatistics.org/blog/index.php?pk=40112, Retrieved Mon, 29 Apr 2024 00:13:09 +0000
QR Codes:

Original text written by user:
IsPrivate?No (this computation is public)
User-defined keywords
Estimated Impact112
Family? (F = Feedback message, R = changed R code, M = changed R Module, P = changed Parameters, D = changed Data)
-       [(Partial) Autocorrelation Function] [Gabriels Wim 6Bis...] [2009-05-14 21:46:59] [d41d8cd98f00b204e9800998ecf8427e] [Current]
Feedback Forum

Post a new message
Dataseries X:
374
572
402
589
507
628
698
451
694
0
488
526
343
494
447
0
470
366
517
483
485
530
308
481
437
468
502
408
479
436
410
451
344
411
0
427
454
365
499
416
430
470
325
452
442
488
446
523
594
439
588
503
444
525
375
472
436
458
514
0
472
360
450
549
361
466
387
457
470
396
471
422
404
414
342
459
379
0
410
319
411
371
365
429
333
392
469
432
534
379
436
448
358
492
387
529
475
439
459
361
0
0
394
425
341
455
403
471
523
389
531
468
398
446
355
435
353
0
400
332
389
355
384
406
356
336
351
278
265
229
387
435
317
490
472
440
429
350
489
494
436
436
375
429
0
434
472
362
440
433
400
442
316
432
401
434
488
377
484
377
0
0
300
389
337
376
377
331
339
356
280
249
196
268
379
401
404
397
419
421
407
296
468
475
422
456
339
446
419
346
327
326
403
359
358
421
322
367
394
356
418
344
372
358
373
379
0
348
369
341
390
279
325
354
346
358
296
356
337
360
474
362
440
443
435
429
341
434
329
416
430
307
408
322
0
324
303
369
328
258
372
298
376
306
359
418
311
355
335
345
318
291
340
0
356
419
296
361
371
392
383
286
362
358


Summary of computational transaction
Raw Inputview raw input (R code)
Raw Outputview raw output of R engine
Computing time2 seconds
R Server'Sir Ronald Aylmer Fisher' @ 193.190.124.24

\begin{tabular}{lllllllll}
\hline
Summary of computational transaction \tabularnewline
Raw Input & view raw input (R code)  \tabularnewline
Raw Output & view raw output of R engine  \tabularnewline
Computing time & 2 seconds \tabularnewline
R Server & 'Sir Ronald Aylmer Fisher' @ 193.190.124.24 \tabularnewline
\hline
\end{tabular}
%Source: https://freestatistics.org/blog/index.php?pk=40112&T=0

[TABLE]
[ROW][C]Summary of computational transaction[/C][/ROW]
[ROW][C]Raw Input[/C][C]view raw input (R code) [/C][/ROW]
[ROW][C]Raw Output[/C][C]view raw output of R engine [/C][/ROW]
[ROW][C]Computing time[/C][C]2 seconds[/C][/ROW]
[ROW][C]R Server[/C][C]'Sir Ronald Aylmer Fisher' @ 193.190.124.24[/C][/ROW]
[/TABLE]
Source: https://freestatistics.org/blog/index.php?pk=40112&T=0

Globally Unique Identifier (entire table): ba.freestatistics.org/blog/index.php?pk=40112&T=0

As an alternative you can also use a QR Code:  

The GUIDs for individual cells are displayed in the table below:

Summary of computational transaction
Raw Inputview raw input (R code)
Raw Outputview raw output of R engine
Computing time2 seconds
R Server'Sir Ronald Aylmer Fisher' @ 193.190.124.24


Autocorrelation Function
Time lag kACF(k)T-STATP-value
1-0.506177-8.20880
20.0205340.3330.369699
30.1147371.86070.03195
4-0.246181-3.99244.2e-05
50.2302083.73330.000116
6-0.165454-2.68320.003877
70.0425880.69070.245194
80.1035051.67860.047212
9-0.200313-3.24850.000655
100.2124093.44470.000333
11-0.193788-3.14270.000933
120.0930231.50860.066303
130.1131581.83510.033809
14-0.284778-4.61833e-06
150.2232843.62110.000176
16-0.134962-2.18870.014748
170.1175461.90630.028853
18-0.009786-0.15870.437014
19-0.088468-1.43470.076279
200.1951653.1650.000867
21-0.215621-3.49680.000276
220.0676471.09710.136811
230.0532160.8630.194455
24-0.179253-2.9070.00198
250.3205125.19780
26-0.300056-4.86611e-06
270.1464332.37470.009139
280.0604940.98110.163734
29-0.15923-2.58230.005178
300.1418972.30120.011082
31-0.147847-2.39770.008598
320.1101831.78690.037556
33-0.015537-0.2520.400631
34-0.11423-1.85250.032537
350.1805012.92720.00186
36-0.157537-2.55480.005594
370.1297632.10440.018147
38-0.054994-0.89190.186642
39-0.119794-1.94270.026558
400.2017243.27140.000607
41-0.173833-2.81910.002591
420.0708391.14880.125839
430.0033670.05460.478248
440.0284570.46150.322413
450.07591.23090.109733
46-0.135793-2.20220.01426
470.1418852.3010.011087
48-0.077743-1.26080.104253

\begin{tabular}{lllllllll}
\hline
Autocorrelation Function \tabularnewline
Time lag k & ACF(k) & T-STAT & P-value \tabularnewline
1 & -0.506177 & -8.2088 & 0 \tabularnewline
2 & 0.020534 & 0.333 & 0.369699 \tabularnewline
3 & 0.114737 & 1.8607 & 0.03195 \tabularnewline
4 & -0.246181 & -3.9924 & 4.2e-05 \tabularnewline
5 & 0.230208 & 3.7333 & 0.000116 \tabularnewline
6 & -0.165454 & -2.6832 & 0.003877 \tabularnewline
7 & 0.042588 & 0.6907 & 0.245194 \tabularnewline
8 & 0.103505 & 1.6786 & 0.047212 \tabularnewline
9 & -0.200313 & -3.2485 & 0.000655 \tabularnewline
10 & 0.212409 & 3.4447 & 0.000333 \tabularnewline
11 & -0.193788 & -3.1427 & 0.000933 \tabularnewline
12 & 0.093023 & 1.5086 & 0.066303 \tabularnewline
13 & 0.113158 & 1.8351 & 0.033809 \tabularnewline
14 & -0.284778 & -4.6183 & 3e-06 \tabularnewline
15 & 0.223284 & 3.6211 & 0.000176 \tabularnewline
16 & -0.134962 & -2.1887 & 0.014748 \tabularnewline
17 & 0.117546 & 1.9063 & 0.028853 \tabularnewline
18 & -0.009786 & -0.1587 & 0.437014 \tabularnewline
19 & -0.088468 & -1.4347 & 0.076279 \tabularnewline
20 & 0.195165 & 3.165 & 0.000867 \tabularnewline
21 & -0.215621 & -3.4968 & 0.000276 \tabularnewline
22 & 0.067647 & 1.0971 & 0.136811 \tabularnewline
23 & 0.053216 & 0.863 & 0.194455 \tabularnewline
24 & -0.179253 & -2.907 & 0.00198 \tabularnewline
25 & 0.320512 & 5.1978 & 0 \tabularnewline
26 & -0.300056 & -4.8661 & 1e-06 \tabularnewline
27 & 0.146433 & 2.3747 & 0.009139 \tabularnewline
28 & 0.060494 & 0.9811 & 0.163734 \tabularnewline
29 & -0.15923 & -2.5823 & 0.005178 \tabularnewline
30 & 0.141897 & 2.3012 & 0.011082 \tabularnewline
31 & -0.147847 & -2.3977 & 0.008598 \tabularnewline
32 & 0.110183 & 1.7869 & 0.037556 \tabularnewline
33 & -0.015537 & -0.252 & 0.400631 \tabularnewline
34 & -0.11423 & -1.8525 & 0.032537 \tabularnewline
35 & 0.180501 & 2.9272 & 0.00186 \tabularnewline
36 & -0.157537 & -2.5548 & 0.005594 \tabularnewline
37 & 0.129763 & 2.1044 & 0.018147 \tabularnewline
38 & -0.054994 & -0.8919 & 0.186642 \tabularnewline
39 & -0.119794 & -1.9427 & 0.026558 \tabularnewline
40 & 0.201724 & 3.2714 & 0.000607 \tabularnewline
41 & -0.173833 & -2.8191 & 0.002591 \tabularnewline
42 & 0.070839 & 1.1488 & 0.125839 \tabularnewline
43 & 0.003367 & 0.0546 & 0.478248 \tabularnewline
44 & 0.028457 & 0.4615 & 0.322413 \tabularnewline
45 & 0.0759 & 1.2309 & 0.109733 \tabularnewline
46 & -0.135793 & -2.2022 & 0.01426 \tabularnewline
47 & 0.141885 & 2.301 & 0.011087 \tabularnewline
48 & -0.077743 & -1.2608 & 0.104253 \tabularnewline
\hline
\end{tabular}
%Source: https://freestatistics.org/blog/index.php?pk=40112&T=1

[TABLE]
[ROW][C]Autocorrelation Function[/C][/ROW]
[ROW][C]Time lag k[/C][C]ACF(k)[/C][C]T-STAT[/C][C]P-value[/C][/ROW]
[ROW][C]1[/C][C]-0.506177[/C][C]-8.2088[/C][C]0[/C][/ROW]
[ROW][C]2[/C][C]0.020534[/C][C]0.333[/C][C]0.369699[/C][/ROW]
[ROW][C]3[/C][C]0.114737[/C][C]1.8607[/C][C]0.03195[/C][/ROW]
[ROW][C]4[/C][C]-0.246181[/C][C]-3.9924[/C][C]4.2e-05[/C][/ROW]
[ROW][C]5[/C][C]0.230208[/C][C]3.7333[/C][C]0.000116[/C][/ROW]
[ROW][C]6[/C][C]-0.165454[/C][C]-2.6832[/C][C]0.003877[/C][/ROW]
[ROW][C]7[/C][C]0.042588[/C][C]0.6907[/C][C]0.245194[/C][/ROW]
[ROW][C]8[/C][C]0.103505[/C][C]1.6786[/C][C]0.047212[/C][/ROW]
[ROW][C]9[/C][C]-0.200313[/C][C]-3.2485[/C][C]0.000655[/C][/ROW]
[ROW][C]10[/C][C]0.212409[/C][C]3.4447[/C][C]0.000333[/C][/ROW]
[ROW][C]11[/C][C]-0.193788[/C][C]-3.1427[/C][C]0.000933[/C][/ROW]
[ROW][C]12[/C][C]0.093023[/C][C]1.5086[/C][C]0.066303[/C][/ROW]
[ROW][C]13[/C][C]0.113158[/C][C]1.8351[/C][C]0.033809[/C][/ROW]
[ROW][C]14[/C][C]-0.284778[/C][C]-4.6183[/C][C]3e-06[/C][/ROW]
[ROW][C]15[/C][C]0.223284[/C][C]3.6211[/C][C]0.000176[/C][/ROW]
[ROW][C]16[/C][C]-0.134962[/C][C]-2.1887[/C][C]0.014748[/C][/ROW]
[ROW][C]17[/C][C]0.117546[/C][C]1.9063[/C][C]0.028853[/C][/ROW]
[ROW][C]18[/C][C]-0.009786[/C][C]-0.1587[/C][C]0.437014[/C][/ROW]
[ROW][C]19[/C][C]-0.088468[/C][C]-1.4347[/C][C]0.076279[/C][/ROW]
[ROW][C]20[/C][C]0.195165[/C][C]3.165[/C][C]0.000867[/C][/ROW]
[ROW][C]21[/C][C]-0.215621[/C][C]-3.4968[/C][C]0.000276[/C][/ROW]
[ROW][C]22[/C][C]0.067647[/C][C]1.0971[/C][C]0.136811[/C][/ROW]
[ROW][C]23[/C][C]0.053216[/C][C]0.863[/C][C]0.194455[/C][/ROW]
[ROW][C]24[/C][C]-0.179253[/C][C]-2.907[/C][C]0.00198[/C][/ROW]
[ROW][C]25[/C][C]0.320512[/C][C]5.1978[/C][C]0[/C][/ROW]
[ROW][C]26[/C][C]-0.300056[/C][C]-4.8661[/C][C]1e-06[/C][/ROW]
[ROW][C]27[/C][C]0.146433[/C][C]2.3747[/C][C]0.009139[/C][/ROW]
[ROW][C]28[/C][C]0.060494[/C][C]0.9811[/C][C]0.163734[/C][/ROW]
[ROW][C]29[/C][C]-0.15923[/C][C]-2.5823[/C][C]0.005178[/C][/ROW]
[ROW][C]30[/C][C]0.141897[/C][C]2.3012[/C][C]0.011082[/C][/ROW]
[ROW][C]31[/C][C]-0.147847[/C][C]-2.3977[/C][C]0.008598[/C][/ROW]
[ROW][C]32[/C][C]0.110183[/C][C]1.7869[/C][C]0.037556[/C][/ROW]
[ROW][C]33[/C][C]-0.015537[/C][C]-0.252[/C][C]0.400631[/C][/ROW]
[ROW][C]34[/C][C]-0.11423[/C][C]-1.8525[/C][C]0.032537[/C][/ROW]
[ROW][C]35[/C][C]0.180501[/C][C]2.9272[/C][C]0.00186[/C][/ROW]
[ROW][C]36[/C][C]-0.157537[/C][C]-2.5548[/C][C]0.005594[/C][/ROW]
[ROW][C]37[/C][C]0.129763[/C][C]2.1044[/C][C]0.018147[/C][/ROW]
[ROW][C]38[/C][C]-0.054994[/C][C]-0.8919[/C][C]0.186642[/C][/ROW]
[ROW][C]39[/C][C]-0.119794[/C][C]-1.9427[/C][C]0.026558[/C][/ROW]
[ROW][C]40[/C][C]0.201724[/C][C]3.2714[/C][C]0.000607[/C][/ROW]
[ROW][C]41[/C][C]-0.173833[/C][C]-2.8191[/C][C]0.002591[/C][/ROW]
[ROW][C]42[/C][C]0.070839[/C][C]1.1488[/C][C]0.125839[/C][/ROW]
[ROW][C]43[/C][C]0.003367[/C][C]0.0546[/C][C]0.478248[/C][/ROW]
[ROW][C]44[/C][C]0.028457[/C][C]0.4615[/C][C]0.322413[/C][/ROW]
[ROW][C]45[/C][C]0.0759[/C][C]1.2309[/C][C]0.109733[/C][/ROW]
[ROW][C]46[/C][C]-0.135793[/C][C]-2.2022[/C][C]0.01426[/C][/ROW]
[ROW][C]47[/C][C]0.141885[/C][C]2.301[/C][C]0.011087[/C][/ROW]
[ROW][C]48[/C][C]-0.077743[/C][C]-1.2608[/C][C]0.104253[/C][/ROW]
[/TABLE]
Source: https://freestatistics.org/blog/index.php?pk=40112&T=1

Globally Unique Identifier (entire table): ba.freestatistics.org/blog/index.php?pk=40112&T=1

As an alternative you can also use a QR Code:  

The GUIDs for individual cells are displayed in the table below:

Autocorrelation Function
Time lag kACF(k)T-STATP-value
1-0.506177-8.20880
20.0205340.3330.369699
30.1147371.86070.03195
4-0.246181-3.99244.2e-05
50.2302083.73330.000116
6-0.165454-2.68320.003877
70.0425880.69070.245194
80.1035051.67860.047212
9-0.200313-3.24850.000655
100.2124093.44470.000333
11-0.193788-3.14270.000933
120.0930231.50860.066303
130.1131581.83510.033809
14-0.284778-4.61833e-06
150.2232843.62110.000176
16-0.134962-2.18870.014748
170.1175461.90630.028853
18-0.009786-0.15870.437014
19-0.088468-1.43470.076279
200.1951653.1650.000867
21-0.215621-3.49680.000276
220.0676471.09710.136811
230.0532160.8630.194455
24-0.179253-2.9070.00198
250.3205125.19780
26-0.300056-4.86611e-06
270.1464332.37470.009139
280.0604940.98110.163734
29-0.15923-2.58230.005178
300.1418972.30120.011082
31-0.147847-2.39770.008598
320.1101831.78690.037556
33-0.015537-0.2520.400631
34-0.11423-1.85250.032537
350.1805012.92720.00186
36-0.157537-2.55480.005594
370.1297632.10440.018147
38-0.054994-0.89190.186642
39-0.119794-1.94270.026558
400.2017243.27140.000607
41-0.173833-2.81910.002591
420.0708391.14880.125839
430.0033670.05460.478248
440.0284570.46150.322413
450.07591.23090.109733
46-0.135793-2.20220.01426
470.1418852.3010.011087
48-0.077743-1.26080.104253


Partial Autocorrelation Function
Time lag kPACF(k)T-STATP-value
1-0.506177-8.20880
2-0.316867-5.13870
3-0.047776-0.77480.21958
4-0.277101-4.49385e-06
5-0.040855-0.66250.2541
6-0.162598-2.63690.004432
7-0.113012-1.83280.033985
8-0.005319-0.08630.465665
9-0.148615-2.41010.008317
100.006520.10570.457933
11-0.164193-2.66280.004114
12-0.06407-1.0390.149869
130.0642891.04260.149047
14-0.180871-2.93320.001825
15-0.123226-1.99840.023352
16-0.186731-3.02830.001352
170.0115490.18730.425785
18-0.089307-1.44830.07436
19-0.051129-0.82920.203881
200.0646511.04850.147693
21-0.0597-0.96820.166923
22-0.07173-1.16330.122889
23-0.057417-0.93110.176318
24-0.166161-2.69470.00375
250.0806341.30770.096065
26-0.120745-1.95820.025634
270.0023310.03780.484938
280.0257690.41790.338177
290.0378260.61340.27006
30-0.042875-0.69530.243736
31-0.03009-0.4880.312987
320.0240510.390.348411
33-0.038243-0.62020.267831
34-0.035096-0.56920.284868
35-0.030125-0.48850.312787
36-0.065128-1.05620.145923
370.0294150.4770.316866
38-0.078375-1.2710.10242
39-0.087347-1.41650.078901
40-0.08539-1.38480.083646
41-0.081359-1.31940.094089
42-0.165039-2.67650.003954
43-0.178833-2.90020.002022
44-0.042304-0.68610.246641
45-0.074049-1.20090.11544
46-0.025544-0.41430.33951
470.0714661.1590.123756
480.0163770.26560.395378

\begin{tabular}{lllllllll}
\hline
Partial Autocorrelation Function \tabularnewline
Time lag k & PACF(k) & T-STAT & P-value \tabularnewline
1 & -0.506177 & -8.2088 & 0 \tabularnewline
2 & -0.316867 & -5.1387 & 0 \tabularnewline
3 & -0.047776 & -0.7748 & 0.21958 \tabularnewline
4 & -0.277101 & -4.4938 & 5e-06 \tabularnewline
5 & -0.040855 & -0.6625 & 0.2541 \tabularnewline
6 & -0.162598 & -2.6369 & 0.004432 \tabularnewline
7 & -0.113012 & -1.8328 & 0.033985 \tabularnewline
8 & -0.005319 & -0.0863 & 0.465665 \tabularnewline
9 & -0.148615 & -2.4101 & 0.008317 \tabularnewline
10 & 0.00652 & 0.1057 & 0.457933 \tabularnewline
11 & -0.164193 & -2.6628 & 0.004114 \tabularnewline
12 & -0.06407 & -1.039 & 0.149869 \tabularnewline
13 & 0.064289 & 1.0426 & 0.149047 \tabularnewline
14 & -0.180871 & -2.9332 & 0.001825 \tabularnewline
15 & -0.123226 & -1.9984 & 0.023352 \tabularnewline
16 & -0.186731 & -3.0283 & 0.001352 \tabularnewline
17 & 0.011549 & 0.1873 & 0.425785 \tabularnewline
18 & -0.089307 & -1.4483 & 0.07436 \tabularnewline
19 & -0.051129 & -0.8292 & 0.203881 \tabularnewline
20 & 0.064651 & 1.0485 & 0.147693 \tabularnewline
21 & -0.0597 & -0.9682 & 0.166923 \tabularnewline
22 & -0.07173 & -1.1633 & 0.122889 \tabularnewline
23 & -0.057417 & -0.9311 & 0.176318 \tabularnewline
24 & -0.166161 & -2.6947 & 0.00375 \tabularnewline
25 & 0.080634 & 1.3077 & 0.096065 \tabularnewline
26 & -0.120745 & -1.9582 & 0.025634 \tabularnewline
27 & 0.002331 & 0.0378 & 0.484938 \tabularnewline
28 & 0.025769 & 0.4179 & 0.338177 \tabularnewline
29 & 0.037826 & 0.6134 & 0.27006 \tabularnewline
30 & -0.042875 & -0.6953 & 0.243736 \tabularnewline
31 & -0.03009 & -0.488 & 0.312987 \tabularnewline
32 & 0.024051 & 0.39 & 0.348411 \tabularnewline
33 & -0.038243 & -0.6202 & 0.267831 \tabularnewline
34 & -0.035096 & -0.5692 & 0.284868 \tabularnewline
35 & -0.030125 & -0.4885 & 0.312787 \tabularnewline
36 & -0.065128 & -1.0562 & 0.145923 \tabularnewline
37 & 0.029415 & 0.477 & 0.316866 \tabularnewline
38 & -0.078375 & -1.271 & 0.10242 \tabularnewline
39 & -0.087347 & -1.4165 & 0.078901 \tabularnewline
40 & -0.08539 & -1.3848 & 0.083646 \tabularnewline
41 & -0.081359 & -1.3194 & 0.094089 \tabularnewline
42 & -0.165039 & -2.6765 & 0.003954 \tabularnewline
43 & -0.178833 & -2.9002 & 0.002022 \tabularnewline
44 & -0.042304 & -0.6861 & 0.246641 \tabularnewline
45 & -0.074049 & -1.2009 & 0.11544 \tabularnewline
46 & -0.025544 & -0.4143 & 0.33951 \tabularnewline
47 & 0.071466 & 1.159 & 0.123756 \tabularnewline
48 & 0.016377 & 0.2656 & 0.395378 \tabularnewline
\hline
\end{tabular}
%Source: https://freestatistics.org/blog/index.php?pk=40112&T=2

[TABLE]
[ROW][C]Partial Autocorrelation Function[/C][/ROW]
[ROW][C]Time lag k[/C][C]PACF(k)[/C][C]T-STAT[/C][C]P-value[/C][/ROW]
[ROW][C]1[/C][C]-0.506177[/C][C]-8.2088[/C][C]0[/C][/ROW]
[ROW][C]2[/C][C]-0.316867[/C][C]-5.1387[/C][C]0[/C][/ROW]
[ROW][C]3[/C][C]-0.047776[/C][C]-0.7748[/C][C]0.21958[/C][/ROW]
[ROW][C]4[/C][C]-0.277101[/C][C]-4.4938[/C][C]5e-06[/C][/ROW]
[ROW][C]5[/C][C]-0.040855[/C][C]-0.6625[/C][C]0.2541[/C][/ROW]
[ROW][C]6[/C][C]-0.162598[/C][C]-2.6369[/C][C]0.004432[/C][/ROW]
[ROW][C]7[/C][C]-0.113012[/C][C]-1.8328[/C][C]0.033985[/C][/ROW]
[ROW][C]8[/C][C]-0.005319[/C][C]-0.0863[/C][C]0.465665[/C][/ROW]
[ROW][C]9[/C][C]-0.148615[/C][C]-2.4101[/C][C]0.008317[/C][/ROW]
[ROW][C]10[/C][C]0.00652[/C][C]0.1057[/C][C]0.457933[/C][/ROW]
[ROW][C]11[/C][C]-0.164193[/C][C]-2.6628[/C][C]0.004114[/C][/ROW]
[ROW][C]12[/C][C]-0.06407[/C][C]-1.039[/C][C]0.149869[/C][/ROW]
[ROW][C]13[/C][C]0.064289[/C][C]1.0426[/C][C]0.149047[/C][/ROW]
[ROW][C]14[/C][C]-0.180871[/C][C]-2.9332[/C][C]0.001825[/C][/ROW]
[ROW][C]15[/C][C]-0.123226[/C][C]-1.9984[/C][C]0.023352[/C][/ROW]
[ROW][C]16[/C][C]-0.186731[/C][C]-3.0283[/C][C]0.001352[/C][/ROW]
[ROW][C]17[/C][C]0.011549[/C][C]0.1873[/C][C]0.425785[/C][/ROW]
[ROW][C]18[/C][C]-0.089307[/C][C]-1.4483[/C][C]0.07436[/C][/ROW]
[ROW][C]19[/C][C]-0.051129[/C][C]-0.8292[/C][C]0.203881[/C][/ROW]
[ROW][C]20[/C][C]0.064651[/C][C]1.0485[/C][C]0.147693[/C][/ROW]
[ROW][C]21[/C][C]-0.0597[/C][C]-0.9682[/C][C]0.166923[/C][/ROW]
[ROW][C]22[/C][C]-0.07173[/C][C]-1.1633[/C][C]0.122889[/C][/ROW]
[ROW][C]23[/C][C]-0.057417[/C][C]-0.9311[/C][C]0.176318[/C][/ROW]
[ROW][C]24[/C][C]-0.166161[/C][C]-2.6947[/C][C]0.00375[/C][/ROW]
[ROW][C]25[/C][C]0.080634[/C][C]1.3077[/C][C]0.096065[/C][/ROW]
[ROW][C]26[/C][C]-0.120745[/C][C]-1.9582[/C][C]0.025634[/C][/ROW]
[ROW][C]27[/C][C]0.002331[/C][C]0.0378[/C][C]0.484938[/C][/ROW]
[ROW][C]28[/C][C]0.025769[/C][C]0.4179[/C][C]0.338177[/C][/ROW]
[ROW][C]29[/C][C]0.037826[/C][C]0.6134[/C][C]0.27006[/C][/ROW]
[ROW][C]30[/C][C]-0.042875[/C][C]-0.6953[/C][C]0.243736[/C][/ROW]
[ROW][C]31[/C][C]-0.03009[/C][C]-0.488[/C][C]0.312987[/C][/ROW]
[ROW][C]32[/C][C]0.024051[/C][C]0.39[/C][C]0.348411[/C][/ROW]
[ROW][C]33[/C][C]-0.038243[/C][C]-0.6202[/C][C]0.267831[/C][/ROW]
[ROW][C]34[/C][C]-0.035096[/C][C]-0.5692[/C][C]0.284868[/C][/ROW]
[ROW][C]35[/C][C]-0.030125[/C][C]-0.4885[/C][C]0.312787[/C][/ROW]
[ROW][C]36[/C][C]-0.065128[/C][C]-1.0562[/C][C]0.145923[/C][/ROW]
[ROW][C]37[/C][C]0.029415[/C][C]0.477[/C][C]0.316866[/C][/ROW]
[ROW][C]38[/C][C]-0.078375[/C][C]-1.271[/C][C]0.10242[/C][/ROW]
[ROW][C]39[/C][C]-0.087347[/C][C]-1.4165[/C][C]0.078901[/C][/ROW]
[ROW][C]40[/C][C]-0.08539[/C][C]-1.3848[/C][C]0.083646[/C][/ROW]
[ROW][C]41[/C][C]-0.081359[/C][C]-1.3194[/C][C]0.094089[/C][/ROW]
[ROW][C]42[/C][C]-0.165039[/C][C]-2.6765[/C][C]0.003954[/C][/ROW]
[ROW][C]43[/C][C]-0.178833[/C][C]-2.9002[/C][C]0.002022[/C][/ROW]
[ROW][C]44[/C][C]-0.042304[/C][C]-0.6861[/C][C]0.246641[/C][/ROW]
[ROW][C]45[/C][C]-0.074049[/C][C]-1.2009[/C][C]0.11544[/C][/ROW]
[ROW][C]46[/C][C]-0.025544[/C][C]-0.4143[/C][C]0.33951[/C][/ROW]
[ROW][C]47[/C][C]0.071466[/C][C]1.159[/C][C]0.123756[/C][/ROW]
[ROW][C]48[/C][C]0.016377[/C][C]0.2656[/C][C]0.395378[/C][/ROW]
[/TABLE]
Source: https://freestatistics.org/blog/index.php?pk=40112&T=2

Globally Unique Identifier (entire table): ba.freestatistics.org/blog/index.php?pk=40112&T=2

As an alternative you can also use a QR Code:  

The GUIDs for individual cells are displayed in the table below:

Partial Autocorrelation Function
Time lag kPACF(k)T-STATP-value
1-0.506177-8.20880
2-0.316867-5.13870
3-0.047776-0.77480.21958
4-0.277101-4.49385e-06
5-0.040855-0.66250.2541
6-0.162598-2.63690.004432
7-0.113012-1.83280.033985
8-0.005319-0.08630.465665
9-0.148615-2.41010.008317
100.006520.10570.457933
11-0.164193-2.66280.004114
12-0.06407-1.0390.149869
130.0642891.04260.149047
14-0.180871-2.93320.001825
15-0.123226-1.99840.023352
16-0.186731-3.02830.001352
170.0115490.18730.425785
18-0.089307-1.44830.07436
19-0.051129-0.82920.203881
200.0646511.04850.147693
21-0.0597-0.96820.166923
22-0.07173-1.16330.122889
23-0.057417-0.93110.176318
24-0.166161-2.69470.00375
250.0806341.30770.096065
26-0.120745-1.95820.025634
270.0023310.03780.484938
280.0257690.41790.338177
290.0378260.61340.27006
30-0.042875-0.69530.243736
31-0.03009-0.4880.312987
320.0240510.390.348411
33-0.038243-0.62020.267831
34-0.035096-0.56920.284868
35-0.030125-0.48850.312787
36-0.065128-1.05620.145923
370.0294150.4770.316866
38-0.078375-1.2710.10242
39-0.087347-1.41650.078901
40-0.08539-1.38480.083646
41-0.081359-1.31940.094089
42-0.165039-2.67650.003954
43-0.178833-2.90020.002022
44-0.042304-0.68610.246641
45-0.074049-1.20090.11544
46-0.025544-0.41430.33951
470.0714661.1590.123756
480.0163770.26560.395378


Parameters (Session):
par1 = 48 ; par2 = 1 ; par3 = 1 ; par4 = 0 ; par5 = 12 ;
Parameters (R input):
par1 = 48 ; par2 = 1 ; par3 = 1 ; par4 = 0 ; par5 = 12 ;
R code (references can be found in the software module):
if (par1 == 'Default') {
par1 = 10*log10(length(x))
} else {
par1 <- as.numeric(par1)
}
par2 <- as.numeric(par2)
par3 <- as.numeric(par3)
par4 <- as.numeric(par4)
par5 <- as.numeric(par5)
if (par2 == 0) {
x <- log(x)
} else {
x <- (x ^ par2 - 1) / par2
}
if (par3 > 0) x <- diff(x,lag=1,difference=par3)
if (par4 > 0) x <- diff(x,lag=par5,difference=par4)
bitmap(file='pic1.png')
racf <- acf(x,par1,main='Autocorrelation',xlab='lags',ylab='ACF')
dev.off()
bitmap(file='pic2.png')
rpacf <- pacf(x,par1,main='Partial Autocorrelation',xlab='lags',ylab='PACF')
dev.off()
(myacf <- c(racf$acf))
(mypacf <- c(rpacf$acf))
lengthx <- length(x)
sqrtn <- sqrt(lengthx)
load(file='createtable')
a<-table.start()
a<-table.row.start(a)
a<-table.element(a,'Autocorrelation Function',4,TRUE)
a<-table.row.end(a)
a<-table.row.start(a)
a<-table.element(a,'Time lag k',header=TRUE)
a<-table.element(a,hyperlink('basics.htm','ACF(k)','click here for more information about the Autocorrelation Function'),header=TRUE)
a<-table.element(a,'T-STAT',header=TRUE)
a<-table.element(a,'P-value',header=TRUE)
a<-table.row.end(a)
for (i in 2:(par1+1)) {
a<-table.row.start(a)
a<-table.element(a,i-1,header=TRUE)
a<-table.element(a,round(myacf[i],6))
mytstat <- myacf[i]*sqrtn
a<-table.element(a,round(mytstat,4))
a<-table.element(a,round(1-pt(abs(mytstat),lengthx),6))
a<-table.row.end(a)
}
a<-table.end(a)
table.save(a,file='mytable.tab')
a<-table.start()
a<-table.row.start(a)
a<-table.element(a,'Partial Autocorrelation Function',4,TRUE)
a<-table.row.end(a)
a<-table.row.start(a)
a<-table.element(a,'Time lag k',header=TRUE)
a<-table.element(a,hyperlink('basics.htm','PACF(k)','click here for more information about the Partial Autocorrelation Function'),header=TRUE)
a<-table.element(a,'T-STAT',header=TRUE)
a<-table.element(a,'P-value',header=TRUE)
a<-table.row.end(a)
for (i in 1:par1) {
a<-table.row.start(a)
a<-table.element(a,i,header=TRUE)
a<-table.element(a,round(mypacf[i],6))
mytstat <- mypacf[i]*sqrtn
a<-table.element(a,round(mytstat,4))
a<-table.element(a,round(1-pt(abs(mytstat),lengthx),6))
a<-table.row.end(a)
}
a<-table.end(a)
table.save(a,file='mytable1.tab')