Free Statistics

of Irreproducible Research!

Author's title

Author*Unverified author*
R Software Modulerwasp_autocorrelation.wasp
Title produced by software(Partial) Autocorrelation Function
Date of computationThu, 14 May 2009 15:42:24 -0600
Cite this page as followsStatistical Computations at FreeStatistics.org, Office for Research Development and Education, URL https://freestatistics.org/blog/index.php?v=date/2009/May/14/t12423373711u7s5htrzhttjcy.htm/, Retrieved Mon, 29 Apr 2024 00:54:23 +0000
Statistical Computations at FreeStatistics.org, Office for Research Development and Education, URL https://freestatistics.org/blog/index.php?pk=40111, Retrieved Mon, 29 Apr 2024 00:54:23 +0000
QR Codes:

Original text written by user:
IsPrivate?No (this computation is public)
User-defined keywords
Estimated Impact100
Family? (F = Feedback message, R = changed R code, M = changed R Module, P = changed Parameters, D = changed Data)
-       [(Partial) Autocorrelation Function] [Gabriels Wim Oef ...] [2009-05-14 21:42:24] [d41d8cd98f00b204e9800998ecf8427e] [Current]
Feedback Forum

Post a new message
Dataseries X:
374
572
402
589
507
628
698
451
694
0
488
526
343
494
447
0
470
366
517
483
485
530
308
481
437
468
502
408
479
436
410
451
344
411
0
427
454
365
499
416
430
470
325
452
442
488
446
523
594
439
588
503
444
525
375
472
436
458
514
0
472
360
450
549
361
466
387
457
470
396
471
422
404
414
342
459
379
0
410
319
411
371
365
429
333
392
469
432
534
379
436
448
358
492
387
529
475
439
459
361
0
0
394
425
341
455
403
471
523
389
531
468
398
446
355
435
353
0
400
332
389
355
384
406
356
336
351
278
265
229
387
435
317
490
472
440
429
350
489
494
436
436
375
429
0
434
472
362
440
433
400
442
316
432
401
434
488
377
484
377
0
0
300
389
337
376
377
331
339
356
280
249
196
268
379
401
404
397
419
421
407
296
468
475
422
456
339
446
419
346
327
326
403
359
358
421
322
367
394
356
418
344
372
358
373
379
0
348
369
341
390
279
325
354
346
358
296
356
337
360
474
362
440
443
435
429
341
434
329
416
430
307
408
322
0
324
303
369
328
258
372
298
376
306
359
418
311
355
335
345
318
291
340
0
356
419
296
361
371
392
383
286
362
358


Summary of computational transaction
Raw Inputview raw input (R code)
Raw Outputview raw output of R engine
Computing time5 seconds
R Server'George Udny Yule' @ 72.249.76.132

\begin{tabular}{lllllllll}
\hline
Summary of computational transaction \tabularnewline
Raw Input & view raw input (R code)  \tabularnewline
Raw Output & view raw output of R engine  \tabularnewline
Computing time & 5 seconds \tabularnewline
R Server & 'George Udny Yule' @ 72.249.76.132 \tabularnewline
\hline
\end{tabular}
%Source: https://freestatistics.org/blog/index.php?pk=40111&T=0

[TABLE]
[ROW][C]Summary of computational transaction[/C][/ROW]
[ROW][C]Raw Input[/C][C]view raw input (R code) [/C][/ROW]
[ROW][C]Raw Output[/C][C]view raw output of R engine [/C][/ROW]
[ROW][C]Computing time[/C][C]5 seconds[/C][/ROW]
[ROW][C]R Server[/C][C]'George Udny Yule' @ 72.249.76.132[/C][/ROW]
[/TABLE]
Source: https://freestatistics.org/blog/index.php?pk=40111&T=0

Globally Unique Identifier (entire table): ba.freestatistics.org/blog/index.php?pk=40111&T=0

As an alternative you can also use a QR Code:  

The GUIDs for individual cells are displayed in the table below:

Summary of computational transaction
Raw Inputview raw input (R code)
Raw Outputview raw output of R engine
Computing time5 seconds
R Server'George Udny Yule' @ 72.249.76.132


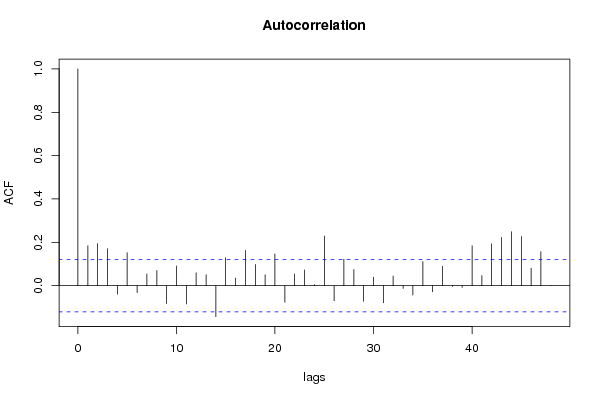
Autocorrelation Function
Time lag kACF(k)T-STATP-value
10.1837442.98550.001548
20.1942853.15680.00089
30.1702962.7670.003029
4-0.039773-0.64620.259342
50.1518382.46710.007129
6-0.032145-0.52230.30095
70.0540550.87830.190292
80.0695961.13080.129583
9-0.082272-1.33680.091227
100.0904951.47040.071326
11-0.084699-1.37620.084963
120.0589780.95830.169401
130.049960.81180.208831
14-0.143161-2.32610.010385
150.1286252.08990.018792
160.0346620.56320.286892
170.162422.6390.004405
180.0977071.58750.056793
190.0501470.81480.207961
200.1464742.37990.009013
21-0.076146-1.23720.108551
220.0538170.87440.191342
230.0721921.1730.120929
240.0047050.07650.469559
250.2288693.71870.000122
26-0.069553-1.13010.12973
270.1221931.98540.024067
280.0741821.20530.114581
29-0.072232-1.17360.1208
300.0388050.63050.264453
31-0.079527-1.29220.098717
320.0442030.71820.236629
33-0.012938-0.21020.416832
34-0.043648-0.70920.239415
350.1108871.80170.036367
36-0.028677-0.46590.320822
370.0897381.45810.073004
38-0.004571-0.07430.470426
39-0.008115-0.13190.447599
400.1836982.98470.001552
410.0463330.75280.226115
420.1928023.13270.000964
430.2226853.61820.000178
440.2482254.03323.6e-05
450.2264653.67960.000142
460.0807711.31240.095268
470.1567522.54690.005718
480.0009070.01470.494124

\begin{tabular}{lllllllll}
\hline
Autocorrelation Function \tabularnewline
Time lag k & ACF(k) & T-STAT & P-value \tabularnewline
1 & 0.183744 & 2.9855 & 0.001548 \tabularnewline
2 & 0.194285 & 3.1568 & 0.00089 \tabularnewline
3 & 0.170296 & 2.767 & 0.003029 \tabularnewline
4 & -0.039773 & -0.6462 & 0.259342 \tabularnewline
5 & 0.151838 & 2.4671 & 0.007129 \tabularnewline
6 & -0.032145 & -0.5223 & 0.30095 \tabularnewline
7 & 0.054055 & 0.8783 & 0.190292 \tabularnewline
8 & 0.069596 & 1.1308 & 0.129583 \tabularnewline
9 & -0.082272 & -1.3368 & 0.091227 \tabularnewline
10 & 0.090495 & 1.4704 & 0.071326 \tabularnewline
11 & -0.084699 & -1.3762 & 0.084963 \tabularnewline
12 & 0.058978 & 0.9583 & 0.169401 \tabularnewline
13 & 0.04996 & 0.8118 & 0.208831 \tabularnewline
14 & -0.143161 & -2.3261 & 0.010385 \tabularnewline
15 & 0.128625 & 2.0899 & 0.018792 \tabularnewline
16 & 0.034662 & 0.5632 & 0.286892 \tabularnewline
17 & 0.16242 & 2.639 & 0.004405 \tabularnewline
18 & 0.097707 & 1.5875 & 0.056793 \tabularnewline
19 & 0.050147 & 0.8148 & 0.207961 \tabularnewline
20 & 0.146474 & 2.3799 & 0.009013 \tabularnewline
21 & -0.076146 & -1.2372 & 0.108551 \tabularnewline
22 & 0.053817 & 0.8744 & 0.191342 \tabularnewline
23 & 0.072192 & 1.173 & 0.120929 \tabularnewline
24 & 0.004705 & 0.0765 & 0.469559 \tabularnewline
25 & 0.228869 & 3.7187 & 0.000122 \tabularnewline
26 & -0.069553 & -1.1301 & 0.12973 \tabularnewline
27 & 0.122193 & 1.9854 & 0.024067 \tabularnewline
28 & 0.074182 & 1.2053 & 0.114581 \tabularnewline
29 & -0.072232 & -1.1736 & 0.1208 \tabularnewline
30 & 0.038805 & 0.6305 & 0.264453 \tabularnewline
31 & -0.079527 & -1.2922 & 0.098717 \tabularnewline
32 & 0.044203 & 0.7182 & 0.236629 \tabularnewline
33 & -0.012938 & -0.2102 & 0.416832 \tabularnewline
34 & -0.043648 & -0.7092 & 0.239415 \tabularnewline
35 & 0.110887 & 1.8017 & 0.036367 \tabularnewline
36 & -0.028677 & -0.4659 & 0.320822 \tabularnewline
37 & 0.089738 & 1.4581 & 0.073004 \tabularnewline
38 & -0.004571 & -0.0743 & 0.470426 \tabularnewline
39 & -0.008115 & -0.1319 & 0.447599 \tabularnewline
40 & 0.183698 & 2.9847 & 0.001552 \tabularnewline
41 & 0.046333 & 0.7528 & 0.226115 \tabularnewline
42 & 0.192802 & 3.1327 & 0.000964 \tabularnewline
43 & 0.222685 & 3.6182 & 0.000178 \tabularnewline
44 & 0.248225 & 4.0332 & 3.6e-05 \tabularnewline
45 & 0.226465 & 3.6796 & 0.000142 \tabularnewline
46 & 0.080771 & 1.3124 & 0.095268 \tabularnewline
47 & 0.156752 & 2.5469 & 0.005718 \tabularnewline
48 & 0.000907 & 0.0147 & 0.494124 \tabularnewline
\hline
\end{tabular}
%Source: https://freestatistics.org/blog/index.php?pk=40111&T=1

[TABLE]
[ROW][C]Autocorrelation Function[/C][/ROW]
[ROW][C]Time lag k[/C][C]ACF(k)[/C][C]T-STAT[/C][C]P-value[/C][/ROW]
[ROW][C]1[/C][C]0.183744[/C][C]2.9855[/C][C]0.001548[/C][/ROW]
[ROW][C]2[/C][C]0.194285[/C][C]3.1568[/C][C]0.00089[/C][/ROW]
[ROW][C]3[/C][C]0.170296[/C][C]2.767[/C][C]0.003029[/C][/ROW]
[ROW][C]4[/C][C]-0.039773[/C][C]-0.6462[/C][C]0.259342[/C][/ROW]
[ROW][C]5[/C][C]0.151838[/C][C]2.4671[/C][C]0.007129[/C][/ROW]
[ROW][C]6[/C][C]-0.032145[/C][C]-0.5223[/C][C]0.30095[/C][/ROW]
[ROW][C]7[/C][C]0.054055[/C][C]0.8783[/C][C]0.190292[/C][/ROW]
[ROW][C]8[/C][C]0.069596[/C][C]1.1308[/C][C]0.129583[/C][/ROW]
[ROW][C]9[/C][C]-0.082272[/C][C]-1.3368[/C][C]0.091227[/C][/ROW]
[ROW][C]10[/C][C]0.090495[/C][C]1.4704[/C][C]0.071326[/C][/ROW]
[ROW][C]11[/C][C]-0.084699[/C][C]-1.3762[/C][C]0.084963[/C][/ROW]
[ROW][C]12[/C][C]0.058978[/C][C]0.9583[/C][C]0.169401[/C][/ROW]
[ROW][C]13[/C][C]0.04996[/C][C]0.8118[/C][C]0.208831[/C][/ROW]
[ROW][C]14[/C][C]-0.143161[/C][C]-2.3261[/C][C]0.010385[/C][/ROW]
[ROW][C]15[/C][C]0.128625[/C][C]2.0899[/C][C]0.018792[/C][/ROW]
[ROW][C]16[/C][C]0.034662[/C][C]0.5632[/C][C]0.286892[/C][/ROW]
[ROW][C]17[/C][C]0.16242[/C][C]2.639[/C][C]0.004405[/C][/ROW]
[ROW][C]18[/C][C]0.097707[/C][C]1.5875[/C][C]0.056793[/C][/ROW]
[ROW][C]19[/C][C]0.050147[/C][C]0.8148[/C][C]0.207961[/C][/ROW]
[ROW][C]20[/C][C]0.146474[/C][C]2.3799[/C][C]0.009013[/C][/ROW]
[ROW][C]21[/C][C]-0.076146[/C][C]-1.2372[/C][C]0.108551[/C][/ROW]
[ROW][C]22[/C][C]0.053817[/C][C]0.8744[/C][C]0.191342[/C][/ROW]
[ROW][C]23[/C][C]0.072192[/C][C]1.173[/C][C]0.120929[/C][/ROW]
[ROW][C]24[/C][C]0.004705[/C][C]0.0765[/C][C]0.469559[/C][/ROW]
[ROW][C]25[/C][C]0.228869[/C][C]3.7187[/C][C]0.000122[/C][/ROW]
[ROW][C]26[/C][C]-0.069553[/C][C]-1.1301[/C][C]0.12973[/C][/ROW]
[ROW][C]27[/C][C]0.122193[/C][C]1.9854[/C][C]0.024067[/C][/ROW]
[ROW][C]28[/C][C]0.074182[/C][C]1.2053[/C][C]0.114581[/C][/ROW]
[ROW][C]29[/C][C]-0.072232[/C][C]-1.1736[/C][C]0.1208[/C][/ROW]
[ROW][C]30[/C][C]0.038805[/C][C]0.6305[/C][C]0.264453[/C][/ROW]
[ROW][C]31[/C][C]-0.079527[/C][C]-1.2922[/C][C]0.098717[/C][/ROW]
[ROW][C]32[/C][C]0.044203[/C][C]0.7182[/C][C]0.236629[/C][/ROW]
[ROW][C]33[/C][C]-0.012938[/C][C]-0.2102[/C][C]0.416832[/C][/ROW]
[ROW][C]34[/C][C]-0.043648[/C][C]-0.7092[/C][C]0.239415[/C][/ROW]
[ROW][C]35[/C][C]0.110887[/C][C]1.8017[/C][C]0.036367[/C][/ROW]
[ROW][C]36[/C][C]-0.028677[/C][C]-0.4659[/C][C]0.320822[/C][/ROW]
[ROW][C]37[/C][C]0.089738[/C][C]1.4581[/C][C]0.073004[/C][/ROW]
[ROW][C]38[/C][C]-0.004571[/C][C]-0.0743[/C][C]0.470426[/C][/ROW]
[ROW][C]39[/C][C]-0.008115[/C][C]-0.1319[/C][C]0.447599[/C][/ROW]
[ROW][C]40[/C][C]0.183698[/C][C]2.9847[/C][C]0.001552[/C][/ROW]
[ROW][C]41[/C][C]0.046333[/C][C]0.7528[/C][C]0.226115[/C][/ROW]
[ROW][C]42[/C][C]0.192802[/C][C]3.1327[/C][C]0.000964[/C][/ROW]
[ROW][C]43[/C][C]0.222685[/C][C]3.6182[/C][C]0.000178[/C][/ROW]
[ROW][C]44[/C][C]0.248225[/C][C]4.0332[/C][C]3.6e-05[/C][/ROW]
[ROW][C]45[/C][C]0.226465[/C][C]3.6796[/C][C]0.000142[/C][/ROW]
[ROW][C]46[/C][C]0.080771[/C][C]1.3124[/C][C]0.095268[/C][/ROW]
[ROW][C]47[/C][C]0.156752[/C][C]2.5469[/C][C]0.005718[/C][/ROW]
[ROW][C]48[/C][C]0.000907[/C][C]0.0147[/C][C]0.494124[/C][/ROW]
[/TABLE]
Source: https://freestatistics.org/blog/index.php?pk=40111&T=1

Globally Unique Identifier (entire table): ba.freestatistics.org/blog/index.php?pk=40111&T=1

As an alternative you can also use a QR Code:  

The GUIDs for individual cells are displayed in the table below:

Autocorrelation Function
Time lag kACF(k)T-STATP-value
10.1837442.98550.001548
20.1942853.15680.00089
30.1702962.7670.003029
4-0.039773-0.64620.259342
50.1518382.46710.007129
6-0.032145-0.52230.30095
70.0540550.87830.190292
80.0695961.13080.129583
9-0.082272-1.33680.091227
100.0904951.47040.071326
11-0.084699-1.37620.084963
120.0589780.95830.169401
130.049960.81180.208831
14-0.143161-2.32610.010385
150.1286252.08990.018792
160.0346620.56320.286892
170.162422.6390.004405
180.0977071.58750.056793
190.0501470.81480.207961
200.1464742.37990.009013
21-0.076146-1.23720.108551
220.0538170.87440.191342
230.0721921.1730.120929
240.0047050.07650.469559
250.2288693.71870.000122
26-0.069553-1.13010.12973
270.1221931.98540.024067
280.0741821.20530.114581
29-0.072232-1.17360.1208
300.0388050.63050.264453
31-0.079527-1.29220.098717
320.0442030.71820.236629
33-0.012938-0.21020.416832
34-0.043648-0.70920.239415
350.1108871.80170.036367
36-0.028677-0.46590.320822
370.0897381.45810.073004
38-0.004571-0.07430.470426
39-0.008115-0.13190.447599
400.1836982.98470.001552
410.0463330.75280.226115
420.1928023.13270.000964
430.2226853.61820.000178
440.2482254.03323.6e-05
450.2264653.67960.000142
460.0807711.31240.095268
470.1567522.54690.005718
480.0009070.01470.494124


Partial Autocorrelation Function
Time lag kPACF(k)T-STATP-value
10.1837442.98550.001548
20.1661322.69930.003698
30.1170771.90230.029112
4-0.121786-1.97880.02444
50.1378852.24040.01295
6-0.075713-1.23020.10986
70.0568330.92340.178316
80.0239930.38980.348486
9-0.080397-1.30630.096294
100.0676551.09930.136326
11-0.085087-1.38250.083993
120.0930371.51170.065907
130.0039760.06460.474268
14-0.128556-2.08880.018842
150.1207221.96150.025436
160.075191.22170.111456
170.1496652.43180.007845
18-0.043411-0.70530.240609
190.0595470.96750.167085
200.024380.39610.346165
21-0.093109-1.51280.065759
220.029890.48570.313806
230.045210.73460.231623
240.0325290.52850.298788
250.1441982.34290.009938
26-0.10042-1.63160.051974
270.1019491.65650.049407
28-0.018654-0.30310.381028
29-0.044384-0.72120.235725
30-0.059705-0.97010.166443
310.0215240.34970.363411
320.0098790.16050.436301
33-0.043429-0.70560.240518
340.0179770.29210.385224
350.0167080.27150.39312
360.0121030.19660.422129
370.0484140.78660.216101
38-0.044726-0.72670.234024
390.0627691.01990.154359
400.074641.21280.113154
410.0743341.20780.114107
420.0722251.17350.120824
430.1570922.55240.00563
440.1708072.77530.002955
450.0349820.56840.285124
460.0662581.07660.141328
470.0182540.29660.383504
48-0.078963-1.2830.10031

\begin{tabular}{lllllllll}
\hline
Partial Autocorrelation Function \tabularnewline
Time lag k & PACF(k) & T-STAT & P-value \tabularnewline
1 & 0.183744 & 2.9855 & 0.001548 \tabularnewline
2 & 0.166132 & 2.6993 & 0.003698 \tabularnewline
3 & 0.117077 & 1.9023 & 0.029112 \tabularnewline
4 & -0.121786 & -1.9788 & 0.02444 \tabularnewline
5 & 0.137885 & 2.2404 & 0.01295 \tabularnewline
6 & -0.075713 & -1.2302 & 0.10986 \tabularnewline
7 & 0.056833 & 0.9234 & 0.178316 \tabularnewline
8 & 0.023993 & 0.3898 & 0.348486 \tabularnewline
9 & -0.080397 & -1.3063 & 0.096294 \tabularnewline
10 & 0.067655 & 1.0993 & 0.136326 \tabularnewline
11 & -0.085087 & -1.3825 & 0.083993 \tabularnewline
12 & 0.093037 & 1.5117 & 0.065907 \tabularnewline
13 & 0.003976 & 0.0646 & 0.474268 \tabularnewline
14 & -0.128556 & -2.0888 & 0.018842 \tabularnewline
15 & 0.120722 & 1.9615 & 0.025436 \tabularnewline
16 & 0.07519 & 1.2217 & 0.111456 \tabularnewline
17 & 0.149665 & 2.4318 & 0.007845 \tabularnewline
18 & -0.043411 & -0.7053 & 0.240609 \tabularnewline
19 & 0.059547 & 0.9675 & 0.167085 \tabularnewline
20 & 0.02438 & 0.3961 & 0.346165 \tabularnewline
21 & -0.093109 & -1.5128 & 0.065759 \tabularnewline
22 & 0.02989 & 0.4857 & 0.313806 \tabularnewline
23 & 0.04521 & 0.7346 & 0.231623 \tabularnewline
24 & 0.032529 & 0.5285 & 0.298788 \tabularnewline
25 & 0.144198 & 2.3429 & 0.009938 \tabularnewline
26 & -0.10042 & -1.6316 & 0.051974 \tabularnewline
27 & 0.101949 & 1.6565 & 0.049407 \tabularnewline
28 & -0.018654 & -0.3031 & 0.381028 \tabularnewline
29 & -0.044384 & -0.7212 & 0.235725 \tabularnewline
30 & -0.059705 & -0.9701 & 0.166443 \tabularnewline
31 & 0.021524 & 0.3497 & 0.363411 \tabularnewline
32 & 0.009879 & 0.1605 & 0.436301 \tabularnewline
33 & -0.043429 & -0.7056 & 0.240518 \tabularnewline
34 & 0.017977 & 0.2921 & 0.385224 \tabularnewline
35 & 0.016708 & 0.2715 & 0.39312 \tabularnewline
36 & 0.012103 & 0.1966 & 0.422129 \tabularnewline
37 & 0.048414 & 0.7866 & 0.216101 \tabularnewline
38 & -0.044726 & -0.7267 & 0.234024 \tabularnewline
39 & 0.062769 & 1.0199 & 0.154359 \tabularnewline
40 & 0.07464 & 1.2128 & 0.113154 \tabularnewline
41 & 0.074334 & 1.2078 & 0.114107 \tabularnewline
42 & 0.072225 & 1.1735 & 0.120824 \tabularnewline
43 & 0.157092 & 2.5524 & 0.00563 \tabularnewline
44 & 0.170807 & 2.7753 & 0.002955 \tabularnewline
45 & 0.034982 & 0.5684 & 0.285124 \tabularnewline
46 & 0.066258 & 1.0766 & 0.141328 \tabularnewline
47 & 0.018254 & 0.2966 & 0.383504 \tabularnewline
48 & -0.078963 & -1.283 & 0.10031 \tabularnewline
\hline
\end{tabular}
%Source: https://freestatistics.org/blog/index.php?pk=40111&T=2

[TABLE]
[ROW][C]Partial Autocorrelation Function[/C][/ROW]
[ROW][C]Time lag k[/C][C]PACF(k)[/C][C]T-STAT[/C][C]P-value[/C][/ROW]
[ROW][C]1[/C][C]0.183744[/C][C]2.9855[/C][C]0.001548[/C][/ROW]
[ROW][C]2[/C][C]0.166132[/C][C]2.6993[/C][C]0.003698[/C][/ROW]
[ROW][C]3[/C][C]0.117077[/C][C]1.9023[/C][C]0.029112[/C][/ROW]
[ROW][C]4[/C][C]-0.121786[/C][C]-1.9788[/C][C]0.02444[/C][/ROW]
[ROW][C]5[/C][C]0.137885[/C][C]2.2404[/C][C]0.01295[/C][/ROW]
[ROW][C]6[/C][C]-0.075713[/C][C]-1.2302[/C][C]0.10986[/C][/ROW]
[ROW][C]7[/C][C]0.056833[/C][C]0.9234[/C][C]0.178316[/C][/ROW]
[ROW][C]8[/C][C]0.023993[/C][C]0.3898[/C][C]0.348486[/C][/ROW]
[ROW][C]9[/C][C]-0.080397[/C][C]-1.3063[/C][C]0.096294[/C][/ROW]
[ROW][C]10[/C][C]0.067655[/C][C]1.0993[/C][C]0.136326[/C][/ROW]
[ROW][C]11[/C][C]-0.085087[/C][C]-1.3825[/C][C]0.083993[/C][/ROW]
[ROW][C]12[/C][C]0.093037[/C][C]1.5117[/C][C]0.065907[/C][/ROW]
[ROW][C]13[/C][C]0.003976[/C][C]0.0646[/C][C]0.474268[/C][/ROW]
[ROW][C]14[/C][C]-0.128556[/C][C]-2.0888[/C][C]0.018842[/C][/ROW]
[ROW][C]15[/C][C]0.120722[/C][C]1.9615[/C][C]0.025436[/C][/ROW]
[ROW][C]16[/C][C]0.07519[/C][C]1.2217[/C][C]0.111456[/C][/ROW]
[ROW][C]17[/C][C]0.149665[/C][C]2.4318[/C][C]0.007845[/C][/ROW]
[ROW][C]18[/C][C]-0.043411[/C][C]-0.7053[/C][C]0.240609[/C][/ROW]
[ROW][C]19[/C][C]0.059547[/C][C]0.9675[/C][C]0.167085[/C][/ROW]
[ROW][C]20[/C][C]0.02438[/C][C]0.3961[/C][C]0.346165[/C][/ROW]
[ROW][C]21[/C][C]-0.093109[/C][C]-1.5128[/C][C]0.065759[/C][/ROW]
[ROW][C]22[/C][C]0.02989[/C][C]0.4857[/C][C]0.313806[/C][/ROW]
[ROW][C]23[/C][C]0.04521[/C][C]0.7346[/C][C]0.231623[/C][/ROW]
[ROW][C]24[/C][C]0.032529[/C][C]0.5285[/C][C]0.298788[/C][/ROW]
[ROW][C]25[/C][C]0.144198[/C][C]2.3429[/C][C]0.009938[/C][/ROW]
[ROW][C]26[/C][C]-0.10042[/C][C]-1.6316[/C][C]0.051974[/C][/ROW]
[ROW][C]27[/C][C]0.101949[/C][C]1.6565[/C][C]0.049407[/C][/ROW]
[ROW][C]28[/C][C]-0.018654[/C][C]-0.3031[/C][C]0.381028[/C][/ROW]
[ROW][C]29[/C][C]-0.044384[/C][C]-0.7212[/C][C]0.235725[/C][/ROW]
[ROW][C]30[/C][C]-0.059705[/C][C]-0.9701[/C][C]0.166443[/C][/ROW]
[ROW][C]31[/C][C]0.021524[/C][C]0.3497[/C][C]0.363411[/C][/ROW]
[ROW][C]32[/C][C]0.009879[/C][C]0.1605[/C][C]0.436301[/C][/ROW]
[ROW][C]33[/C][C]-0.043429[/C][C]-0.7056[/C][C]0.240518[/C][/ROW]
[ROW][C]34[/C][C]0.017977[/C][C]0.2921[/C][C]0.385224[/C][/ROW]
[ROW][C]35[/C][C]0.016708[/C][C]0.2715[/C][C]0.39312[/C][/ROW]
[ROW][C]36[/C][C]0.012103[/C][C]0.1966[/C][C]0.422129[/C][/ROW]
[ROW][C]37[/C][C]0.048414[/C][C]0.7866[/C][C]0.216101[/C][/ROW]
[ROW][C]38[/C][C]-0.044726[/C][C]-0.7267[/C][C]0.234024[/C][/ROW]
[ROW][C]39[/C][C]0.062769[/C][C]1.0199[/C][C]0.154359[/C][/ROW]
[ROW][C]40[/C][C]0.07464[/C][C]1.2128[/C][C]0.113154[/C][/ROW]
[ROW][C]41[/C][C]0.074334[/C][C]1.2078[/C][C]0.114107[/C][/ROW]
[ROW][C]42[/C][C]0.072225[/C][C]1.1735[/C][C]0.120824[/C][/ROW]
[ROW][C]43[/C][C]0.157092[/C][C]2.5524[/C][C]0.00563[/C][/ROW]
[ROW][C]44[/C][C]0.170807[/C][C]2.7753[/C][C]0.002955[/C][/ROW]
[ROW][C]45[/C][C]0.034982[/C][C]0.5684[/C][C]0.285124[/C][/ROW]
[ROW][C]46[/C][C]0.066258[/C][C]1.0766[/C][C]0.141328[/C][/ROW]
[ROW][C]47[/C][C]0.018254[/C][C]0.2966[/C][C]0.383504[/C][/ROW]
[ROW][C]48[/C][C]-0.078963[/C][C]-1.283[/C][C]0.10031[/C][/ROW]
[/TABLE]
Source: https://freestatistics.org/blog/index.php?pk=40111&T=2

Globally Unique Identifier (entire table): ba.freestatistics.org/blog/index.php?pk=40111&T=2

As an alternative you can also use a QR Code:  

The GUIDs for individual cells are displayed in the table below:

Partial Autocorrelation Function
Time lag kPACF(k)T-STATP-value
10.1837442.98550.001548
20.1661322.69930.003698
30.1170771.90230.029112
4-0.121786-1.97880.02444
50.1378852.24040.01295
6-0.075713-1.23020.10986
70.0568330.92340.178316
80.0239930.38980.348486
9-0.080397-1.30630.096294
100.0676551.09930.136326
11-0.085087-1.38250.083993
120.0930371.51170.065907
130.0039760.06460.474268
14-0.128556-2.08880.018842
150.1207221.96150.025436
160.075191.22170.111456
170.1496652.43180.007845
18-0.043411-0.70530.240609
190.0595470.96750.167085
200.024380.39610.346165
21-0.093109-1.51280.065759
220.029890.48570.313806
230.045210.73460.231623
240.0325290.52850.298788
250.1441982.34290.009938
26-0.10042-1.63160.051974
270.1019491.65650.049407
28-0.018654-0.30310.381028
29-0.044384-0.72120.235725
30-0.059705-0.97010.166443
310.0215240.34970.363411
320.0098790.16050.436301
33-0.043429-0.70560.240518
340.0179770.29210.385224
350.0167080.27150.39312
360.0121030.19660.422129
370.0484140.78660.216101
38-0.044726-0.72670.234024
390.0627691.01990.154359
400.074641.21280.113154
410.0743341.20780.114107
420.0722251.17350.120824
430.1570922.55240.00563
440.1708072.77530.002955
450.0349820.56840.285124
460.0662581.07660.141328
470.0182540.29660.383504
48-0.078963-1.2830.10031


Parameters (Session):
par1 = 48 ; par2 = 1 ; par3 = 0 ; par4 = 0 ; par5 = 12 ;
Parameters (R input):
par1 = 48 ; par2 = 1 ; par3 = 0 ; par4 = 0 ; par5 = 12 ;
R code (references can be found in the software module):
if (par1 == 'Default') {
par1 = 10*log10(length(x))
} else {
par1 <- as.numeric(par1)
}
par2 <- as.numeric(par2)
par3 <- as.numeric(par3)
par4 <- as.numeric(par4)
par5 <- as.numeric(par5)
if (par2 == 0) {
x <- log(x)
} else {
x <- (x ^ par2 - 1) / par2
}
if (par3 > 0) x <- diff(x,lag=1,difference=par3)
if (par4 > 0) x <- diff(x,lag=par5,difference=par4)
bitmap(file='pic1.png')
racf <- acf(x,par1,main='Autocorrelation',xlab='lags',ylab='ACF')
dev.off()
bitmap(file='pic2.png')
rpacf <- pacf(x,par1,main='Partial Autocorrelation',xlab='lags',ylab='PACF')
dev.off()
(myacf <- c(racf$acf))
(mypacf <- c(rpacf$acf))
lengthx <- length(x)
sqrtn <- sqrt(lengthx)
load(file='createtable')
a<-table.start()
a<-table.row.start(a)
a<-table.element(a,'Autocorrelation Function',4,TRUE)
a<-table.row.end(a)
a<-table.row.start(a)
a<-table.element(a,'Time lag k',header=TRUE)
a<-table.element(a,hyperlink('basics.htm','ACF(k)','click here for more information about the Autocorrelation Function'),header=TRUE)
a<-table.element(a,'T-STAT',header=TRUE)
a<-table.element(a,'P-value',header=TRUE)
a<-table.row.end(a)
for (i in 2:(par1+1)) {
a<-table.row.start(a)
a<-table.element(a,i-1,header=TRUE)
a<-table.element(a,round(myacf[i],6))
mytstat <- myacf[i]*sqrtn
a<-table.element(a,round(mytstat,4))
a<-table.element(a,round(1-pt(abs(mytstat),lengthx),6))
a<-table.row.end(a)
}
a<-table.end(a)
table.save(a,file='mytable.tab')
a<-table.start()
a<-table.row.start(a)
a<-table.element(a,'Partial Autocorrelation Function',4,TRUE)
a<-table.row.end(a)
a<-table.row.start(a)
a<-table.element(a,'Time lag k',header=TRUE)
a<-table.element(a,hyperlink('basics.htm','PACF(k)','click here for more information about the Partial Autocorrelation Function'),header=TRUE)
a<-table.element(a,'T-STAT',header=TRUE)
a<-table.element(a,'P-value',header=TRUE)
a<-table.row.end(a)
for (i in 1:par1) {
a<-table.row.start(a)
a<-table.element(a,i,header=TRUE)
a<-table.element(a,round(mypacf[i],6))
mytstat <- mypacf[i]*sqrtn
a<-table.element(a,round(mytstat,4))
a<-table.element(a,round(1-pt(abs(mytstat),lengthx),6))
a<-table.row.end(a)
}
a<-table.end(a)
table.save(a,file='mytable1.tab')