Free Statistics

of Irreproducible Research!

Author's title

Author*Unverified author*
R Software Modulerwasp_autocorrelation.wasp
Title produced by software(Partial) Autocorrelation Function
Date of computationThu, 14 May 2009 12:29:48 -0600
Cite this page as followsStatistical Computations at FreeStatistics.org, Office for Research Development and Education, URL https://freestatistics.org/blog/index.php?v=date/2009/May/14/t12423258306dyvzuklrtf8qwo.htm/, Retrieved Mon, 29 Apr 2024 06:07:02 +0000
Statistical Computations at FreeStatistics.org, Office for Research Development and Education, URL https://freestatistics.org/blog/index.php?pk=40082, Retrieved Mon, 29 Apr 2024 06:07:02 +0000
QR Codes:

Original text written by user:
IsPrivate?No (this computation is public)
User-defined keywords
Estimated Impact121
Family? (F = Feedback message, R = changed R code, M = changed R Module, P = changed Parameters, D = changed Data)
-     [Mean Plot] [] [2009-05-07 16:38:34] [595bbfb6ab1e20d51262e8b831f4c453]
- RMPD  [(Partial) Autocorrelation Function] [] [2009-05-14 18:27:23] [96b01d8cb0304fe86f721affdc70b94f]
-           [(Partial) Autocorrelation Function] [] [2009-05-14 18:29:48] [5ece983fa688b54e830000b964b580e8] [Current]
Feedback Forum

Post a new message
Dataseries X:
3851.3
3851.8
3854.1
3858.4
3861.6
3856.3
3855.8
3860.4
3855.1
3839.5
3833
3833.6
3826.8
3818.2
3811.4
3806.8
3810.3
3818.2
3858.9
3867.8
3872.3
3873.3
3876.7
3882.6
3883.5
3882.2
3888.1
3893.7
3901.9
3914.3
3930.3
3948.3
3971.5
3990.1
3993
3998
4015.8
4041.2
4060.7
4076.7
4103
4125.3
4139.7
4146.7
4158
4155.1
4144.8
4148.2
4142.5
4142.1
4145.4
4146.3
4143.5
4149.2
4158.9
4166.1
4179.1
4194.4
4211.7
4226.3
4235.8
4243.6
4258.7
4278.2
4298
4315.1
4334.3
4356
4374
4395.5
4417.8
4432.8
4446.3


Summary of computational transaction
Raw Inputview raw input (R code)
Raw Outputview raw output of R engine
Computing time1 seconds
R Server'George Udny Yule' @ 72.249.76.132

\begin{tabular}{lllllllll}
\hline
Summary of computational transaction \tabularnewline
Raw Input & view raw input (R code)  \tabularnewline
Raw Output & view raw output of R engine  \tabularnewline
Computing time & 1 seconds \tabularnewline
R Server & 'George Udny Yule' @ 72.249.76.132 \tabularnewline
\hline
\end{tabular}
%Source: https://freestatistics.org/blog/index.php?pk=40082&T=0

[TABLE]
[ROW][C]Summary of computational transaction[/C][/ROW]
[ROW][C]Raw Input[/C][C]view raw input (R code) [/C][/ROW]
[ROW][C]Raw Output[/C][C]view raw output of R engine [/C][/ROW]
[ROW][C]Computing time[/C][C]1 seconds[/C][/ROW]
[ROW][C]R Server[/C][C]'George Udny Yule' @ 72.249.76.132[/C][/ROW]
[/TABLE]
Source: https://freestatistics.org/blog/index.php?pk=40082&T=0

Globally Unique Identifier (entire table): ba.freestatistics.org/blog/index.php?pk=40082&T=0

As an alternative you can also use a QR Code:  

The GUIDs for individual cells are displayed in the table below:

Summary of computational transaction
Raw Inputview raw input (R code)
Raw Outputview raw output of R engine
Computing time1 seconds
R Server'George Udny Yule' @ 72.249.76.132


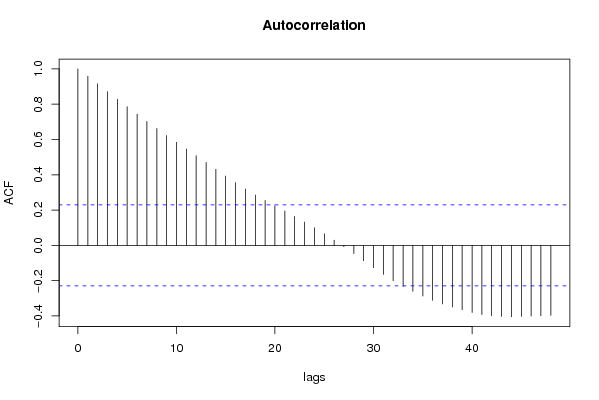
Autocorrelation Function
Time lag kACF(k)T-STATP-value
10.9587468.19150
20.9156437.82330
30.8717037.44780
40.8285047.07870
50.7860746.71620
60.7436166.35350
70.7023956.00130
80.6624875.66030
90.623055.32331e-06
100.583954.98932e-06
110.5457884.66327e-06
120.5083674.34352.2e-05
130.4700824.01647.1e-05
140.4311983.68420.000219
150.3926053.35440.000632
160.3551153.03410.00167
170.3193652.72870.003981
180.2853972.43840.008592
190.2546152.17540.016418
200.2249121.92170.029277
210.1953281.66890.049712
220.1641781.40270.082467
230.1320631.12830.131434
240.0996220.85120.198728
250.06590.5630.287563
260.0297140.25390.400153
27-0.007108-0.06070.475871
28-0.046489-0.39720.346188
29-0.086916-0.74260.230049
30-0.126081-1.07720.14246
31-0.164361-1.40430.082235
32-0.200395-1.71220.045555
33-0.232519-1.98660.025358
34-0.260483-2.22560.014566
35-0.287013-2.45220.008294
36-0.311361-2.66030.004797
37-0.331699-2.8340.00297
38-0.348627-2.97870.001964
39-0.36456-3.11480.001315
40-0.38004-3.24710.000881
41-0.391729-3.34690.000647
42-0.398904-3.40820.000534
43-0.402702-3.44070.000482
44-0.403882-3.45080.000466
45-0.402631-3.44010.000483
46-0.400655-3.42320.000509
47-0.398958-3.40870.000533
48-0.396409-3.38690.000571

\begin{tabular}{lllllllll}
\hline
Autocorrelation Function \tabularnewline
Time lag k & ACF(k) & T-STAT & P-value \tabularnewline
1 & 0.958746 & 8.1915 & 0 \tabularnewline
2 & 0.915643 & 7.8233 & 0 \tabularnewline
3 & 0.871703 & 7.4478 & 0 \tabularnewline
4 & 0.828504 & 7.0787 & 0 \tabularnewline
5 & 0.786074 & 6.7162 & 0 \tabularnewline
6 & 0.743616 & 6.3535 & 0 \tabularnewline
7 & 0.702395 & 6.0013 & 0 \tabularnewline
8 & 0.662487 & 5.6603 & 0 \tabularnewline
9 & 0.62305 & 5.3233 & 1e-06 \tabularnewline
10 & 0.58395 & 4.9893 & 2e-06 \tabularnewline
11 & 0.545788 & 4.6632 & 7e-06 \tabularnewline
12 & 0.508367 & 4.3435 & 2.2e-05 \tabularnewline
13 & 0.470082 & 4.0164 & 7.1e-05 \tabularnewline
14 & 0.431198 & 3.6842 & 0.000219 \tabularnewline
15 & 0.392605 & 3.3544 & 0.000632 \tabularnewline
16 & 0.355115 & 3.0341 & 0.00167 \tabularnewline
17 & 0.319365 & 2.7287 & 0.003981 \tabularnewline
18 & 0.285397 & 2.4384 & 0.008592 \tabularnewline
19 & 0.254615 & 2.1754 & 0.016418 \tabularnewline
20 & 0.224912 & 1.9217 & 0.029277 \tabularnewline
21 & 0.195328 & 1.6689 & 0.049712 \tabularnewline
22 & 0.164178 & 1.4027 & 0.082467 \tabularnewline
23 & 0.132063 & 1.1283 & 0.131434 \tabularnewline
24 & 0.099622 & 0.8512 & 0.198728 \tabularnewline
25 & 0.0659 & 0.563 & 0.287563 \tabularnewline
26 & 0.029714 & 0.2539 & 0.400153 \tabularnewline
27 & -0.007108 & -0.0607 & 0.475871 \tabularnewline
28 & -0.046489 & -0.3972 & 0.346188 \tabularnewline
29 & -0.086916 & -0.7426 & 0.230049 \tabularnewline
30 & -0.126081 & -1.0772 & 0.14246 \tabularnewline
31 & -0.164361 & -1.4043 & 0.082235 \tabularnewline
32 & -0.200395 & -1.7122 & 0.045555 \tabularnewline
33 & -0.232519 & -1.9866 & 0.025358 \tabularnewline
34 & -0.260483 & -2.2256 & 0.014566 \tabularnewline
35 & -0.287013 & -2.4522 & 0.008294 \tabularnewline
36 & -0.311361 & -2.6603 & 0.004797 \tabularnewline
37 & -0.331699 & -2.834 & 0.00297 \tabularnewline
38 & -0.348627 & -2.9787 & 0.001964 \tabularnewline
39 & -0.36456 & -3.1148 & 0.001315 \tabularnewline
40 & -0.38004 & -3.2471 & 0.000881 \tabularnewline
41 & -0.391729 & -3.3469 & 0.000647 \tabularnewline
42 & -0.398904 & -3.4082 & 0.000534 \tabularnewline
43 & -0.402702 & -3.4407 & 0.000482 \tabularnewline
44 & -0.403882 & -3.4508 & 0.000466 \tabularnewline
45 & -0.402631 & -3.4401 & 0.000483 \tabularnewline
46 & -0.400655 & -3.4232 & 0.000509 \tabularnewline
47 & -0.398958 & -3.4087 & 0.000533 \tabularnewline
48 & -0.396409 & -3.3869 & 0.000571 \tabularnewline
\hline
\end{tabular}
%Source: https://freestatistics.org/blog/index.php?pk=40082&T=1

[TABLE]
[ROW][C]Autocorrelation Function[/C][/ROW]
[ROW][C]Time lag k[/C][C]ACF(k)[/C][C]T-STAT[/C][C]P-value[/C][/ROW]
[ROW][C]1[/C][C]0.958746[/C][C]8.1915[/C][C]0[/C][/ROW]
[ROW][C]2[/C][C]0.915643[/C][C]7.8233[/C][C]0[/C][/ROW]
[ROW][C]3[/C][C]0.871703[/C][C]7.4478[/C][C]0[/C][/ROW]
[ROW][C]4[/C][C]0.828504[/C][C]7.0787[/C][C]0[/C][/ROW]
[ROW][C]5[/C][C]0.786074[/C][C]6.7162[/C][C]0[/C][/ROW]
[ROW][C]6[/C][C]0.743616[/C][C]6.3535[/C][C]0[/C][/ROW]
[ROW][C]7[/C][C]0.702395[/C][C]6.0013[/C][C]0[/C][/ROW]
[ROW][C]8[/C][C]0.662487[/C][C]5.6603[/C][C]0[/C][/ROW]
[ROW][C]9[/C][C]0.62305[/C][C]5.3233[/C][C]1e-06[/C][/ROW]
[ROW][C]10[/C][C]0.58395[/C][C]4.9893[/C][C]2e-06[/C][/ROW]
[ROW][C]11[/C][C]0.545788[/C][C]4.6632[/C][C]7e-06[/C][/ROW]
[ROW][C]12[/C][C]0.508367[/C][C]4.3435[/C][C]2.2e-05[/C][/ROW]
[ROW][C]13[/C][C]0.470082[/C][C]4.0164[/C][C]7.1e-05[/C][/ROW]
[ROW][C]14[/C][C]0.431198[/C][C]3.6842[/C][C]0.000219[/C][/ROW]
[ROW][C]15[/C][C]0.392605[/C][C]3.3544[/C][C]0.000632[/C][/ROW]
[ROW][C]16[/C][C]0.355115[/C][C]3.0341[/C][C]0.00167[/C][/ROW]
[ROW][C]17[/C][C]0.319365[/C][C]2.7287[/C][C]0.003981[/C][/ROW]
[ROW][C]18[/C][C]0.285397[/C][C]2.4384[/C][C]0.008592[/C][/ROW]
[ROW][C]19[/C][C]0.254615[/C][C]2.1754[/C][C]0.016418[/C][/ROW]
[ROW][C]20[/C][C]0.224912[/C][C]1.9217[/C][C]0.029277[/C][/ROW]
[ROW][C]21[/C][C]0.195328[/C][C]1.6689[/C][C]0.049712[/C][/ROW]
[ROW][C]22[/C][C]0.164178[/C][C]1.4027[/C][C]0.082467[/C][/ROW]
[ROW][C]23[/C][C]0.132063[/C][C]1.1283[/C][C]0.131434[/C][/ROW]
[ROW][C]24[/C][C]0.099622[/C][C]0.8512[/C][C]0.198728[/C][/ROW]
[ROW][C]25[/C][C]0.0659[/C][C]0.563[/C][C]0.287563[/C][/ROW]
[ROW][C]26[/C][C]0.029714[/C][C]0.2539[/C][C]0.400153[/C][/ROW]
[ROW][C]27[/C][C]-0.007108[/C][C]-0.0607[/C][C]0.475871[/C][/ROW]
[ROW][C]28[/C][C]-0.046489[/C][C]-0.3972[/C][C]0.346188[/C][/ROW]
[ROW][C]29[/C][C]-0.086916[/C][C]-0.7426[/C][C]0.230049[/C][/ROW]
[ROW][C]30[/C][C]-0.126081[/C][C]-1.0772[/C][C]0.14246[/C][/ROW]
[ROW][C]31[/C][C]-0.164361[/C][C]-1.4043[/C][C]0.082235[/C][/ROW]
[ROW][C]32[/C][C]-0.200395[/C][C]-1.7122[/C][C]0.045555[/C][/ROW]
[ROW][C]33[/C][C]-0.232519[/C][C]-1.9866[/C][C]0.025358[/C][/ROW]
[ROW][C]34[/C][C]-0.260483[/C][C]-2.2256[/C][C]0.014566[/C][/ROW]
[ROW][C]35[/C][C]-0.287013[/C][C]-2.4522[/C][C]0.008294[/C][/ROW]
[ROW][C]36[/C][C]-0.311361[/C][C]-2.6603[/C][C]0.004797[/C][/ROW]
[ROW][C]37[/C][C]-0.331699[/C][C]-2.834[/C][C]0.00297[/C][/ROW]
[ROW][C]38[/C][C]-0.348627[/C][C]-2.9787[/C][C]0.001964[/C][/ROW]
[ROW][C]39[/C][C]-0.36456[/C][C]-3.1148[/C][C]0.001315[/C][/ROW]
[ROW][C]40[/C][C]-0.38004[/C][C]-3.2471[/C][C]0.000881[/C][/ROW]
[ROW][C]41[/C][C]-0.391729[/C][C]-3.3469[/C][C]0.000647[/C][/ROW]
[ROW][C]42[/C][C]-0.398904[/C][C]-3.4082[/C][C]0.000534[/C][/ROW]
[ROW][C]43[/C][C]-0.402702[/C][C]-3.4407[/C][C]0.000482[/C][/ROW]
[ROW][C]44[/C][C]-0.403882[/C][C]-3.4508[/C][C]0.000466[/C][/ROW]
[ROW][C]45[/C][C]-0.402631[/C][C]-3.4401[/C][C]0.000483[/C][/ROW]
[ROW][C]46[/C][C]-0.400655[/C][C]-3.4232[/C][C]0.000509[/C][/ROW]
[ROW][C]47[/C][C]-0.398958[/C][C]-3.4087[/C][C]0.000533[/C][/ROW]
[ROW][C]48[/C][C]-0.396409[/C][C]-3.3869[/C][C]0.000571[/C][/ROW]
[/TABLE]
Source: https://freestatistics.org/blog/index.php?pk=40082&T=1

Globally Unique Identifier (entire table): ba.freestatistics.org/blog/index.php?pk=40082&T=1

As an alternative you can also use a QR Code:  

The GUIDs for individual cells are displayed in the table below:

Autocorrelation Function
Time lag kACF(k)T-STATP-value
10.9587468.19150
20.9156437.82330
30.8717037.44780
40.8285047.07870
50.7860746.71620
60.7436166.35350
70.7023956.00130
80.6624875.66030
90.623055.32331e-06
100.583954.98932e-06
110.5457884.66327e-06
120.5083674.34352.2e-05
130.4700824.01647.1e-05
140.4311983.68420.000219
150.3926053.35440.000632
160.3551153.03410.00167
170.3193652.72870.003981
180.2853972.43840.008592
190.2546152.17540.016418
200.2249121.92170.029277
210.1953281.66890.049712
220.1641781.40270.082467
230.1320631.12830.131434
240.0996220.85120.198728
250.06590.5630.287563
260.0297140.25390.400153
27-0.007108-0.06070.475871
28-0.046489-0.39720.346188
29-0.086916-0.74260.230049
30-0.126081-1.07720.14246
31-0.164361-1.40430.082235
32-0.200395-1.71220.045555
33-0.232519-1.98660.025358
34-0.260483-2.22560.014566
35-0.287013-2.45220.008294
36-0.311361-2.66030.004797
37-0.331699-2.8340.00297
38-0.348627-2.97870.001964
39-0.36456-3.11480.001315
40-0.38004-3.24710.000881
41-0.391729-3.34690.000647
42-0.398904-3.40820.000534
43-0.402702-3.44070.000482
44-0.403882-3.45080.000466
45-0.402631-3.44010.000483
46-0.400655-3.42320.000509
47-0.398958-3.40870.000533
48-0.396409-3.38690.000571


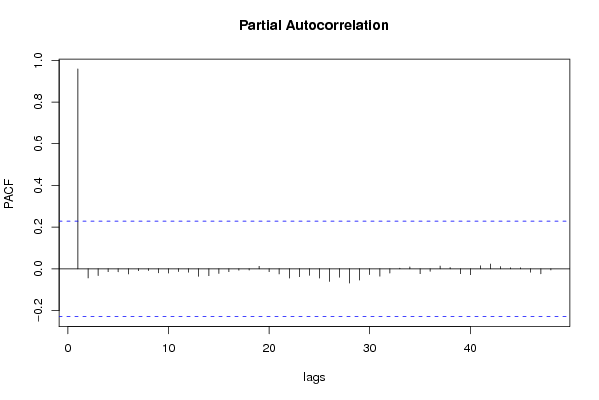
Partial Autocorrelation Function
Time lag kPACF(k)T-STATP-value
10.9587468.19150
2-0.043934-0.37540.354237
3-0.032387-0.27670.391389
4-0.013865-0.11850.453012
5-0.014371-0.12280.451308
6-0.024685-0.21090.416775
7-0.009078-0.07760.469194
8-0.008385-0.07160.471541
9-0.019135-0.16350.435294
10-0.020506-0.17520.430701
11-0.012848-0.10980.456446
12-0.015853-0.13540.446316
13-0.036034-0.30790.379527
14-0.03264-0.27890.390565
15-0.022335-0.19080.424593
16-0.013839-0.11820.453102
17-0.006611-0.05650.477555
18-0.005713-0.04880.480601
190.0118970.10160.459659
20-0.013938-0.11910.452765
21-0.024694-0.2110.416742
22-0.044438-0.37970.352644
23-0.037544-0.32080.374649
24-0.031399-0.26830.394622
25-0.044274-0.37830.353162
26-0.060539-0.51720.303274
27-0.040275-0.34410.365875
28-0.068261-0.58320.280771
29-0.053661-0.45850.323983
30-0.027413-0.23420.407737
31-0.035249-0.30120.382073
32-0.020175-0.17240.431809
330.0029040.02480.490137
340.0090310.07720.469353
35-0.023156-0.19780.421858
36-0.011768-0.10050.460092
370.0134610.1150.454375
380.006330.05410.478509
39-0.023102-0.19740.422038
40-0.027886-0.23830.406176
410.0143640.12270.451329
420.0229490.19610.422547
430.0108180.09240.463304
440.0046310.03960.484274
450.0049870.04260.483066
46-0.016249-0.13880.444983
47-0.023986-0.20490.419096
48-0.005047-0.04310.48286

\begin{tabular}{lllllllll}
\hline
Partial Autocorrelation Function \tabularnewline
Time lag k & PACF(k) & T-STAT & P-value \tabularnewline
1 & 0.958746 & 8.1915 & 0 \tabularnewline
2 & -0.043934 & -0.3754 & 0.354237 \tabularnewline
3 & -0.032387 & -0.2767 & 0.391389 \tabularnewline
4 & -0.013865 & -0.1185 & 0.453012 \tabularnewline
5 & -0.014371 & -0.1228 & 0.451308 \tabularnewline
6 & -0.024685 & -0.2109 & 0.416775 \tabularnewline
7 & -0.009078 & -0.0776 & 0.469194 \tabularnewline
8 & -0.008385 & -0.0716 & 0.471541 \tabularnewline
9 & -0.019135 & -0.1635 & 0.435294 \tabularnewline
10 & -0.020506 & -0.1752 & 0.430701 \tabularnewline
11 & -0.012848 & -0.1098 & 0.456446 \tabularnewline
12 & -0.015853 & -0.1354 & 0.446316 \tabularnewline
13 & -0.036034 & -0.3079 & 0.379527 \tabularnewline
14 & -0.03264 & -0.2789 & 0.390565 \tabularnewline
15 & -0.022335 & -0.1908 & 0.424593 \tabularnewline
16 & -0.013839 & -0.1182 & 0.453102 \tabularnewline
17 & -0.006611 & -0.0565 & 0.477555 \tabularnewline
18 & -0.005713 & -0.0488 & 0.480601 \tabularnewline
19 & 0.011897 & 0.1016 & 0.459659 \tabularnewline
20 & -0.013938 & -0.1191 & 0.452765 \tabularnewline
21 & -0.024694 & -0.211 & 0.416742 \tabularnewline
22 & -0.044438 & -0.3797 & 0.352644 \tabularnewline
23 & -0.037544 & -0.3208 & 0.374649 \tabularnewline
24 & -0.031399 & -0.2683 & 0.394622 \tabularnewline
25 & -0.044274 & -0.3783 & 0.353162 \tabularnewline
26 & -0.060539 & -0.5172 & 0.303274 \tabularnewline
27 & -0.040275 & -0.3441 & 0.365875 \tabularnewline
28 & -0.068261 & -0.5832 & 0.280771 \tabularnewline
29 & -0.053661 & -0.4585 & 0.323983 \tabularnewline
30 & -0.027413 & -0.2342 & 0.407737 \tabularnewline
31 & -0.035249 & -0.3012 & 0.382073 \tabularnewline
32 & -0.020175 & -0.1724 & 0.431809 \tabularnewline
33 & 0.002904 & 0.0248 & 0.490137 \tabularnewline
34 & 0.009031 & 0.0772 & 0.469353 \tabularnewline
35 & -0.023156 & -0.1978 & 0.421858 \tabularnewline
36 & -0.011768 & -0.1005 & 0.460092 \tabularnewline
37 & 0.013461 & 0.115 & 0.454375 \tabularnewline
38 & 0.00633 & 0.0541 & 0.478509 \tabularnewline
39 & -0.023102 & -0.1974 & 0.422038 \tabularnewline
40 & -0.027886 & -0.2383 & 0.406176 \tabularnewline
41 & 0.014364 & 0.1227 & 0.451329 \tabularnewline
42 & 0.022949 & 0.1961 & 0.422547 \tabularnewline
43 & 0.010818 & 0.0924 & 0.463304 \tabularnewline
44 & 0.004631 & 0.0396 & 0.484274 \tabularnewline
45 & 0.004987 & 0.0426 & 0.483066 \tabularnewline
46 & -0.016249 & -0.1388 & 0.444983 \tabularnewline
47 & -0.023986 & -0.2049 & 0.419096 \tabularnewline
48 & -0.005047 & -0.0431 & 0.48286 \tabularnewline
\hline
\end{tabular}
%Source: https://freestatistics.org/blog/index.php?pk=40082&T=2

[TABLE]
[ROW][C]Partial Autocorrelation Function[/C][/ROW]
[ROW][C]Time lag k[/C][C]PACF(k)[/C][C]T-STAT[/C][C]P-value[/C][/ROW]
[ROW][C]1[/C][C]0.958746[/C][C]8.1915[/C][C]0[/C][/ROW]
[ROW][C]2[/C][C]-0.043934[/C][C]-0.3754[/C][C]0.354237[/C][/ROW]
[ROW][C]3[/C][C]-0.032387[/C][C]-0.2767[/C][C]0.391389[/C][/ROW]
[ROW][C]4[/C][C]-0.013865[/C][C]-0.1185[/C][C]0.453012[/C][/ROW]
[ROW][C]5[/C][C]-0.014371[/C][C]-0.1228[/C][C]0.451308[/C][/ROW]
[ROW][C]6[/C][C]-0.024685[/C][C]-0.2109[/C][C]0.416775[/C][/ROW]
[ROW][C]7[/C][C]-0.009078[/C][C]-0.0776[/C][C]0.469194[/C][/ROW]
[ROW][C]8[/C][C]-0.008385[/C][C]-0.0716[/C][C]0.471541[/C][/ROW]
[ROW][C]9[/C][C]-0.019135[/C][C]-0.1635[/C][C]0.435294[/C][/ROW]
[ROW][C]10[/C][C]-0.020506[/C][C]-0.1752[/C][C]0.430701[/C][/ROW]
[ROW][C]11[/C][C]-0.012848[/C][C]-0.1098[/C][C]0.456446[/C][/ROW]
[ROW][C]12[/C][C]-0.015853[/C][C]-0.1354[/C][C]0.446316[/C][/ROW]
[ROW][C]13[/C][C]-0.036034[/C][C]-0.3079[/C][C]0.379527[/C][/ROW]
[ROW][C]14[/C][C]-0.03264[/C][C]-0.2789[/C][C]0.390565[/C][/ROW]
[ROW][C]15[/C][C]-0.022335[/C][C]-0.1908[/C][C]0.424593[/C][/ROW]
[ROW][C]16[/C][C]-0.013839[/C][C]-0.1182[/C][C]0.453102[/C][/ROW]
[ROW][C]17[/C][C]-0.006611[/C][C]-0.0565[/C][C]0.477555[/C][/ROW]
[ROW][C]18[/C][C]-0.005713[/C][C]-0.0488[/C][C]0.480601[/C][/ROW]
[ROW][C]19[/C][C]0.011897[/C][C]0.1016[/C][C]0.459659[/C][/ROW]
[ROW][C]20[/C][C]-0.013938[/C][C]-0.1191[/C][C]0.452765[/C][/ROW]
[ROW][C]21[/C][C]-0.024694[/C][C]-0.211[/C][C]0.416742[/C][/ROW]
[ROW][C]22[/C][C]-0.044438[/C][C]-0.3797[/C][C]0.352644[/C][/ROW]
[ROW][C]23[/C][C]-0.037544[/C][C]-0.3208[/C][C]0.374649[/C][/ROW]
[ROW][C]24[/C][C]-0.031399[/C][C]-0.2683[/C][C]0.394622[/C][/ROW]
[ROW][C]25[/C][C]-0.044274[/C][C]-0.3783[/C][C]0.353162[/C][/ROW]
[ROW][C]26[/C][C]-0.060539[/C][C]-0.5172[/C][C]0.303274[/C][/ROW]
[ROW][C]27[/C][C]-0.040275[/C][C]-0.3441[/C][C]0.365875[/C][/ROW]
[ROW][C]28[/C][C]-0.068261[/C][C]-0.5832[/C][C]0.280771[/C][/ROW]
[ROW][C]29[/C][C]-0.053661[/C][C]-0.4585[/C][C]0.323983[/C][/ROW]
[ROW][C]30[/C][C]-0.027413[/C][C]-0.2342[/C][C]0.407737[/C][/ROW]
[ROW][C]31[/C][C]-0.035249[/C][C]-0.3012[/C][C]0.382073[/C][/ROW]
[ROW][C]32[/C][C]-0.020175[/C][C]-0.1724[/C][C]0.431809[/C][/ROW]
[ROW][C]33[/C][C]0.002904[/C][C]0.0248[/C][C]0.490137[/C][/ROW]
[ROW][C]34[/C][C]0.009031[/C][C]0.0772[/C][C]0.469353[/C][/ROW]
[ROW][C]35[/C][C]-0.023156[/C][C]-0.1978[/C][C]0.421858[/C][/ROW]
[ROW][C]36[/C][C]-0.011768[/C][C]-0.1005[/C][C]0.460092[/C][/ROW]
[ROW][C]37[/C][C]0.013461[/C][C]0.115[/C][C]0.454375[/C][/ROW]
[ROW][C]38[/C][C]0.00633[/C][C]0.0541[/C][C]0.478509[/C][/ROW]
[ROW][C]39[/C][C]-0.023102[/C][C]-0.1974[/C][C]0.422038[/C][/ROW]
[ROW][C]40[/C][C]-0.027886[/C][C]-0.2383[/C][C]0.406176[/C][/ROW]
[ROW][C]41[/C][C]0.014364[/C][C]0.1227[/C][C]0.451329[/C][/ROW]
[ROW][C]42[/C][C]0.022949[/C][C]0.1961[/C][C]0.422547[/C][/ROW]
[ROW][C]43[/C][C]0.010818[/C][C]0.0924[/C][C]0.463304[/C][/ROW]
[ROW][C]44[/C][C]0.004631[/C][C]0.0396[/C][C]0.484274[/C][/ROW]
[ROW][C]45[/C][C]0.004987[/C][C]0.0426[/C][C]0.483066[/C][/ROW]
[ROW][C]46[/C][C]-0.016249[/C][C]-0.1388[/C][C]0.444983[/C][/ROW]
[ROW][C]47[/C][C]-0.023986[/C][C]-0.2049[/C][C]0.419096[/C][/ROW]
[ROW][C]48[/C][C]-0.005047[/C][C]-0.0431[/C][C]0.48286[/C][/ROW]
[/TABLE]
Source: https://freestatistics.org/blog/index.php?pk=40082&T=2

Globally Unique Identifier (entire table): ba.freestatistics.org/blog/index.php?pk=40082&T=2

As an alternative you can also use a QR Code:  

The GUIDs for individual cells are displayed in the table below:

Partial Autocorrelation Function
Time lag kPACF(k)T-STATP-value
10.9587468.19150
2-0.043934-0.37540.354237
3-0.032387-0.27670.391389
4-0.013865-0.11850.453012
5-0.014371-0.12280.451308
6-0.024685-0.21090.416775
7-0.009078-0.07760.469194
8-0.008385-0.07160.471541
9-0.019135-0.16350.435294
10-0.020506-0.17520.430701
11-0.012848-0.10980.456446
12-0.015853-0.13540.446316
13-0.036034-0.30790.379527
14-0.03264-0.27890.390565
15-0.022335-0.19080.424593
16-0.013839-0.11820.453102
17-0.006611-0.05650.477555
18-0.005713-0.04880.480601
190.0118970.10160.459659
20-0.013938-0.11910.452765
21-0.024694-0.2110.416742
22-0.044438-0.37970.352644
23-0.037544-0.32080.374649
24-0.031399-0.26830.394622
25-0.044274-0.37830.353162
26-0.060539-0.51720.303274
27-0.040275-0.34410.365875
28-0.068261-0.58320.280771
29-0.053661-0.45850.323983
30-0.027413-0.23420.407737
31-0.035249-0.30120.382073
32-0.020175-0.17240.431809
330.0029040.02480.490137
340.0090310.07720.469353
35-0.023156-0.19780.421858
36-0.011768-0.10050.460092
370.0134610.1150.454375
380.006330.05410.478509
39-0.023102-0.19740.422038
40-0.027886-0.23830.406176
410.0143640.12270.451329
420.0229490.19610.422547
430.0108180.09240.463304
440.0046310.03960.484274
450.0049870.04260.483066
46-0.016249-0.13880.444983
47-0.023986-0.20490.419096
48-0.005047-0.04310.48286


Parameters (Session):
par1 = 48 ; par2 = 1 ; par3 = 0 ; par4 = 0 ; par5 = 12 ;
Parameters (R input):
par1 = 48 ; par2 = 1 ; par3 = 0 ; par4 = 0 ; par5 = 12 ; par6 = ; par7 = ; par8 = ; par9 = ; par10 = ; par11 = ; par12 = ; par13 = ; par14 = ; par15 = ; par16 = ; par17 = ; par18 = ; par19 = ; par20 = ;
R code (references can be found in the software module):
if (par1 == 'Default') {
par1 = 10*log10(length(x))
} else {
par1 <- as.numeric(par1)
}
par2 <- as.numeric(par2)
par3 <- as.numeric(par3)
par4 <- as.numeric(par4)
par5 <- as.numeric(par5)
if (par2 == 0) {
x <- log(x)
} else {
x <- (x ^ par2 - 1) / par2
}
if (par3 > 0) x <- diff(x,lag=1,difference=par3)
if (par4 > 0) x <- diff(x,lag=par5,difference=par4)
bitmap(file='pic1.png')
racf <- acf(x,par1,main='Autocorrelation',xlab='lags',ylab='ACF')
dev.off()
bitmap(file='pic2.png')
rpacf <- pacf(x,par1,main='Partial Autocorrelation',xlab='lags',ylab='PACF')
dev.off()
(myacf <- c(racf$acf))
(mypacf <- c(rpacf$acf))
lengthx <- length(x)
sqrtn <- sqrt(lengthx)
load(file='createtable')
a<-table.start()
a<-table.row.start(a)
a<-table.element(a,'Autocorrelation Function',4,TRUE)
a<-table.row.end(a)
a<-table.row.start(a)
a<-table.element(a,'Time lag k',header=TRUE)
a<-table.element(a,hyperlink('basics.htm','ACF(k)','click here for more information about the Autocorrelation Function'),header=TRUE)
a<-table.element(a,'T-STAT',header=TRUE)
a<-table.element(a,'P-value',header=TRUE)
a<-table.row.end(a)
for (i in 2:(par1+1)) {
a<-table.row.start(a)
a<-table.element(a,i-1,header=TRUE)
a<-table.element(a,round(myacf[i],6))
mytstat <- myacf[i]*sqrtn
a<-table.element(a,round(mytstat,4))
a<-table.element(a,round(1-pt(abs(mytstat),lengthx),6))
a<-table.row.end(a)
}
a<-table.end(a)
table.save(a,file='mytable.tab')
a<-table.start()
a<-table.row.start(a)
a<-table.element(a,'Partial Autocorrelation Function',4,TRUE)
a<-table.row.end(a)
a<-table.row.start(a)
a<-table.element(a,'Time lag k',header=TRUE)
a<-table.element(a,hyperlink('basics.htm','PACF(k)','click here for more information about the Partial Autocorrelation Function'),header=TRUE)
a<-table.element(a,'T-STAT',header=TRUE)
a<-table.element(a,'P-value',header=TRUE)
a<-table.row.end(a)
for (i in 1:par1) {
a<-table.row.start(a)
a<-table.element(a,i,header=TRUE)
a<-table.element(a,round(mypacf[i],6))
mytstat <- mypacf[i]*sqrtn
a<-table.element(a,round(mytstat,4))
a<-table.element(a,round(1-pt(abs(mytstat),lengthx),6))
a<-table.row.end(a)
}
a<-table.end(a)
table.save(a,file='mytable1.tab')