Free Statistics

of Irreproducible Research!

Author's title

Author*Unverified author*
R Software Modulerwasp_autocorrelation.wasp
Title produced by software(Partial) Autocorrelation Function
Date of computationThu, 14 May 2009 12:09:10 -0600
Cite this page as followsStatistical Computations at FreeStatistics.org, Office for Research Development and Education, URL https://freestatistics.org/blog/index.php?v=date/2009/May/14/t1242324566ypfoap69srkbi89.htm/, Retrieved Sun, 28 Apr 2024 23:29:18 +0000
Statistical Computations at FreeStatistics.org, Office for Research Development and Education, URL https://freestatistics.org/blog/index.php?pk=40069, Retrieved Sun, 28 Apr 2024 23:29:18 +0000
QR Codes:

Original text written by user:
IsPrivate?No (this computation is public)
User-defined keywords
Estimated Impact96
Family? (F = Feedback message, R = changed R code, M = changed R Module, P = changed Parameters, D = changed Data)
-       [(Partial) Autocorrelation Function] [] [2009-05-14 18:09:10] [5aa691221f42eb69d375706ec88f102e] [Current]
Feedback Forum

Post a new message
Dataseries X:
10.812
10.738
10.171
9.721
9.897
9.828
9.924
10.371
10.846
10.413
10.709
10.662
10.57
10.297
10.635
10.872
10.296
10.383
10.431
10.574
10.653
10.805
10.872
10.625
10.407
10.463
10.556
10.646
10.702
11.353
11.346
11.451
11.964
12.574
13.031
13.812
14.544
14.931
14.886
16.005
17.064
15.168
16.05
15.839
15.137
14.954
15.648
15.305
15.579
16.348
15.928
16.171
15.937
15.713
15.594
15.683
16.438
17.032
17.696
17.745
19.394
20.148
20.108
18.584
18.441
18.391
19.178
18.079
18.483
19.644
19.195
19.65
20.83


Summary of computational transaction
Raw Inputview raw input (R code)
Raw Outputview raw output of R engine
Computing time2 seconds
R Server'Gwilym Jenkins' @ 72.249.127.135

\begin{tabular}{lllllllll}
\hline
Summary of computational transaction \tabularnewline
Raw Input & view raw input (R code)  \tabularnewline
Raw Output & view raw output of R engine  \tabularnewline
Computing time & 2 seconds \tabularnewline
R Server & 'Gwilym Jenkins' @ 72.249.127.135 \tabularnewline
\hline
\end{tabular}
%Source: https://freestatistics.org/blog/index.php?pk=40069&T=0

[TABLE]
[ROW][C]Summary of computational transaction[/C][/ROW]
[ROW][C]Raw Input[/C][C]view raw input (R code) [/C][/ROW]
[ROW][C]Raw Output[/C][C]view raw output of R engine [/C][/ROW]
[ROW][C]Computing time[/C][C]2 seconds[/C][/ROW]
[ROW][C]R Server[/C][C]'Gwilym Jenkins' @ 72.249.127.135[/C][/ROW]
[/TABLE]
Source: https://freestatistics.org/blog/index.php?pk=40069&T=0

Globally Unique Identifier (entire table): ba.freestatistics.org/blog/index.php?pk=40069&T=0

As an alternative you can also use a QR Code:  

The GUIDs for individual cells are displayed in the table below:

Summary of computational transaction
Raw Inputview raw input (R code)
Raw Outputview raw output of R engine
Computing time2 seconds
R Server'Gwilym Jenkins' @ 72.249.127.135


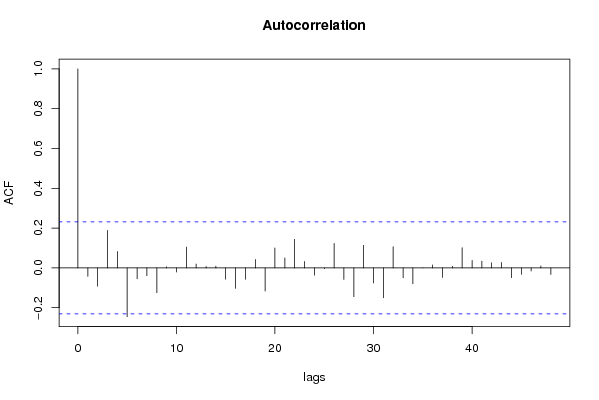
Autocorrelation Function
Time lag kACF(k)T-STATP-value
1-0.04212-0.35740.360919
2-0.091965-0.78030.218872
30.1881751.59670.057355
40.0830490.70470.241637
5-0.24495-2.07850.020615
6-0.054747-0.46450.32183
7-0.039257-0.33310.370009
8-0.124793-1.05890.146592
90.00550.04670.481454
10-0.020581-0.17460.430926
110.1047610.88890.188503
120.0193160.16390.435133
130.007050.05980.476233
140.0084760.07190.471431
15-0.056358-0.47820.316974
16-0.103392-0.87730.191618
17-0.057253-0.48580.314288
180.0426720.36210.359173
19-0.116148-0.98550.163828
200.100120.84950.199197
210.0503950.42760.335105
220.1438011.22020.113186
230.0322890.2740.392443
24-0.036878-0.31290.377622
25-0.003724-0.03160.48744
260.123121.04470.149827
27-0.057731-0.48990.312858
28-0.144889-1.22940.111457
290.1133070.96140.169774
30-0.075561-0.64120.26173
31-0.150182-1.27430.103321
320.1067540.90580.184022
33-0.049626-0.42110.337471
34-0.080205-0.68060.249165
35-7.9e-05-7e-040.499732
360.0150530.12770.449361
37-0.047839-0.40590.343
380.0081230.06890.472621
390.1016220.86230.195696
400.0373830.31720.376003
410.0336410.28550.388058
420.0255240.21660.414574
430.0275860.23410.407795
44-0.049436-0.41950.338058
45-0.032077-0.27220.393131
46-0.014975-0.12710.44962
470.0097460.08270.467162
48-0.033067-0.28060.389918

\begin{tabular}{lllllllll}
\hline
Autocorrelation Function \tabularnewline
Time lag k & ACF(k) & T-STAT & P-value \tabularnewline
1 & -0.04212 & -0.3574 & 0.360919 \tabularnewline
2 & -0.091965 & -0.7803 & 0.218872 \tabularnewline
3 & 0.188175 & 1.5967 & 0.057355 \tabularnewline
4 & 0.083049 & 0.7047 & 0.241637 \tabularnewline
5 & -0.24495 & -2.0785 & 0.020615 \tabularnewline
6 & -0.054747 & -0.4645 & 0.32183 \tabularnewline
7 & -0.039257 & -0.3331 & 0.370009 \tabularnewline
8 & -0.124793 & -1.0589 & 0.146592 \tabularnewline
9 & 0.0055 & 0.0467 & 0.481454 \tabularnewline
10 & -0.020581 & -0.1746 & 0.430926 \tabularnewline
11 & 0.104761 & 0.8889 & 0.188503 \tabularnewline
12 & 0.019316 & 0.1639 & 0.435133 \tabularnewline
13 & 0.00705 & 0.0598 & 0.476233 \tabularnewline
14 & 0.008476 & 0.0719 & 0.471431 \tabularnewline
15 & -0.056358 & -0.4782 & 0.316974 \tabularnewline
16 & -0.103392 & -0.8773 & 0.191618 \tabularnewline
17 & -0.057253 & -0.4858 & 0.314288 \tabularnewline
18 & 0.042672 & 0.3621 & 0.359173 \tabularnewline
19 & -0.116148 & -0.9855 & 0.163828 \tabularnewline
20 & 0.10012 & 0.8495 & 0.199197 \tabularnewline
21 & 0.050395 & 0.4276 & 0.335105 \tabularnewline
22 & 0.143801 & 1.2202 & 0.113186 \tabularnewline
23 & 0.032289 & 0.274 & 0.392443 \tabularnewline
24 & -0.036878 & -0.3129 & 0.377622 \tabularnewline
25 & -0.003724 & -0.0316 & 0.48744 \tabularnewline
26 & 0.12312 & 1.0447 & 0.149827 \tabularnewline
27 & -0.057731 & -0.4899 & 0.312858 \tabularnewline
28 & -0.144889 & -1.2294 & 0.111457 \tabularnewline
29 & 0.113307 & 0.9614 & 0.169774 \tabularnewline
30 & -0.075561 & -0.6412 & 0.26173 \tabularnewline
31 & -0.150182 & -1.2743 & 0.103321 \tabularnewline
32 & 0.106754 & 0.9058 & 0.184022 \tabularnewline
33 & -0.049626 & -0.4211 & 0.337471 \tabularnewline
34 & -0.080205 & -0.6806 & 0.249165 \tabularnewline
35 & -7.9e-05 & -7e-04 & 0.499732 \tabularnewline
36 & 0.015053 & 0.1277 & 0.449361 \tabularnewline
37 & -0.047839 & -0.4059 & 0.343 \tabularnewline
38 & 0.008123 & 0.0689 & 0.472621 \tabularnewline
39 & 0.101622 & 0.8623 & 0.195696 \tabularnewline
40 & 0.037383 & 0.3172 & 0.376003 \tabularnewline
41 & 0.033641 & 0.2855 & 0.388058 \tabularnewline
42 & 0.025524 & 0.2166 & 0.414574 \tabularnewline
43 & 0.027586 & 0.2341 & 0.407795 \tabularnewline
44 & -0.049436 & -0.4195 & 0.338058 \tabularnewline
45 & -0.032077 & -0.2722 & 0.393131 \tabularnewline
46 & -0.014975 & -0.1271 & 0.44962 \tabularnewline
47 & 0.009746 & 0.0827 & 0.467162 \tabularnewline
48 & -0.033067 & -0.2806 & 0.389918 \tabularnewline
\hline
\end{tabular}
%Source: https://freestatistics.org/blog/index.php?pk=40069&T=1

[TABLE]
[ROW][C]Autocorrelation Function[/C][/ROW]
[ROW][C]Time lag k[/C][C]ACF(k)[/C][C]T-STAT[/C][C]P-value[/C][/ROW]
[ROW][C]1[/C][C]-0.04212[/C][C]-0.3574[/C][C]0.360919[/C][/ROW]
[ROW][C]2[/C][C]-0.091965[/C][C]-0.7803[/C][C]0.218872[/C][/ROW]
[ROW][C]3[/C][C]0.188175[/C][C]1.5967[/C][C]0.057355[/C][/ROW]
[ROW][C]4[/C][C]0.083049[/C][C]0.7047[/C][C]0.241637[/C][/ROW]
[ROW][C]5[/C][C]-0.24495[/C][C]-2.0785[/C][C]0.020615[/C][/ROW]
[ROW][C]6[/C][C]-0.054747[/C][C]-0.4645[/C][C]0.32183[/C][/ROW]
[ROW][C]7[/C][C]-0.039257[/C][C]-0.3331[/C][C]0.370009[/C][/ROW]
[ROW][C]8[/C][C]-0.124793[/C][C]-1.0589[/C][C]0.146592[/C][/ROW]
[ROW][C]9[/C][C]0.0055[/C][C]0.0467[/C][C]0.481454[/C][/ROW]
[ROW][C]10[/C][C]-0.020581[/C][C]-0.1746[/C][C]0.430926[/C][/ROW]
[ROW][C]11[/C][C]0.104761[/C][C]0.8889[/C][C]0.188503[/C][/ROW]
[ROW][C]12[/C][C]0.019316[/C][C]0.1639[/C][C]0.435133[/C][/ROW]
[ROW][C]13[/C][C]0.00705[/C][C]0.0598[/C][C]0.476233[/C][/ROW]
[ROW][C]14[/C][C]0.008476[/C][C]0.0719[/C][C]0.471431[/C][/ROW]
[ROW][C]15[/C][C]-0.056358[/C][C]-0.4782[/C][C]0.316974[/C][/ROW]
[ROW][C]16[/C][C]-0.103392[/C][C]-0.8773[/C][C]0.191618[/C][/ROW]
[ROW][C]17[/C][C]-0.057253[/C][C]-0.4858[/C][C]0.314288[/C][/ROW]
[ROW][C]18[/C][C]0.042672[/C][C]0.3621[/C][C]0.359173[/C][/ROW]
[ROW][C]19[/C][C]-0.116148[/C][C]-0.9855[/C][C]0.163828[/C][/ROW]
[ROW][C]20[/C][C]0.10012[/C][C]0.8495[/C][C]0.199197[/C][/ROW]
[ROW][C]21[/C][C]0.050395[/C][C]0.4276[/C][C]0.335105[/C][/ROW]
[ROW][C]22[/C][C]0.143801[/C][C]1.2202[/C][C]0.113186[/C][/ROW]
[ROW][C]23[/C][C]0.032289[/C][C]0.274[/C][C]0.392443[/C][/ROW]
[ROW][C]24[/C][C]-0.036878[/C][C]-0.3129[/C][C]0.377622[/C][/ROW]
[ROW][C]25[/C][C]-0.003724[/C][C]-0.0316[/C][C]0.48744[/C][/ROW]
[ROW][C]26[/C][C]0.12312[/C][C]1.0447[/C][C]0.149827[/C][/ROW]
[ROW][C]27[/C][C]-0.057731[/C][C]-0.4899[/C][C]0.312858[/C][/ROW]
[ROW][C]28[/C][C]-0.144889[/C][C]-1.2294[/C][C]0.111457[/C][/ROW]
[ROW][C]29[/C][C]0.113307[/C][C]0.9614[/C][C]0.169774[/C][/ROW]
[ROW][C]30[/C][C]-0.075561[/C][C]-0.6412[/C][C]0.26173[/C][/ROW]
[ROW][C]31[/C][C]-0.150182[/C][C]-1.2743[/C][C]0.103321[/C][/ROW]
[ROW][C]32[/C][C]0.106754[/C][C]0.9058[/C][C]0.184022[/C][/ROW]
[ROW][C]33[/C][C]-0.049626[/C][C]-0.4211[/C][C]0.337471[/C][/ROW]
[ROW][C]34[/C][C]-0.080205[/C][C]-0.6806[/C][C]0.249165[/C][/ROW]
[ROW][C]35[/C][C]-7.9e-05[/C][C]-7e-04[/C][C]0.499732[/C][/ROW]
[ROW][C]36[/C][C]0.015053[/C][C]0.1277[/C][C]0.449361[/C][/ROW]
[ROW][C]37[/C][C]-0.047839[/C][C]-0.4059[/C][C]0.343[/C][/ROW]
[ROW][C]38[/C][C]0.008123[/C][C]0.0689[/C][C]0.472621[/C][/ROW]
[ROW][C]39[/C][C]0.101622[/C][C]0.8623[/C][C]0.195696[/C][/ROW]
[ROW][C]40[/C][C]0.037383[/C][C]0.3172[/C][C]0.376003[/C][/ROW]
[ROW][C]41[/C][C]0.033641[/C][C]0.2855[/C][C]0.388058[/C][/ROW]
[ROW][C]42[/C][C]0.025524[/C][C]0.2166[/C][C]0.414574[/C][/ROW]
[ROW][C]43[/C][C]0.027586[/C][C]0.2341[/C][C]0.407795[/C][/ROW]
[ROW][C]44[/C][C]-0.049436[/C][C]-0.4195[/C][C]0.338058[/C][/ROW]
[ROW][C]45[/C][C]-0.032077[/C][C]-0.2722[/C][C]0.393131[/C][/ROW]
[ROW][C]46[/C][C]-0.014975[/C][C]-0.1271[/C][C]0.44962[/C][/ROW]
[ROW][C]47[/C][C]0.009746[/C][C]0.0827[/C][C]0.467162[/C][/ROW]
[ROW][C]48[/C][C]-0.033067[/C][C]-0.2806[/C][C]0.389918[/C][/ROW]
[/TABLE]
Source: https://freestatistics.org/blog/index.php?pk=40069&T=1

Globally Unique Identifier (entire table): ba.freestatistics.org/blog/index.php?pk=40069&T=1

As an alternative you can also use a QR Code:  

The GUIDs for individual cells are displayed in the table below:

Autocorrelation Function
Time lag kACF(k)T-STATP-value
1-0.04212-0.35740.360919
2-0.091965-0.78030.218872
30.1881751.59670.057355
40.0830490.70470.241637
5-0.24495-2.07850.020615
6-0.054747-0.46450.32183
7-0.039257-0.33310.370009
8-0.124793-1.05890.146592
90.00550.04670.481454
10-0.020581-0.17460.430926
110.1047610.88890.188503
120.0193160.16390.435133
130.007050.05980.476233
140.0084760.07190.471431
15-0.056358-0.47820.316974
16-0.103392-0.87730.191618
17-0.057253-0.48580.314288
180.0426720.36210.359173
19-0.116148-0.98550.163828
200.100120.84950.199197
210.0503950.42760.335105
220.1438011.22020.113186
230.0322890.2740.392443
24-0.036878-0.31290.377622
25-0.003724-0.03160.48744
260.123121.04470.149827
27-0.057731-0.48990.312858
28-0.144889-1.22940.111457
290.1133070.96140.169774
30-0.075561-0.64120.26173
31-0.150182-1.27430.103321
320.1067540.90580.184022
33-0.049626-0.42110.337471
34-0.080205-0.68060.249165
35-7.9e-05-7e-040.499732
360.0150530.12770.449361
37-0.047839-0.40590.343
380.0081230.06890.472621
390.1016220.86230.195696
400.0373830.31720.376003
410.0336410.28550.388058
420.0255240.21660.414574
430.0275860.23410.407795
44-0.049436-0.41950.338058
45-0.032077-0.27220.393131
46-0.014975-0.12710.44962
470.0097460.08270.467162
48-0.033067-0.28060.389918


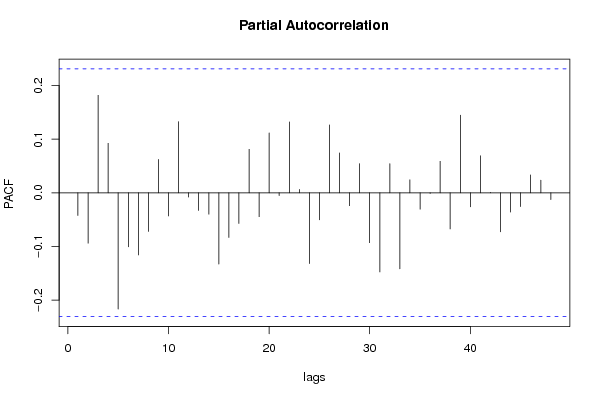
Partial Autocorrelation Function
Time lag kPACF(k)T-STATP-value
1-0.04212-0.35740.360919
2-0.093906-0.79680.214089
30.1819061.54350.063544
40.0922990.78320.218043
5-0.216837-1.83990.03495
6-0.100737-0.85480.197753
7-0.115772-0.98240.164606
8-0.072132-0.61210.271212
90.0621660.52750.299735
10-0.043159-0.36620.357639
110.1327091.12610.131938
12-0.00798-0.06770.473101
13-0.032981-0.27990.390197
14-0.039846-0.33810.368135
15-0.132917-1.12780.131567
16-0.083262-0.70650.241078
17-0.057127-0.48470.314665
180.0811550.68860.246638
19-0.04449-0.37750.353452
200.1116610.94750.173283
21-0.005173-0.04390.482557
220.1321371.12120.132961
230.0063560.05390.47857
24-0.132072-1.12070.133076
25-0.050394-0.42760.335108
260.1266241.07440.143107
270.0743060.63050.26518
28-0.024089-0.20440.419307
290.0543010.46080.323182
30-0.093091-0.78990.216089
31-0.147532-1.25190.107338
320.054330.4610.323093
33-0.141745-1.20270.116507
340.024210.20540.418908
35-0.0305-0.25880.398263
36-0.001087-0.00920.496334
370.0587450.49850.309838
38-0.067384-0.57180.284629
390.1447291.22810.111711
40-0.026236-0.22260.412231
410.0689180.58480.280259
420.000610.00520.497941
43-0.072689-0.61680.269661
44-0.035823-0.3040.381014
45-0.025703-0.21810.413986
460.0333930.28340.38886
470.0236220.20040.42085
48-0.012629-0.10720.457479

\begin{tabular}{lllllllll}
\hline
Partial Autocorrelation Function \tabularnewline
Time lag k & PACF(k) & T-STAT & P-value \tabularnewline
1 & -0.04212 & -0.3574 & 0.360919 \tabularnewline
2 & -0.093906 & -0.7968 & 0.214089 \tabularnewline
3 & 0.181906 & 1.5435 & 0.063544 \tabularnewline
4 & 0.092299 & 0.7832 & 0.218043 \tabularnewline
5 & -0.216837 & -1.8399 & 0.03495 \tabularnewline
6 & -0.100737 & -0.8548 & 0.197753 \tabularnewline
7 & -0.115772 & -0.9824 & 0.164606 \tabularnewline
8 & -0.072132 & -0.6121 & 0.271212 \tabularnewline
9 & 0.062166 & 0.5275 & 0.299735 \tabularnewline
10 & -0.043159 & -0.3662 & 0.357639 \tabularnewline
11 & 0.132709 & 1.1261 & 0.131938 \tabularnewline
12 & -0.00798 & -0.0677 & 0.473101 \tabularnewline
13 & -0.032981 & -0.2799 & 0.390197 \tabularnewline
14 & -0.039846 & -0.3381 & 0.368135 \tabularnewline
15 & -0.132917 & -1.1278 & 0.131567 \tabularnewline
16 & -0.083262 & -0.7065 & 0.241078 \tabularnewline
17 & -0.057127 & -0.4847 & 0.314665 \tabularnewline
18 & 0.081155 & 0.6886 & 0.246638 \tabularnewline
19 & -0.04449 & -0.3775 & 0.353452 \tabularnewline
20 & 0.111661 & 0.9475 & 0.173283 \tabularnewline
21 & -0.005173 & -0.0439 & 0.482557 \tabularnewline
22 & 0.132137 & 1.1212 & 0.132961 \tabularnewline
23 & 0.006356 & 0.0539 & 0.47857 \tabularnewline
24 & -0.132072 & -1.1207 & 0.133076 \tabularnewline
25 & -0.050394 & -0.4276 & 0.335108 \tabularnewline
26 & 0.126624 & 1.0744 & 0.143107 \tabularnewline
27 & 0.074306 & 0.6305 & 0.26518 \tabularnewline
28 & -0.024089 & -0.2044 & 0.419307 \tabularnewline
29 & 0.054301 & 0.4608 & 0.323182 \tabularnewline
30 & -0.093091 & -0.7899 & 0.216089 \tabularnewline
31 & -0.147532 & -1.2519 & 0.107338 \tabularnewline
32 & 0.05433 & 0.461 & 0.323093 \tabularnewline
33 & -0.141745 & -1.2027 & 0.116507 \tabularnewline
34 & 0.02421 & 0.2054 & 0.418908 \tabularnewline
35 & -0.0305 & -0.2588 & 0.398263 \tabularnewline
36 & -0.001087 & -0.0092 & 0.496334 \tabularnewline
37 & 0.058745 & 0.4985 & 0.309838 \tabularnewline
38 & -0.067384 & -0.5718 & 0.284629 \tabularnewline
39 & 0.144729 & 1.2281 & 0.111711 \tabularnewline
40 & -0.026236 & -0.2226 & 0.412231 \tabularnewline
41 & 0.068918 & 0.5848 & 0.280259 \tabularnewline
42 & 0.00061 & 0.0052 & 0.497941 \tabularnewline
43 & -0.072689 & -0.6168 & 0.269661 \tabularnewline
44 & -0.035823 & -0.304 & 0.381014 \tabularnewline
45 & -0.025703 & -0.2181 & 0.413986 \tabularnewline
46 & 0.033393 & 0.2834 & 0.38886 \tabularnewline
47 & 0.023622 & 0.2004 & 0.42085 \tabularnewline
48 & -0.012629 & -0.1072 & 0.457479 \tabularnewline
\hline
\end{tabular}
%Source: https://freestatistics.org/blog/index.php?pk=40069&T=2

[TABLE]
[ROW][C]Partial Autocorrelation Function[/C][/ROW]
[ROW][C]Time lag k[/C][C]PACF(k)[/C][C]T-STAT[/C][C]P-value[/C][/ROW]
[ROW][C]1[/C][C]-0.04212[/C][C]-0.3574[/C][C]0.360919[/C][/ROW]
[ROW][C]2[/C][C]-0.093906[/C][C]-0.7968[/C][C]0.214089[/C][/ROW]
[ROW][C]3[/C][C]0.181906[/C][C]1.5435[/C][C]0.063544[/C][/ROW]
[ROW][C]4[/C][C]0.092299[/C][C]0.7832[/C][C]0.218043[/C][/ROW]
[ROW][C]5[/C][C]-0.216837[/C][C]-1.8399[/C][C]0.03495[/C][/ROW]
[ROW][C]6[/C][C]-0.100737[/C][C]-0.8548[/C][C]0.197753[/C][/ROW]
[ROW][C]7[/C][C]-0.115772[/C][C]-0.9824[/C][C]0.164606[/C][/ROW]
[ROW][C]8[/C][C]-0.072132[/C][C]-0.6121[/C][C]0.271212[/C][/ROW]
[ROW][C]9[/C][C]0.062166[/C][C]0.5275[/C][C]0.299735[/C][/ROW]
[ROW][C]10[/C][C]-0.043159[/C][C]-0.3662[/C][C]0.357639[/C][/ROW]
[ROW][C]11[/C][C]0.132709[/C][C]1.1261[/C][C]0.131938[/C][/ROW]
[ROW][C]12[/C][C]-0.00798[/C][C]-0.0677[/C][C]0.473101[/C][/ROW]
[ROW][C]13[/C][C]-0.032981[/C][C]-0.2799[/C][C]0.390197[/C][/ROW]
[ROW][C]14[/C][C]-0.039846[/C][C]-0.3381[/C][C]0.368135[/C][/ROW]
[ROW][C]15[/C][C]-0.132917[/C][C]-1.1278[/C][C]0.131567[/C][/ROW]
[ROW][C]16[/C][C]-0.083262[/C][C]-0.7065[/C][C]0.241078[/C][/ROW]
[ROW][C]17[/C][C]-0.057127[/C][C]-0.4847[/C][C]0.314665[/C][/ROW]
[ROW][C]18[/C][C]0.081155[/C][C]0.6886[/C][C]0.246638[/C][/ROW]
[ROW][C]19[/C][C]-0.04449[/C][C]-0.3775[/C][C]0.353452[/C][/ROW]
[ROW][C]20[/C][C]0.111661[/C][C]0.9475[/C][C]0.173283[/C][/ROW]
[ROW][C]21[/C][C]-0.005173[/C][C]-0.0439[/C][C]0.482557[/C][/ROW]
[ROW][C]22[/C][C]0.132137[/C][C]1.1212[/C][C]0.132961[/C][/ROW]
[ROW][C]23[/C][C]0.006356[/C][C]0.0539[/C][C]0.47857[/C][/ROW]
[ROW][C]24[/C][C]-0.132072[/C][C]-1.1207[/C][C]0.133076[/C][/ROW]
[ROW][C]25[/C][C]-0.050394[/C][C]-0.4276[/C][C]0.335108[/C][/ROW]
[ROW][C]26[/C][C]0.126624[/C][C]1.0744[/C][C]0.143107[/C][/ROW]
[ROW][C]27[/C][C]0.074306[/C][C]0.6305[/C][C]0.26518[/C][/ROW]
[ROW][C]28[/C][C]-0.024089[/C][C]-0.2044[/C][C]0.419307[/C][/ROW]
[ROW][C]29[/C][C]0.054301[/C][C]0.4608[/C][C]0.323182[/C][/ROW]
[ROW][C]30[/C][C]-0.093091[/C][C]-0.7899[/C][C]0.216089[/C][/ROW]
[ROW][C]31[/C][C]-0.147532[/C][C]-1.2519[/C][C]0.107338[/C][/ROW]
[ROW][C]32[/C][C]0.05433[/C][C]0.461[/C][C]0.323093[/C][/ROW]
[ROW][C]33[/C][C]-0.141745[/C][C]-1.2027[/C][C]0.116507[/C][/ROW]
[ROW][C]34[/C][C]0.02421[/C][C]0.2054[/C][C]0.418908[/C][/ROW]
[ROW][C]35[/C][C]-0.0305[/C][C]-0.2588[/C][C]0.398263[/C][/ROW]
[ROW][C]36[/C][C]-0.001087[/C][C]-0.0092[/C][C]0.496334[/C][/ROW]
[ROW][C]37[/C][C]0.058745[/C][C]0.4985[/C][C]0.309838[/C][/ROW]
[ROW][C]38[/C][C]-0.067384[/C][C]-0.5718[/C][C]0.284629[/C][/ROW]
[ROW][C]39[/C][C]0.144729[/C][C]1.2281[/C][C]0.111711[/C][/ROW]
[ROW][C]40[/C][C]-0.026236[/C][C]-0.2226[/C][C]0.412231[/C][/ROW]
[ROW][C]41[/C][C]0.068918[/C][C]0.5848[/C][C]0.280259[/C][/ROW]
[ROW][C]42[/C][C]0.00061[/C][C]0.0052[/C][C]0.497941[/C][/ROW]
[ROW][C]43[/C][C]-0.072689[/C][C]-0.6168[/C][C]0.269661[/C][/ROW]
[ROW][C]44[/C][C]-0.035823[/C][C]-0.304[/C][C]0.381014[/C][/ROW]
[ROW][C]45[/C][C]-0.025703[/C][C]-0.2181[/C][C]0.413986[/C][/ROW]
[ROW][C]46[/C][C]0.033393[/C][C]0.2834[/C][C]0.38886[/C][/ROW]
[ROW][C]47[/C][C]0.023622[/C][C]0.2004[/C][C]0.42085[/C][/ROW]
[ROW][C]48[/C][C]-0.012629[/C][C]-0.1072[/C][C]0.457479[/C][/ROW]
[/TABLE]
Source: https://freestatistics.org/blog/index.php?pk=40069&T=2

Globally Unique Identifier (entire table): ba.freestatistics.org/blog/index.php?pk=40069&T=2

As an alternative you can also use a QR Code:  

The GUIDs for individual cells are displayed in the table below:

Partial Autocorrelation Function
Time lag kPACF(k)T-STATP-value
1-0.04212-0.35740.360919
2-0.093906-0.79680.214089
30.1819061.54350.063544
40.0922990.78320.218043
5-0.216837-1.83990.03495
6-0.100737-0.85480.197753
7-0.115772-0.98240.164606
8-0.072132-0.61210.271212
90.0621660.52750.299735
10-0.043159-0.36620.357639
110.1327091.12610.131938
12-0.00798-0.06770.473101
13-0.032981-0.27990.390197
14-0.039846-0.33810.368135
15-0.132917-1.12780.131567
16-0.083262-0.70650.241078
17-0.057127-0.48470.314665
180.0811550.68860.246638
19-0.04449-0.37750.353452
200.1116610.94750.173283
21-0.005173-0.04390.482557
220.1321371.12120.132961
230.0063560.05390.47857
24-0.132072-1.12070.133076
25-0.050394-0.42760.335108
260.1266241.07440.143107
270.0743060.63050.26518
28-0.024089-0.20440.419307
290.0543010.46080.323182
30-0.093091-0.78990.216089
31-0.147532-1.25190.107338
320.054330.4610.323093
33-0.141745-1.20270.116507
340.024210.20540.418908
35-0.0305-0.25880.398263
36-0.001087-0.00920.496334
370.0587450.49850.309838
38-0.067384-0.57180.284629
390.1447291.22810.111711
40-0.026236-0.22260.412231
410.0689180.58480.280259
420.000610.00520.497941
43-0.072689-0.61680.269661
44-0.035823-0.3040.381014
45-0.025703-0.21810.413986
460.0333930.28340.38886
470.0236220.20040.42085
48-0.012629-0.10720.457479


Parameters (Session):
par1 = 48 ; par2 = 1 ; par3 = 1 ; par4 = 0 ; par5 = 12 ;
Parameters (R input):
par1 = 48 ; par2 = 1 ; par3 = 1 ; par4 = 0 ; par5 = 12 ;
R code (references can be found in the software module):
if (par1 == 'Default') {
par1 = 10*log10(length(x))
} else {
par1 <- as.numeric(par1)
}
par2 <- as.numeric(par2)
par3 <- as.numeric(par3)
par4 <- as.numeric(par4)
par5 <- as.numeric(par5)
if (par2 == 0) {
x <- log(x)
} else {
x <- (x ^ par2 - 1) / par2
}
if (par3 > 0) x <- diff(x,lag=1,difference=par3)
if (par4 > 0) x <- diff(x,lag=par5,difference=par4)
bitmap(file='pic1.png')
racf <- acf(x,par1,main='Autocorrelation',xlab='lags',ylab='ACF')
dev.off()
bitmap(file='pic2.png')
rpacf <- pacf(x,par1,main='Partial Autocorrelation',xlab='lags',ylab='PACF')
dev.off()
(myacf <- c(racf$acf))
(mypacf <- c(rpacf$acf))
lengthx <- length(x)
sqrtn <- sqrt(lengthx)
load(file='createtable')
a<-table.start()
a<-table.row.start(a)
a<-table.element(a,'Autocorrelation Function',4,TRUE)
a<-table.row.end(a)
a<-table.row.start(a)
a<-table.element(a,'Time lag k',header=TRUE)
a<-table.element(a,hyperlink('basics.htm','ACF(k)','click here for more information about the Autocorrelation Function'),header=TRUE)
a<-table.element(a,'T-STAT',header=TRUE)
a<-table.element(a,'P-value',header=TRUE)
a<-table.row.end(a)
for (i in 2:(par1+1)) {
a<-table.row.start(a)
a<-table.element(a,i-1,header=TRUE)
a<-table.element(a,round(myacf[i],6))
mytstat <- myacf[i]*sqrtn
a<-table.element(a,round(mytstat,4))
a<-table.element(a,round(1-pt(abs(mytstat),lengthx),6))
a<-table.row.end(a)
}
a<-table.end(a)
table.save(a,file='mytable.tab')
a<-table.start()
a<-table.row.start(a)
a<-table.element(a,'Partial Autocorrelation Function',4,TRUE)
a<-table.row.end(a)
a<-table.row.start(a)
a<-table.element(a,'Time lag k',header=TRUE)
a<-table.element(a,hyperlink('basics.htm','PACF(k)','click here for more information about the Partial Autocorrelation Function'),header=TRUE)
a<-table.element(a,'T-STAT',header=TRUE)
a<-table.element(a,'P-value',header=TRUE)
a<-table.row.end(a)
for (i in 1:par1) {
a<-table.row.start(a)
a<-table.element(a,i,header=TRUE)
a<-table.element(a,round(mypacf[i],6))
mytstat <- mypacf[i]*sqrtn
a<-table.element(a,round(mytstat,4))
a<-table.element(a,round(1-pt(abs(mytstat),lengthx),6))
a<-table.row.end(a)
}
a<-table.end(a)
table.save(a,file='mytable1.tab')