Free Statistics

of Irreproducible Research!

Author's title

Author*Unverified author*
R Software Modulerwasp_autocorrelation.wasp
Title produced by software(Partial) Autocorrelation Function
Date of computationThu, 14 May 2009 11:36:27 -0600
Cite this page as followsStatistical Computations at FreeStatistics.org, Office for Research Development and Education, URL https://freestatistics.org/blog/index.php?v=date/2009/May/14/t12423227043sqotx3dxyrdj86.htm/, Retrieved Mon, 29 Apr 2024 01:08:54 +0000
Statistical Computations at FreeStatistics.org, Office for Research Development and Education, URL https://freestatistics.org/blog/index.php?pk=40059, Retrieved Mon, 29 Apr 2024 01:08:54 +0000
QR Codes:

Original text written by user:
IsPrivate?No (this computation is public)
User-defined keywords
Estimated Impact104
Family? (F = Feedback message, R = changed R code, M = changed R Module, P = changed Parameters, D = changed Data)
-       [(Partial) Autocorrelation Function] [degree of non-sea...] [2009-05-14 17:36:27] [8066ce735b3f8beadb711a8680cf7d00] [Current]
Feedback Forum

Post a new message
Dataseries X:
517
510
509
501
507
569
580
578
565
547
555
562
561
555
544
537
543
594
611
613
611
594
595
591
589
584
573
567
569
621
629
628
612
595
597
593
590
580
574
573
573
620
626
620
588
566
557
561
549
532
526
511
499
555
565
542
527
510
514
517
508
493
490
469
478
528
534
518
506
502
516
528


Summary of computational transaction
Raw Inputview raw input (R code)
Raw Outputview raw output of R engine
Computing time2 seconds
R Server'Sir Ronald Aylmer Fisher' @ 193.190.124.24

\begin{tabular}{lllllllll}
\hline
Summary of computational transaction \tabularnewline
Raw Input & view raw input (R code)  \tabularnewline
Raw Output & view raw output of R engine  \tabularnewline
Computing time & 2 seconds \tabularnewline
R Server & 'Sir Ronald Aylmer Fisher' @ 193.190.124.24 \tabularnewline
\hline
\end{tabular}
%Source: https://freestatistics.org/blog/index.php?pk=40059&T=0

[TABLE]
[ROW][C]Summary of computational transaction[/C][/ROW]
[ROW][C]Raw Input[/C][C]view raw input (R code) [/C][/ROW]
[ROW][C]Raw Output[/C][C]view raw output of R engine [/C][/ROW]
[ROW][C]Computing time[/C][C]2 seconds[/C][/ROW]
[ROW][C]R Server[/C][C]'Sir Ronald Aylmer Fisher' @ 193.190.124.24[/C][/ROW]
[/TABLE]
Source: https://freestatistics.org/blog/index.php?pk=40059&T=0

Globally Unique Identifier (entire table): ba.freestatistics.org/blog/index.php?pk=40059&T=0

As an alternative you can also use a QR Code:  

The GUIDs for individual cells are displayed in the table below:

Summary of computational transaction
Raw Inputview raw input (R code)
Raw Outputview raw output of R engine
Computing time2 seconds
R Server'Sir Ronald Aylmer Fisher' @ 193.190.124.24


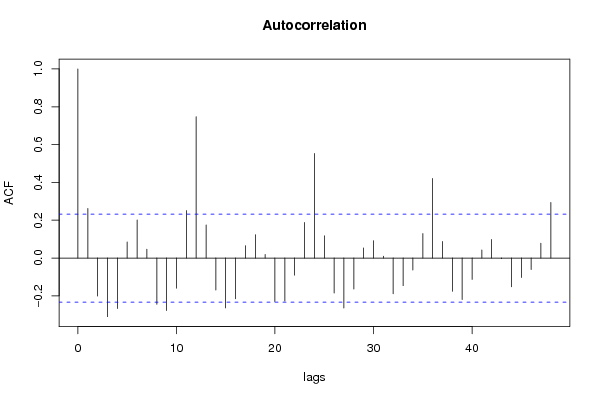
Autocorrelation Function
Time lag kACF(k)T-STATP-value
10.261872.20660.01529
2-0.20102-1.69380.047341
3-0.309947-2.61170.005494
4-0.267141-2.2510.013742
50.0852210.71810.23753
60.2014981.69790.046957
70.0470980.39690.346332
8-0.244639-2.06140.021466
9-0.277805-2.34080.011027
10-0.159203-1.34150.092022
110.2509912.11490.018975
120.7477426.30060
130.1748611.47340.072531
14-0.168781-1.42220.079677
15-0.263621-2.22130.01476
16-0.215712-1.81760.03667
170.064730.54540.293584
180.1237431.04270.150317
190.019330.16290.435538
20-0.230224-1.93990.028182
21-0.227703-1.91870.029524
22-0.090601-0.76340.223873
230.1880991.58490.058711
240.553454.66357e-06
250.1172760.98820.163209
26-0.184602-1.55550.062139
27-0.264345-2.22740.014546
28-0.163441-1.37720.086392
290.0537470.45290.326008
300.0915570.77150.221494
310.0099920.08420.466569
32-0.18945-1.59630.057428
33-0.145917-1.22950.111468
34-0.063854-0.5380.296114
350.1291991.08860.139995
360.4208723.54630.000348
370.0875090.73740.231667
38-0.175586-1.47950.071714
39-0.219303-1.84790.034393
40-0.112911-0.95140.172312
410.0422290.35580.361511
420.0977610.82380.20642
43-0.003206-0.0270.489264
44-0.152089-1.28150.10209
45-0.103298-0.87040.193507
46-0.061138-0.51520.304021
470.078030.65750.256496
480.2943652.48040.007749

\begin{tabular}{lllllllll}
\hline
Autocorrelation Function \tabularnewline
Time lag k & ACF(k) & T-STAT & P-value \tabularnewline
1 & 0.26187 & 2.2066 & 0.01529 \tabularnewline
2 & -0.20102 & -1.6938 & 0.047341 \tabularnewline
3 & -0.309947 & -2.6117 & 0.005494 \tabularnewline
4 & -0.267141 & -2.251 & 0.013742 \tabularnewline
5 & 0.085221 & 0.7181 & 0.23753 \tabularnewline
6 & 0.201498 & 1.6979 & 0.046957 \tabularnewline
7 & 0.047098 & 0.3969 & 0.346332 \tabularnewline
8 & -0.244639 & -2.0614 & 0.021466 \tabularnewline
9 & -0.277805 & -2.3408 & 0.011027 \tabularnewline
10 & -0.159203 & -1.3415 & 0.092022 \tabularnewline
11 & 0.250991 & 2.1149 & 0.018975 \tabularnewline
12 & 0.747742 & 6.3006 & 0 \tabularnewline
13 & 0.174861 & 1.4734 & 0.072531 \tabularnewline
14 & -0.168781 & -1.4222 & 0.079677 \tabularnewline
15 & -0.263621 & -2.2213 & 0.01476 \tabularnewline
16 & -0.215712 & -1.8176 & 0.03667 \tabularnewline
17 & 0.06473 & 0.5454 & 0.293584 \tabularnewline
18 & 0.123743 & 1.0427 & 0.150317 \tabularnewline
19 & 0.01933 & 0.1629 & 0.435538 \tabularnewline
20 & -0.230224 & -1.9399 & 0.028182 \tabularnewline
21 & -0.227703 & -1.9187 & 0.029524 \tabularnewline
22 & -0.090601 & -0.7634 & 0.223873 \tabularnewline
23 & 0.188099 & 1.5849 & 0.058711 \tabularnewline
24 & 0.55345 & 4.6635 & 7e-06 \tabularnewline
25 & 0.117276 & 0.9882 & 0.163209 \tabularnewline
26 & -0.184602 & -1.5555 & 0.062139 \tabularnewline
27 & -0.264345 & -2.2274 & 0.014546 \tabularnewline
28 & -0.163441 & -1.3772 & 0.086392 \tabularnewline
29 & 0.053747 & 0.4529 & 0.326008 \tabularnewline
30 & 0.091557 & 0.7715 & 0.221494 \tabularnewline
31 & 0.009992 & 0.0842 & 0.466569 \tabularnewline
32 & -0.18945 & -1.5963 & 0.057428 \tabularnewline
33 & -0.145917 & -1.2295 & 0.111468 \tabularnewline
34 & -0.063854 & -0.538 & 0.296114 \tabularnewline
35 & 0.129199 & 1.0886 & 0.139995 \tabularnewline
36 & 0.420872 & 3.5463 & 0.000348 \tabularnewline
37 & 0.087509 & 0.7374 & 0.231667 \tabularnewline
38 & -0.175586 & -1.4795 & 0.071714 \tabularnewline
39 & -0.219303 & -1.8479 & 0.034393 \tabularnewline
40 & -0.112911 & -0.9514 & 0.172312 \tabularnewline
41 & 0.042229 & 0.3558 & 0.361511 \tabularnewline
42 & 0.097761 & 0.8238 & 0.20642 \tabularnewline
43 & -0.003206 & -0.027 & 0.489264 \tabularnewline
44 & -0.152089 & -1.2815 & 0.10209 \tabularnewline
45 & -0.103298 & -0.8704 & 0.193507 \tabularnewline
46 & -0.061138 & -0.5152 & 0.304021 \tabularnewline
47 & 0.07803 & 0.6575 & 0.256496 \tabularnewline
48 & 0.294365 & 2.4804 & 0.007749 \tabularnewline
\hline
\end{tabular}
%Source: https://freestatistics.org/blog/index.php?pk=40059&T=1

[TABLE]
[ROW][C]Autocorrelation Function[/C][/ROW]
[ROW][C]Time lag k[/C][C]ACF(k)[/C][C]T-STAT[/C][C]P-value[/C][/ROW]
[ROW][C]1[/C][C]0.26187[/C][C]2.2066[/C][C]0.01529[/C][/ROW]
[ROW][C]2[/C][C]-0.20102[/C][C]-1.6938[/C][C]0.047341[/C][/ROW]
[ROW][C]3[/C][C]-0.309947[/C][C]-2.6117[/C][C]0.005494[/C][/ROW]
[ROW][C]4[/C][C]-0.267141[/C][C]-2.251[/C][C]0.013742[/C][/ROW]
[ROW][C]5[/C][C]0.085221[/C][C]0.7181[/C][C]0.23753[/C][/ROW]
[ROW][C]6[/C][C]0.201498[/C][C]1.6979[/C][C]0.046957[/C][/ROW]
[ROW][C]7[/C][C]0.047098[/C][C]0.3969[/C][C]0.346332[/C][/ROW]
[ROW][C]8[/C][C]-0.244639[/C][C]-2.0614[/C][C]0.021466[/C][/ROW]
[ROW][C]9[/C][C]-0.277805[/C][C]-2.3408[/C][C]0.011027[/C][/ROW]
[ROW][C]10[/C][C]-0.159203[/C][C]-1.3415[/C][C]0.092022[/C][/ROW]
[ROW][C]11[/C][C]0.250991[/C][C]2.1149[/C][C]0.018975[/C][/ROW]
[ROW][C]12[/C][C]0.747742[/C][C]6.3006[/C][C]0[/C][/ROW]
[ROW][C]13[/C][C]0.174861[/C][C]1.4734[/C][C]0.072531[/C][/ROW]
[ROW][C]14[/C][C]-0.168781[/C][C]-1.4222[/C][C]0.079677[/C][/ROW]
[ROW][C]15[/C][C]-0.263621[/C][C]-2.2213[/C][C]0.01476[/C][/ROW]
[ROW][C]16[/C][C]-0.215712[/C][C]-1.8176[/C][C]0.03667[/C][/ROW]
[ROW][C]17[/C][C]0.06473[/C][C]0.5454[/C][C]0.293584[/C][/ROW]
[ROW][C]18[/C][C]0.123743[/C][C]1.0427[/C][C]0.150317[/C][/ROW]
[ROW][C]19[/C][C]0.01933[/C][C]0.1629[/C][C]0.435538[/C][/ROW]
[ROW][C]20[/C][C]-0.230224[/C][C]-1.9399[/C][C]0.028182[/C][/ROW]
[ROW][C]21[/C][C]-0.227703[/C][C]-1.9187[/C][C]0.029524[/C][/ROW]
[ROW][C]22[/C][C]-0.090601[/C][C]-0.7634[/C][C]0.223873[/C][/ROW]
[ROW][C]23[/C][C]0.188099[/C][C]1.5849[/C][C]0.058711[/C][/ROW]
[ROW][C]24[/C][C]0.55345[/C][C]4.6635[/C][C]7e-06[/C][/ROW]
[ROW][C]25[/C][C]0.117276[/C][C]0.9882[/C][C]0.163209[/C][/ROW]
[ROW][C]26[/C][C]-0.184602[/C][C]-1.5555[/C][C]0.062139[/C][/ROW]
[ROW][C]27[/C][C]-0.264345[/C][C]-2.2274[/C][C]0.014546[/C][/ROW]
[ROW][C]28[/C][C]-0.163441[/C][C]-1.3772[/C][C]0.086392[/C][/ROW]
[ROW][C]29[/C][C]0.053747[/C][C]0.4529[/C][C]0.326008[/C][/ROW]
[ROW][C]30[/C][C]0.091557[/C][C]0.7715[/C][C]0.221494[/C][/ROW]
[ROW][C]31[/C][C]0.009992[/C][C]0.0842[/C][C]0.466569[/C][/ROW]
[ROW][C]32[/C][C]-0.18945[/C][C]-1.5963[/C][C]0.057428[/C][/ROW]
[ROW][C]33[/C][C]-0.145917[/C][C]-1.2295[/C][C]0.111468[/C][/ROW]
[ROW][C]34[/C][C]-0.063854[/C][C]-0.538[/C][C]0.296114[/C][/ROW]
[ROW][C]35[/C][C]0.129199[/C][C]1.0886[/C][C]0.139995[/C][/ROW]
[ROW][C]36[/C][C]0.420872[/C][C]3.5463[/C][C]0.000348[/C][/ROW]
[ROW][C]37[/C][C]0.087509[/C][C]0.7374[/C][C]0.231667[/C][/ROW]
[ROW][C]38[/C][C]-0.175586[/C][C]-1.4795[/C][C]0.071714[/C][/ROW]
[ROW][C]39[/C][C]-0.219303[/C][C]-1.8479[/C][C]0.034393[/C][/ROW]
[ROW][C]40[/C][C]-0.112911[/C][C]-0.9514[/C][C]0.172312[/C][/ROW]
[ROW][C]41[/C][C]0.042229[/C][C]0.3558[/C][C]0.361511[/C][/ROW]
[ROW][C]42[/C][C]0.097761[/C][C]0.8238[/C][C]0.20642[/C][/ROW]
[ROW][C]43[/C][C]-0.003206[/C][C]-0.027[/C][C]0.489264[/C][/ROW]
[ROW][C]44[/C][C]-0.152089[/C][C]-1.2815[/C][C]0.10209[/C][/ROW]
[ROW][C]45[/C][C]-0.103298[/C][C]-0.8704[/C][C]0.193507[/C][/ROW]
[ROW][C]46[/C][C]-0.061138[/C][C]-0.5152[/C][C]0.304021[/C][/ROW]
[ROW][C]47[/C][C]0.07803[/C][C]0.6575[/C][C]0.256496[/C][/ROW]
[ROW][C]48[/C][C]0.294365[/C][C]2.4804[/C][C]0.007749[/C][/ROW]
[/TABLE]
Source: https://freestatistics.org/blog/index.php?pk=40059&T=1

Globally Unique Identifier (entire table): ba.freestatistics.org/blog/index.php?pk=40059&T=1

As an alternative you can also use a QR Code:  

The GUIDs for individual cells are displayed in the table below:

Autocorrelation Function
Time lag kACF(k)T-STATP-value
10.261872.20660.01529
2-0.20102-1.69380.047341
3-0.309947-2.61170.005494
4-0.267141-2.2510.013742
50.0852210.71810.23753
60.2014981.69790.046957
70.0470980.39690.346332
8-0.244639-2.06140.021466
9-0.277805-2.34080.011027
10-0.159203-1.34150.092022
110.2509912.11490.018975
120.7477426.30060
130.1748611.47340.072531
14-0.168781-1.42220.079677
15-0.263621-2.22130.01476
16-0.215712-1.81760.03667
170.064730.54540.293584
180.1237431.04270.150317
190.019330.16290.435538
20-0.230224-1.93990.028182
21-0.227703-1.91870.029524
22-0.090601-0.76340.223873
230.1880991.58490.058711
240.553454.66357e-06
250.1172760.98820.163209
26-0.184602-1.55550.062139
27-0.264345-2.22740.014546
28-0.163441-1.37720.086392
290.0537470.45290.326008
300.0915570.77150.221494
310.0099920.08420.466569
32-0.18945-1.59630.057428
33-0.145917-1.22950.111468
34-0.063854-0.5380.296114
350.1291991.08860.139995
360.4208723.54630.000348
370.0875090.73740.231667
38-0.175586-1.47950.071714
39-0.219303-1.84790.034393
40-0.112911-0.95140.172312
410.0422290.35580.361511
420.0977610.82380.20642
43-0.003206-0.0270.489264
44-0.152089-1.28150.10209
45-0.103298-0.87040.193507
46-0.061138-0.51520.304021
470.078030.65750.256496
480.2943652.48040.007749


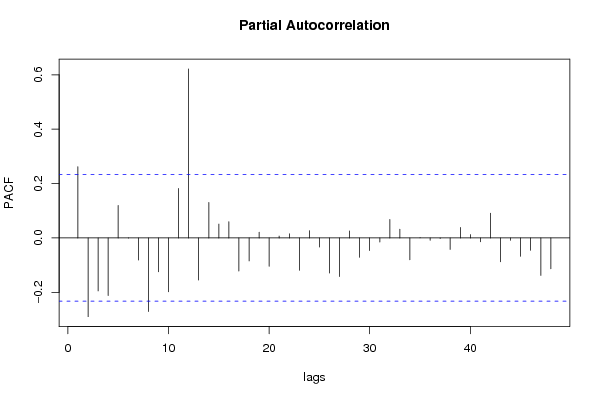
Partial Autocorrelation Function
Time lag kPACF(k)T-STATP-value
10.261872.20660.01529
2-0.289445-2.43890.008617
3-0.194837-1.64170.052534
4-0.211814-1.78480.039284
50.1193751.00590.158946
6-0.000897-0.00760.496994
7-0.080825-0.6810.24903
8-0.270581-2.280.012808
9-0.124048-1.04530.149726
10-0.197666-1.66560.050104
110.182081.53420.064708
120.6217855.23931e-06
13-0.154884-1.30510.09804
140.1309241.10320.136837
150.0509490.42930.334502
160.0594870.50120.308873
17-0.121475-1.02360.154758
18-0.08432-0.71050.239864
190.0210670.17750.429804
20-0.103874-0.87530.192192
210.0068570.05780.477043
220.015180.12790.449292
23-0.119103-1.00360.159496
240.0268970.22660.410678
25-0.033368-0.28120.3897
26-0.128775-1.08510.140779
27-0.141755-1.19440.118139
280.0255190.2150.415181
29-0.071256-0.60040.275071
30-0.04627-0.38990.348897
31-0.014682-0.12370.450947
320.0681340.57410.283854
330.032430.27330.392722
34-0.079888-0.67310.251519
350.0006060.00510.497969
36-0.00862-0.07260.47115
37-0.002043-0.01720.493156
38-0.042049-0.35430.362078
390.0384670.32410.373396
400.0124970.10530.458215
41-0.01425-0.12010.452383
420.0907510.76470.223498
43-0.087733-0.73930.231094
44-0.008826-0.07440.470463
45-0.067524-0.5690.285587
46-0.045169-0.38060.352317
47-0.137721-1.16050.124874
48-0.113393-0.95550.171292

\begin{tabular}{lllllllll}
\hline
Partial Autocorrelation Function \tabularnewline
Time lag k & PACF(k) & T-STAT & P-value \tabularnewline
1 & 0.26187 & 2.2066 & 0.01529 \tabularnewline
2 & -0.289445 & -2.4389 & 0.008617 \tabularnewline
3 & -0.194837 & -1.6417 & 0.052534 \tabularnewline
4 & -0.211814 & -1.7848 & 0.039284 \tabularnewline
5 & 0.119375 & 1.0059 & 0.158946 \tabularnewline
6 & -0.000897 & -0.0076 & 0.496994 \tabularnewline
7 & -0.080825 & -0.681 & 0.24903 \tabularnewline
8 & -0.270581 & -2.28 & 0.012808 \tabularnewline
9 & -0.124048 & -1.0453 & 0.149726 \tabularnewline
10 & -0.197666 & -1.6656 & 0.050104 \tabularnewline
11 & 0.18208 & 1.5342 & 0.064708 \tabularnewline
12 & 0.621785 & 5.2393 & 1e-06 \tabularnewline
13 & -0.154884 & -1.3051 & 0.09804 \tabularnewline
14 & 0.130924 & 1.1032 & 0.136837 \tabularnewline
15 & 0.050949 & 0.4293 & 0.334502 \tabularnewline
16 & 0.059487 & 0.5012 & 0.308873 \tabularnewline
17 & -0.121475 & -1.0236 & 0.154758 \tabularnewline
18 & -0.08432 & -0.7105 & 0.239864 \tabularnewline
19 & 0.021067 & 0.1775 & 0.429804 \tabularnewline
20 & -0.103874 & -0.8753 & 0.192192 \tabularnewline
21 & 0.006857 & 0.0578 & 0.477043 \tabularnewline
22 & 0.01518 & 0.1279 & 0.449292 \tabularnewline
23 & -0.119103 & -1.0036 & 0.159496 \tabularnewline
24 & 0.026897 & 0.2266 & 0.410678 \tabularnewline
25 & -0.033368 & -0.2812 & 0.3897 \tabularnewline
26 & -0.128775 & -1.0851 & 0.140779 \tabularnewline
27 & -0.141755 & -1.1944 & 0.118139 \tabularnewline
28 & 0.025519 & 0.215 & 0.415181 \tabularnewline
29 & -0.071256 & -0.6004 & 0.275071 \tabularnewline
30 & -0.04627 & -0.3899 & 0.348897 \tabularnewline
31 & -0.014682 & -0.1237 & 0.450947 \tabularnewline
32 & 0.068134 & 0.5741 & 0.283854 \tabularnewline
33 & 0.03243 & 0.2733 & 0.392722 \tabularnewline
34 & -0.079888 & -0.6731 & 0.251519 \tabularnewline
35 & 0.000606 & 0.0051 & 0.497969 \tabularnewline
36 & -0.00862 & -0.0726 & 0.47115 \tabularnewline
37 & -0.002043 & -0.0172 & 0.493156 \tabularnewline
38 & -0.042049 & -0.3543 & 0.362078 \tabularnewline
39 & 0.038467 & 0.3241 & 0.373396 \tabularnewline
40 & 0.012497 & 0.1053 & 0.458215 \tabularnewline
41 & -0.01425 & -0.1201 & 0.452383 \tabularnewline
42 & 0.090751 & 0.7647 & 0.223498 \tabularnewline
43 & -0.087733 & -0.7393 & 0.231094 \tabularnewline
44 & -0.008826 & -0.0744 & 0.470463 \tabularnewline
45 & -0.067524 & -0.569 & 0.285587 \tabularnewline
46 & -0.045169 & -0.3806 & 0.352317 \tabularnewline
47 & -0.137721 & -1.1605 & 0.124874 \tabularnewline
48 & -0.113393 & -0.9555 & 0.171292 \tabularnewline
\hline
\end{tabular}
%Source: https://freestatistics.org/blog/index.php?pk=40059&T=2

[TABLE]
[ROW][C]Partial Autocorrelation Function[/C][/ROW]
[ROW][C]Time lag k[/C][C]PACF(k)[/C][C]T-STAT[/C][C]P-value[/C][/ROW]
[ROW][C]1[/C][C]0.26187[/C][C]2.2066[/C][C]0.01529[/C][/ROW]
[ROW][C]2[/C][C]-0.289445[/C][C]-2.4389[/C][C]0.008617[/C][/ROW]
[ROW][C]3[/C][C]-0.194837[/C][C]-1.6417[/C][C]0.052534[/C][/ROW]
[ROW][C]4[/C][C]-0.211814[/C][C]-1.7848[/C][C]0.039284[/C][/ROW]
[ROW][C]5[/C][C]0.119375[/C][C]1.0059[/C][C]0.158946[/C][/ROW]
[ROW][C]6[/C][C]-0.000897[/C][C]-0.0076[/C][C]0.496994[/C][/ROW]
[ROW][C]7[/C][C]-0.080825[/C][C]-0.681[/C][C]0.24903[/C][/ROW]
[ROW][C]8[/C][C]-0.270581[/C][C]-2.28[/C][C]0.012808[/C][/ROW]
[ROW][C]9[/C][C]-0.124048[/C][C]-1.0453[/C][C]0.149726[/C][/ROW]
[ROW][C]10[/C][C]-0.197666[/C][C]-1.6656[/C][C]0.050104[/C][/ROW]
[ROW][C]11[/C][C]0.18208[/C][C]1.5342[/C][C]0.064708[/C][/ROW]
[ROW][C]12[/C][C]0.621785[/C][C]5.2393[/C][C]1e-06[/C][/ROW]
[ROW][C]13[/C][C]-0.154884[/C][C]-1.3051[/C][C]0.09804[/C][/ROW]
[ROW][C]14[/C][C]0.130924[/C][C]1.1032[/C][C]0.136837[/C][/ROW]
[ROW][C]15[/C][C]0.050949[/C][C]0.4293[/C][C]0.334502[/C][/ROW]
[ROW][C]16[/C][C]0.059487[/C][C]0.5012[/C][C]0.308873[/C][/ROW]
[ROW][C]17[/C][C]-0.121475[/C][C]-1.0236[/C][C]0.154758[/C][/ROW]
[ROW][C]18[/C][C]-0.08432[/C][C]-0.7105[/C][C]0.239864[/C][/ROW]
[ROW][C]19[/C][C]0.021067[/C][C]0.1775[/C][C]0.429804[/C][/ROW]
[ROW][C]20[/C][C]-0.103874[/C][C]-0.8753[/C][C]0.192192[/C][/ROW]
[ROW][C]21[/C][C]0.006857[/C][C]0.0578[/C][C]0.477043[/C][/ROW]
[ROW][C]22[/C][C]0.01518[/C][C]0.1279[/C][C]0.449292[/C][/ROW]
[ROW][C]23[/C][C]-0.119103[/C][C]-1.0036[/C][C]0.159496[/C][/ROW]
[ROW][C]24[/C][C]0.026897[/C][C]0.2266[/C][C]0.410678[/C][/ROW]
[ROW][C]25[/C][C]-0.033368[/C][C]-0.2812[/C][C]0.3897[/C][/ROW]
[ROW][C]26[/C][C]-0.128775[/C][C]-1.0851[/C][C]0.140779[/C][/ROW]
[ROW][C]27[/C][C]-0.141755[/C][C]-1.1944[/C][C]0.118139[/C][/ROW]
[ROW][C]28[/C][C]0.025519[/C][C]0.215[/C][C]0.415181[/C][/ROW]
[ROW][C]29[/C][C]-0.071256[/C][C]-0.6004[/C][C]0.275071[/C][/ROW]
[ROW][C]30[/C][C]-0.04627[/C][C]-0.3899[/C][C]0.348897[/C][/ROW]
[ROW][C]31[/C][C]-0.014682[/C][C]-0.1237[/C][C]0.450947[/C][/ROW]
[ROW][C]32[/C][C]0.068134[/C][C]0.5741[/C][C]0.283854[/C][/ROW]
[ROW][C]33[/C][C]0.03243[/C][C]0.2733[/C][C]0.392722[/C][/ROW]
[ROW][C]34[/C][C]-0.079888[/C][C]-0.6731[/C][C]0.251519[/C][/ROW]
[ROW][C]35[/C][C]0.000606[/C][C]0.0051[/C][C]0.497969[/C][/ROW]
[ROW][C]36[/C][C]-0.00862[/C][C]-0.0726[/C][C]0.47115[/C][/ROW]
[ROW][C]37[/C][C]-0.002043[/C][C]-0.0172[/C][C]0.493156[/C][/ROW]
[ROW][C]38[/C][C]-0.042049[/C][C]-0.3543[/C][C]0.362078[/C][/ROW]
[ROW][C]39[/C][C]0.038467[/C][C]0.3241[/C][C]0.373396[/C][/ROW]
[ROW][C]40[/C][C]0.012497[/C][C]0.1053[/C][C]0.458215[/C][/ROW]
[ROW][C]41[/C][C]-0.01425[/C][C]-0.1201[/C][C]0.452383[/C][/ROW]
[ROW][C]42[/C][C]0.090751[/C][C]0.7647[/C][C]0.223498[/C][/ROW]
[ROW][C]43[/C][C]-0.087733[/C][C]-0.7393[/C][C]0.231094[/C][/ROW]
[ROW][C]44[/C][C]-0.008826[/C][C]-0.0744[/C][C]0.470463[/C][/ROW]
[ROW][C]45[/C][C]-0.067524[/C][C]-0.569[/C][C]0.285587[/C][/ROW]
[ROW][C]46[/C][C]-0.045169[/C][C]-0.3806[/C][C]0.352317[/C][/ROW]
[ROW][C]47[/C][C]-0.137721[/C][C]-1.1605[/C][C]0.124874[/C][/ROW]
[ROW][C]48[/C][C]-0.113393[/C][C]-0.9555[/C][C]0.171292[/C][/ROW]
[/TABLE]
Source: https://freestatistics.org/blog/index.php?pk=40059&T=2

Globally Unique Identifier (entire table): ba.freestatistics.org/blog/index.php?pk=40059&T=2

As an alternative you can also use a QR Code:  

The GUIDs for individual cells are displayed in the table below:

Partial Autocorrelation Function
Time lag kPACF(k)T-STATP-value
10.261872.20660.01529
2-0.289445-2.43890.008617
3-0.194837-1.64170.052534
4-0.211814-1.78480.039284
50.1193751.00590.158946
6-0.000897-0.00760.496994
7-0.080825-0.6810.24903
8-0.270581-2.280.012808
9-0.124048-1.04530.149726
10-0.197666-1.66560.050104
110.182081.53420.064708
120.6217855.23931e-06
13-0.154884-1.30510.09804
140.1309241.10320.136837
150.0509490.42930.334502
160.0594870.50120.308873
17-0.121475-1.02360.154758
18-0.08432-0.71050.239864
190.0210670.17750.429804
20-0.103874-0.87530.192192
210.0068570.05780.477043
220.015180.12790.449292
23-0.119103-1.00360.159496
240.0268970.22660.410678
25-0.033368-0.28120.3897
26-0.128775-1.08510.140779
27-0.141755-1.19440.118139
280.0255190.2150.415181
29-0.071256-0.60040.275071
30-0.04627-0.38990.348897
31-0.014682-0.12370.450947
320.0681340.57410.283854
330.032430.27330.392722
34-0.079888-0.67310.251519
350.0006060.00510.497969
36-0.00862-0.07260.47115
37-0.002043-0.01720.493156
38-0.042049-0.35430.362078
390.0384670.32410.373396
400.0124970.10530.458215
41-0.01425-0.12010.452383
420.0907510.76470.223498
43-0.087733-0.73930.231094
44-0.008826-0.07440.470463
45-0.067524-0.5690.285587
46-0.045169-0.38060.352317
47-0.137721-1.16050.124874
48-0.113393-0.95550.171292


Parameters (Session):
par1 = 48 ; par2 = 1 ; par3 = 1 ; par4 = 0 ; par5 = 12 ;
Parameters (R input):
par1 = 48 ; par2 = 1 ; par3 = 1 ; par4 = 0 ; par5 = 12 ;
R code (references can be found in the software module):
if (par1 == 'Default') {
par1 = 10*log10(length(x))
} else {
par1 <- as.numeric(par1)
}
par2 <- as.numeric(par2)
par3 <- as.numeric(par3)
par4 <- as.numeric(par4)
par5 <- as.numeric(par5)
if (par2 == 0) {
x <- log(x)
} else {
x <- (x ^ par2 - 1) / par2
}
if (par3 > 0) x <- diff(x,lag=1,difference=par3)
if (par4 > 0) x <- diff(x,lag=par5,difference=par4)
bitmap(file='pic1.png')
racf <- acf(x,par1,main='Autocorrelation',xlab='lags',ylab='ACF')
dev.off()
bitmap(file='pic2.png')
rpacf <- pacf(x,par1,main='Partial Autocorrelation',xlab='lags',ylab='PACF')
dev.off()
(myacf <- c(racf$acf))
(mypacf <- c(rpacf$acf))
lengthx <- length(x)
sqrtn <- sqrt(lengthx)
load(file='createtable')
a<-table.start()
a<-table.row.start(a)
a<-table.element(a,'Autocorrelation Function',4,TRUE)
a<-table.row.end(a)
a<-table.row.start(a)
a<-table.element(a,'Time lag k',header=TRUE)
a<-table.element(a,hyperlink('basics.htm','ACF(k)','click here for more information about the Autocorrelation Function'),header=TRUE)
a<-table.element(a,'T-STAT',header=TRUE)
a<-table.element(a,'P-value',header=TRUE)
a<-table.row.end(a)
for (i in 2:(par1+1)) {
a<-table.row.start(a)
a<-table.element(a,i-1,header=TRUE)
a<-table.element(a,round(myacf[i],6))
mytstat <- myacf[i]*sqrtn
a<-table.element(a,round(mytstat,4))
a<-table.element(a,round(1-pt(abs(mytstat),lengthx),6))
a<-table.row.end(a)
}
a<-table.end(a)
table.save(a,file='mytable.tab')
a<-table.start()
a<-table.row.start(a)
a<-table.element(a,'Partial Autocorrelation Function',4,TRUE)
a<-table.row.end(a)
a<-table.row.start(a)
a<-table.element(a,'Time lag k',header=TRUE)
a<-table.element(a,hyperlink('basics.htm','PACF(k)','click here for more information about the Partial Autocorrelation Function'),header=TRUE)
a<-table.element(a,'T-STAT',header=TRUE)
a<-table.element(a,'P-value',header=TRUE)
a<-table.row.end(a)
for (i in 1:par1) {
a<-table.row.start(a)
a<-table.element(a,i,header=TRUE)
a<-table.element(a,round(mypacf[i],6))
mytstat <- mypacf[i]*sqrtn
a<-table.element(a,round(mytstat,4))
a<-table.element(a,round(1-pt(abs(mytstat),lengthx),6))
a<-table.row.end(a)
}
a<-table.end(a)
table.save(a,file='mytable1.tab')