Free Statistics

of Irreproducible Research!

Author's title

Author*Unverified author*
R Software Modulerwasp_autocorrelation.wasp
Title produced by software(Partial) Autocorrelation Function
Date of computationThu, 14 May 2009 11:33:33 -0600
Cite this page as followsStatistical Computations at FreeStatistics.org, Office for Research Development and Education, URL https://freestatistics.org/blog/index.php?v=date/2009/May/14/t12423225364rutxofn32h0yk2.htm/, Retrieved Sun, 28 Apr 2024 21:46:35 +0000
Statistical Computations at FreeStatistics.org, Office for Research Development and Education, URL https://freestatistics.org/blog/index.php?pk=40057, Retrieved Sun, 28 Apr 2024 21:46:35 +0000
QR Codes:

Original text written by user:
IsPrivate?No (this computation is public)
User-defined keywords
Estimated Impact96
Family? (F = Feedback message, R = changed R code, M = changed R Module, P = changed Parameters, D = changed Data)
-       [(Partial) Autocorrelation Function] [Time Series Analy...] [2009-05-14 17:33:33] [8066ce735b3f8beadb711a8680cf7d00] [Current]
Feedback Forum

Post a new message
Dataseries X:
517
510
509
501
507
569
580
578
565
547
555
562
561
555
544
537
543
594
611
613
611
594
595
591
589
584
573
567
569
621
629
628
612
595
597
593
590
580
574
573
573
620
626
620
588
566
557
561
549
532
526
511
499
555
565
542
527
510
514
517
508
493
490
469
478
528
534
518
506
502
516
528


Summary of computational transaction
Raw Inputview raw input (R code)
Raw Outputview raw output of R engine
Computing time1 seconds
R Server'Sir Ronald Aylmer Fisher' @ 193.190.124.24

\begin{tabular}{lllllllll}
\hline
Summary of computational transaction \tabularnewline
Raw Input & view raw input (R code)  \tabularnewline
Raw Output & view raw output of R engine  \tabularnewline
Computing time & 1 seconds \tabularnewline
R Server & 'Sir Ronald Aylmer Fisher' @ 193.190.124.24 \tabularnewline
\hline
\end{tabular}
%Source: https://freestatistics.org/blog/index.php?pk=40057&T=0

[TABLE]
[ROW][C]Summary of computational transaction[/C][/ROW]
[ROW][C]Raw Input[/C][C]view raw input (R code) [/C][/ROW]
[ROW][C]Raw Output[/C][C]view raw output of R engine [/C][/ROW]
[ROW][C]Computing time[/C][C]1 seconds[/C][/ROW]
[ROW][C]R Server[/C][C]'Sir Ronald Aylmer Fisher' @ 193.190.124.24[/C][/ROW]
[/TABLE]
Source: https://freestatistics.org/blog/index.php?pk=40057&T=0

Globally Unique Identifier (entire table): ba.freestatistics.org/blog/index.php?pk=40057&T=0

As an alternative you can also use a QR Code:  

The GUIDs for individual cells are displayed in the table below:

Summary of computational transaction
Raw Inputview raw input (R code)
Raw Outputview raw output of R engine
Computing time1 seconds
R Server'Sir Ronald Aylmer Fisher' @ 193.190.124.24


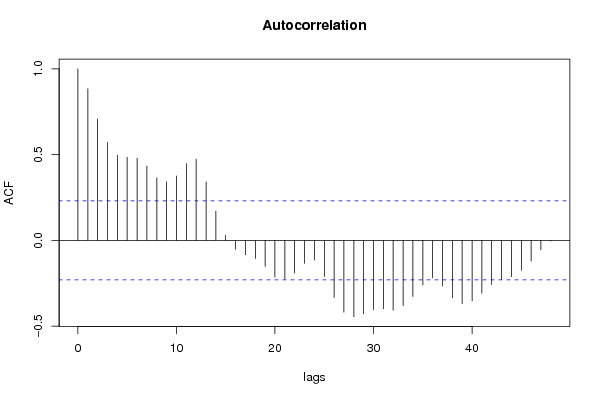
Autocorrelation Function
Time lag kACF(k)T-STATP-value
10.8843647.50410
20.7081526.00890
30.5707764.84324e-06
40.4972344.21923.5e-05
50.4850274.11565.1e-05
60.4792624.06676e-05
70.4331753.67560.000227
80.364643.09410.001405
90.341492.89760.002489
100.3761993.19220.001047
110.4480273.80160.000149
120.472764.01157.3e-05
130.3412532.89560.002503
140.1701111.44340.076617
150.030090.25530.399601
16-0.052436-0.44490.328851
17-0.083771-0.71080.239747
18-0.10632-0.90220.184991
19-0.151711-1.28730.101055
20-0.213768-1.81390.036931
21-0.224811-1.90760.030217
22-0.18968-1.60950.055943
23-0.133545-1.13320.130451
24-0.114399-0.97070.167471
25-0.210048-1.78230.039457
26-0.333083-2.82630.003045
27-0.41858-3.55180.00034
28-0.444945-3.77550.000163
29-0.428507-3.6360.000258
30-0.40474-3.43430.000495
31-0.399105-3.38650.000575
32-0.407087-3.45430.000464
33-0.380278-3.22680.000943
34-0.328001-2.78320.003435
35-0.260106-2.20710.015249
36-0.218473-1.85380.033932
37-0.266126-2.25820.013484
38-0.334679-2.83980.002932
39-0.368609-3.12780.001271
40-0.352493-2.9910.001902
41-0.308755-2.61990.005361
42-0.258117-2.19020.015875
43-0.228074-1.93530.028442
44-0.21172-1.79650.038304
45-0.174294-1.47890.07176
46-0.120916-1.0260.154162
47-0.055014-0.46680.321024
48-0.003133-0.02660.489431

\begin{tabular}{lllllllll}
\hline
Autocorrelation Function \tabularnewline
Time lag k & ACF(k) & T-STAT & P-value \tabularnewline
1 & 0.884364 & 7.5041 & 0 \tabularnewline
2 & 0.708152 & 6.0089 & 0 \tabularnewline
3 & 0.570776 & 4.8432 & 4e-06 \tabularnewline
4 & 0.497234 & 4.2192 & 3.5e-05 \tabularnewline
5 & 0.485027 & 4.1156 & 5.1e-05 \tabularnewline
6 & 0.479262 & 4.0667 & 6e-05 \tabularnewline
7 & 0.433175 & 3.6756 & 0.000227 \tabularnewline
8 & 0.36464 & 3.0941 & 0.001405 \tabularnewline
9 & 0.34149 & 2.8976 & 0.002489 \tabularnewline
10 & 0.376199 & 3.1922 & 0.001047 \tabularnewline
11 & 0.448027 & 3.8016 & 0.000149 \tabularnewline
12 & 0.47276 & 4.0115 & 7.3e-05 \tabularnewline
13 & 0.341253 & 2.8956 & 0.002503 \tabularnewline
14 & 0.170111 & 1.4434 & 0.076617 \tabularnewline
15 & 0.03009 & 0.2553 & 0.399601 \tabularnewline
16 & -0.052436 & -0.4449 & 0.328851 \tabularnewline
17 & -0.083771 & -0.7108 & 0.239747 \tabularnewline
18 & -0.10632 & -0.9022 & 0.184991 \tabularnewline
19 & -0.151711 & -1.2873 & 0.101055 \tabularnewline
20 & -0.213768 & -1.8139 & 0.036931 \tabularnewline
21 & -0.224811 & -1.9076 & 0.030217 \tabularnewline
22 & -0.18968 & -1.6095 & 0.055943 \tabularnewline
23 & -0.133545 & -1.1332 & 0.130451 \tabularnewline
24 & -0.114399 & -0.9707 & 0.167471 \tabularnewline
25 & -0.210048 & -1.7823 & 0.039457 \tabularnewline
26 & -0.333083 & -2.8263 & 0.003045 \tabularnewline
27 & -0.41858 & -3.5518 & 0.00034 \tabularnewline
28 & -0.444945 & -3.7755 & 0.000163 \tabularnewline
29 & -0.428507 & -3.636 & 0.000258 \tabularnewline
30 & -0.40474 & -3.4343 & 0.000495 \tabularnewline
31 & -0.399105 & -3.3865 & 0.000575 \tabularnewline
32 & -0.407087 & -3.4543 & 0.000464 \tabularnewline
33 & -0.380278 & -3.2268 & 0.000943 \tabularnewline
34 & -0.328001 & -2.7832 & 0.003435 \tabularnewline
35 & -0.260106 & -2.2071 & 0.015249 \tabularnewline
36 & -0.218473 & -1.8538 & 0.033932 \tabularnewline
37 & -0.266126 & -2.2582 & 0.013484 \tabularnewline
38 & -0.334679 & -2.8398 & 0.002932 \tabularnewline
39 & -0.368609 & -3.1278 & 0.001271 \tabularnewline
40 & -0.352493 & -2.991 & 0.001902 \tabularnewline
41 & -0.308755 & -2.6199 & 0.005361 \tabularnewline
42 & -0.258117 & -2.1902 & 0.015875 \tabularnewline
43 & -0.228074 & -1.9353 & 0.028442 \tabularnewline
44 & -0.21172 & -1.7965 & 0.038304 \tabularnewline
45 & -0.174294 & -1.4789 & 0.07176 \tabularnewline
46 & -0.120916 & -1.026 & 0.154162 \tabularnewline
47 & -0.055014 & -0.4668 & 0.321024 \tabularnewline
48 & -0.003133 & -0.0266 & 0.489431 \tabularnewline
\hline
\end{tabular}
%Source: https://freestatistics.org/blog/index.php?pk=40057&T=1

[TABLE]
[ROW][C]Autocorrelation Function[/C][/ROW]
[ROW][C]Time lag k[/C][C]ACF(k)[/C][C]T-STAT[/C][C]P-value[/C][/ROW]
[ROW][C]1[/C][C]0.884364[/C][C]7.5041[/C][C]0[/C][/ROW]
[ROW][C]2[/C][C]0.708152[/C][C]6.0089[/C][C]0[/C][/ROW]
[ROW][C]3[/C][C]0.570776[/C][C]4.8432[/C][C]4e-06[/C][/ROW]
[ROW][C]4[/C][C]0.497234[/C][C]4.2192[/C][C]3.5e-05[/C][/ROW]
[ROW][C]5[/C][C]0.485027[/C][C]4.1156[/C][C]5.1e-05[/C][/ROW]
[ROW][C]6[/C][C]0.479262[/C][C]4.0667[/C][C]6e-05[/C][/ROW]
[ROW][C]7[/C][C]0.433175[/C][C]3.6756[/C][C]0.000227[/C][/ROW]
[ROW][C]8[/C][C]0.36464[/C][C]3.0941[/C][C]0.001405[/C][/ROW]
[ROW][C]9[/C][C]0.34149[/C][C]2.8976[/C][C]0.002489[/C][/ROW]
[ROW][C]10[/C][C]0.376199[/C][C]3.1922[/C][C]0.001047[/C][/ROW]
[ROW][C]11[/C][C]0.448027[/C][C]3.8016[/C][C]0.000149[/C][/ROW]
[ROW][C]12[/C][C]0.47276[/C][C]4.0115[/C][C]7.3e-05[/C][/ROW]
[ROW][C]13[/C][C]0.341253[/C][C]2.8956[/C][C]0.002503[/C][/ROW]
[ROW][C]14[/C][C]0.170111[/C][C]1.4434[/C][C]0.076617[/C][/ROW]
[ROW][C]15[/C][C]0.03009[/C][C]0.2553[/C][C]0.399601[/C][/ROW]
[ROW][C]16[/C][C]-0.052436[/C][C]-0.4449[/C][C]0.328851[/C][/ROW]
[ROW][C]17[/C][C]-0.083771[/C][C]-0.7108[/C][C]0.239747[/C][/ROW]
[ROW][C]18[/C][C]-0.10632[/C][C]-0.9022[/C][C]0.184991[/C][/ROW]
[ROW][C]19[/C][C]-0.151711[/C][C]-1.2873[/C][C]0.101055[/C][/ROW]
[ROW][C]20[/C][C]-0.213768[/C][C]-1.8139[/C][C]0.036931[/C][/ROW]
[ROW][C]21[/C][C]-0.224811[/C][C]-1.9076[/C][C]0.030217[/C][/ROW]
[ROW][C]22[/C][C]-0.18968[/C][C]-1.6095[/C][C]0.055943[/C][/ROW]
[ROW][C]23[/C][C]-0.133545[/C][C]-1.1332[/C][C]0.130451[/C][/ROW]
[ROW][C]24[/C][C]-0.114399[/C][C]-0.9707[/C][C]0.167471[/C][/ROW]
[ROW][C]25[/C][C]-0.210048[/C][C]-1.7823[/C][C]0.039457[/C][/ROW]
[ROW][C]26[/C][C]-0.333083[/C][C]-2.8263[/C][C]0.003045[/C][/ROW]
[ROW][C]27[/C][C]-0.41858[/C][C]-3.5518[/C][C]0.00034[/C][/ROW]
[ROW][C]28[/C][C]-0.444945[/C][C]-3.7755[/C][C]0.000163[/C][/ROW]
[ROW][C]29[/C][C]-0.428507[/C][C]-3.636[/C][C]0.000258[/C][/ROW]
[ROW][C]30[/C][C]-0.40474[/C][C]-3.4343[/C][C]0.000495[/C][/ROW]
[ROW][C]31[/C][C]-0.399105[/C][C]-3.3865[/C][C]0.000575[/C][/ROW]
[ROW][C]32[/C][C]-0.407087[/C][C]-3.4543[/C][C]0.000464[/C][/ROW]
[ROW][C]33[/C][C]-0.380278[/C][C]-3.2268[/C][C]0.000943[/C][/ROW]
[ROW][C]34[/C][C]-0.328001[/C][C]-2.7832[/C][C]0.003435[/C][/ROW]
[ROW][C]35[/C][C]-0.260106[/C][C]-2.2071[/C][C]0.015249[/C][/ROW]
[ROW][C]36[/C][C]-0.218473[/C][C]-1.8538[/C][C]0.033932[/C][/ROW]
[ROW][C]37[/C][C]-0.266126[/C][C]-2.2582[/C][C]0.013484[/C][/ROW]
[ROW][C]38[/C][C]-0.334679[/C][C]-2.8398[/C][C]0.002932[/C][/ROW]
[ROW][C]39[/C][C]-0.368609[/C][C]-3.1278[/C][C]0.001271[/C][/ROW]
[ROW][C]40[/C][C]-0.352493[/C][C]-2.991[/C][C]0.001902[/C][/ROW]
[ROW][C]41[/C][C]-0.308755[/C][C]-2.6199[/C][C]0.005361[/C][/ROW]
[ROW][C]42[/C][C]-0.258117[/C][C]-2.1902[/C][C]0.015875[/C][/ROW]
[ROW][C]43[/C][C]-0.228074[/C][C]-1.9353[/C][C]0.028442[/C][/ROW]
[ROW][C]44[/C][C]-0.21172[/C][C]-1.7965[/C][C]0.038304[/C][/ROW]
[ROW][C]45[/C][C]-0.174294[/C][C]-1.4789[/C][C]0.07176[/C][/ROW]
[ROW][C]46[/C][C]-0.120916[/C][C]-1.026[/C][C]0.154162[/C][/ROW]
[ROW][C]47[/C][C]-0.055014[/C][C]-0.4668[/C][C]0.321024[/C][/ROW]
[ROW][C]48[/C][C]-0.003133[/C][C]-0.0266[/C][C]0.489431[/C][/ROW]
[/TABLE]
Source: https://freestatistics.org/blog/index.php?pk=40057&T=1

Globally Unique Identifier (entire table): ba.freestatistics.org/blog/index.php?pk=40057&T=1

As an alternative you can also use a QR Code:  

The GUIDs for individual cells are displayed in the table below:

Autocorrelation Function
Time lag kACF(k)T-STATP-value
10.8843647.50410
20.7081526.00890
30.5707764.84324e-06
40.4972344.21923.5e-05
50.4850274.11565.1e-05
60.4792624.06676e-05
70.4331753.67560.000227
80.364643.09410.001405
90.341492.89760.002489
100.3761993.19220.001047
110.4480273.80160.000149
120.472764.01157.3e-05
130.3412532.89560.002503
140.1701111.44340.076617
150.030090.25530.399601
16-0.052436-0.44490.328851
17-0.083771-0.71080.239747
18-0.10632-0.90220.184991
19-0.151711-1.28730.101055
20-0.213768-1.81390.036931
21-0.224811-1.90760.030217
22-0.18968-1.60950.055943
23-0.133545-1.13320.130451
24-0.114399-0.97070.167471
25-0.210048-1.78230.039457
26-0.333083-2.82630.003045
27-0.41858-3.55180.00034
28-0.444945-3.77550.000163
29-0.428507-3.6360.000258
30-0.40474-3.43430.000495
31-0.399105-3.38650.000575
32-0.407087-3.45430.000464
33-0.380278-3.22680.000943
34-0.328001-2.78320.003435
35-0.260106-2.20710.015249
36-0.218473-1.85380.033932
37-0.266126-2.25820.013484
38-0.334679-2.83980.002932
39-0.368609-3.12780.001271
40-0.352493-2.9910.001902
41-0.308755-2.61990.005361
42-0.258117-2.19020.015875
43-0.228074-1.93530.028442
44-0.21172-1.79650.038304
45-0.174294-1.47890.07176
46-0.120916-1.0260.154162
47-0.055014-0.46680.321024
48-0.003133-0.02660.489431


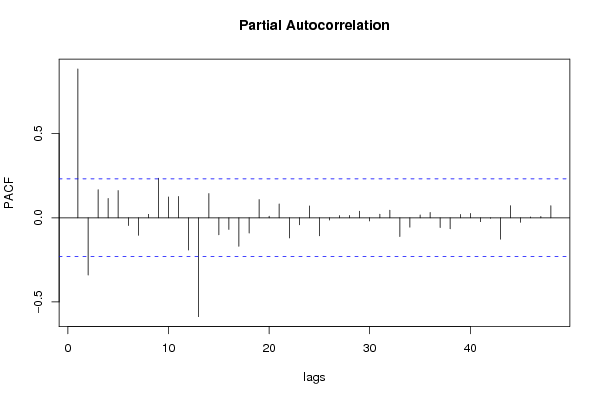
Partial Autocorrelation Function
Time lag kPACF(k)T-STATP-value
10.8843647.50410
2-0.339369-2.87960.00262
30.1665061.41280.081004
40.1154370.97950.165302
50.1615791.3710.08731
6-0.046037-0.39060.34861
7-0.103948-0.8820.190349
80.0204850.17380.431246
90.2355641.99880.024701
100.1233361.04650.149406
110.1265011.07340.143339
12-0.190815-1.61910.054897
13-0.587137-4.9822e-06
140.1440641.22240.112767
15-0.100436-0.85220.198457
16-0.068904-0.58470.2803
17-0.168665-1.43120.078354
18-0.089829-0.76220.224208
190.1082280.91830.180753
200.0089990.07640.469671
210.0825470.70040.242958
22-0.119251-1.01190.157492
23-0.041705-0.35390.362233
240.0699290.59340.277399
25-0.106722-0.90560.184093
26-0.013526-0.11480.454473
270.0132680.11260.455336
280.0137870.1170.453599
290.0387690.3290.371568
30-0.018289-0.15520.438555
310.0212690.18050.428645
320.045490.3860.35032
33-0.110836-0.94050.175059
34-0.055362-0.46980.319974
350.0168720.14320.44328
360.0315150.26740.394957
37-0.057492-0.48780.313575
38-0.064779-0.54970.292124
390.0197890.16790.433561
400.0254490.21590.414821
41-0.022806-0.19350.423549
42-0.003214-0.02730.489159
43-0.126821-1.07610.142735
440.0724160.61450.27042
45-0.026143-0.22180.412536
460.0045740.03880.484573
470.0076240.06470.4743
480.0721060.61180.271286

\begin{tabular}{lllllllll}
\hline
Partial Autocorrelation Function \tabularnewline
Time lag k & PACF(k) & T-STAT & P-value \tabularnewline
1 & 0.884364 & 7.5041 & 0 \tabularnewline
2 & -0.339369 & -2.8796 & 0.00262 \tabularnewline
3 & 0.166506 & 1.4128 & 0.081004 \tabularnewline
4 & 0.115437 & 0.9795 & 0.165302 \tabularnewline
5 & 0.161579 & 1.371 & 0.08731 \tabularnewline
6 & -0.046037 & -0.3906 & 0.34861 \tabularnewline
7 & -0.103948 & -0.882 & 0.190349 \tabularnewline
8 & 0.020485 & 0.1738 & 0.431246 \tabularnewline
9 & 0.235564 & 1.9988 & 0.024701 \tabularnewline
10 & 0.123336 & 1.0465 & 0.149406 \tabularnewline
11 & 0.126501 & 1.0734 & 0.143339 \tabularnewline
12 & -0.190815 & -1.6191 & 0.054897 \tabularnewline
13 & -0.587137 & -4.982 & 2e-06 \tabularnewline
14 & 0.144064 & 1.2224 & 0.112767 \tabularnewline
15 & -0.100436 & -0.8522 & 0.198457 \tabularnewline
16 & -0.068904 & -0.5847 & 0.2803 \tabularnewline
17 & -0.168665 & -1.4312 & 0.078354 \tabularnewline
18 & -0.089829 & -0.7622 & 0.224208 \tabularnewline
19 & 0.108228 & 0.9183 & 0.180753 \tabularnewline
20 & 0.008999 & 0.0764 & 0.469671 \tabularnewline
21 & 0.082547 & 0.7004 & 0.242958 \tabularnewline
22 & -0.119251 & -1.0119 & 0.157492 \tabularnewline
23 & -0.041705 & -0.3539 & 0.362233 \tabularnewline
24 & 0.069929 & 0.5934 & 0.277399 \tabularnewline
25 & -0.106722 & -0.9056 & 0.184093 \tabularnewline
26 & -0.013526 & -0.1148 & 0.454473 \tabularnewline
27 & 0.013268 & 0.1126 & 0.455336 \tabularnewline
28 & 0.013787 & 0.117 & 0.453599 \tabularnewline
29 & 0.038769 & 0.329 & 0.371568 \tabularnewline
30 & -0.018289 & -0.1552 & 0.438555 \tabularnewline
31 & 0.021269 & 0.1805 & 0.428645 \tabularnewline
32 & 0.04549 & 0.386 & 0.35032 \tabularnewline
33 & -0.110836 & -0.9405 & 0.175059 \tabularnewline
34 & -0.055362 & -0.4698 & 0.319974 \tabularnewline
35 & 0.016872 & 0.1432 & 0.44328 \tabularnewline
36 & 0.031515 & 0.2674 & 0.394957 \tabularnewline
37 & -0.057492 & -0.4878 & 0.313575 \tabularnewline
38 & -0.064779 & -0.5497 & 0.292124 \tabularnewline
39 & 0.019789 & 0.1679 & 0.433561 \tabularnewline
40 & 0.025449 & 0.2159 & 0.414821 \tabularnewline
41 & -0.022806 & -0.1935 & 0.423549 \tabularnewline
42 & -0.003214 & -0.0273 & 0.489159 \tabularnewline
43 & -0.126821 & -1.0761 & 0.142735 \tabularnewline
44 & 0.072416 & 0.6145 & 0.27042 \tabularnewline
45 & -0.026143 & -0.2218 & 0.412536 \tabularnewline
46 & 0.004574 & 0.0388 & 0.484573 \tabularnewline
47 & 0.007624 & 0.0647 & 0.4743 \tabularnewline
48 & 0.072106 & 0.6118 & 0.271286 \tabularnewline
\hline
\end{tabular}
%Source: https://freestatistics.org/blog/index.php?pk=40057&T=2

[TABLE]
[ROW][C]Partial Autocorrelation Function[/C][/ROW]
[ROW][C]Time lag k[/C][C]PACF(k)[/C][C]T-STAT[/C][C]P-value[/C][/ROW]
[ROW][C]1[/C][C]0.884364[/C][C]7.5041[/C][C]0[/C][/ROW]
[ROW][C]2[/C][C]-0.339369[/C][C]-2.8796[/C][C]0.00262[/C][/ROW]
[ROW][C]3[/C][C]0.166506[/C][C]1.4128[/C][C]0.081004[/C][/ROW]
[ROW][C]4[/C][C]0.115437[/C][C]0.9795[/C][C]0.165302[/C][/ROW]
[ROW][C]5[/C][C]0.161579[/C][C]1.371[/C][C]0.08731[/C][/ROW]
[ROW][C]6[/C][C]-0.046037[/C][C]-0.3906[/C][C]0.34861[/C][/ROW]
[ROW][C]7[/C][C]-0.103948[/C][C]-0.882[/C][C]0.190349[/C][/ROW]
[ROW][C]8[/C][C]0.020485[/C][C]0.1738[/C][C]0.431246[/C][/ROW]
[ROW][C]9[/C][C]0.235564[/C][C]1.9988[/C][C]0.024701[/C][/ROW]
[ROW][C]10[/C][C]0.123336[/C][C]1.0465[/C][C]0.149406[/C][/ROW]
[ROW][C]11[/C][C]0.126501[/C][C]1.0734[/C][C]0.143339[/C][/ROW]
[ROW][C]12[/C][C]-0.190815[/C][C]-1.6191[/C][C]0.054897[/C][/ROW]
[ROW][C]13[/C][C]-0.587137[/C][C]-4.982[/C][C]2e-06[/C][/ROW]
[ROW][C]14[/C][C]0.144064[/C][C]1.2224[/C][C]0.112767[/C][/ROW]
[ROW][C]15[/C][C]-0.100436[/C][C]-0.8522[/C][C]0.198457[/C][/ROW]
[ROW][C]16[/C][C]-0.068904[/C][C]-0.5847[/C][C]0.2803[/C][/ROW]
[ROW][C]17[/C][C]-0.168665[/C][C]-1.4312[/C][C]0.078354[/C][/ROW]
[ROW][C]18[/C][C]-0.089829[/C][C]-0.7622[/C][C]0.224208[/C][/ROW]
[ROW][C]19[/C][C]0.108228[/C][C]0.9183[/C][C]0.180753[/C][/ROW]
[ROW][C]20[/C][C]0.008999[/C][C]0.0764[/C][C]0.469671[/C][/ROW]
[ROW][C]21[/C][C]0.082547[/C][C]0.7004[/C][C]0.242958[/C][/ROW]
[ROW][C]22[/C][C]-0.119251[/C][C]-1.0119[/C][C]0.157492[/C][/ROW]
[ROW][C]23[/C][C]-0.041705[/C][C]-0.3539[/C][C]0.362233[/C][/ROW]
[ROW][C]24[/C][C]0.069929[/C][C]0.5934[/C][C]0.277399[/C][/ROW]
[ROW][C]25[/C][C]-0.106722[/C][C]-0.9056[/C][C]0.184093[/C][/ROW]
[ROW][C]26[/C][C]-0.013526[/C][C]-0.1148[/C][C]0.454473[/C][/ROW]
[ROW][C]27[/C][C]0.013268[/C][C]0.1126[/C][C]0.455336[/C][/ROW]
[ROW][C]28[/C][C]0.013787[/C][C]0.117[/C][C]0.453599[/C][/ROW]
[ROW][C]29[/C][C]0.038769[/C][C]0.329[/C][C]0.371568[/C][/ROW]
[ROW][C]30[/C][C]-0.018289[/C][C]-0.1552[/C][C]0.438555[/C][/ROW]
[ROW][C]31[/C][C]0.021269[/C][C]0.1805[/C][C]0.428645[/C][/ROW]
[ROW][C]32[/C][C]0.04549[/C][C]0.386[/C][C]0.35032[/C][/ROW]
[ROW][C]33[/C][C]-0.110836[/C][C]-0.9405[/C][C]0.175059[/C][/ROW]
[ROW][C]34[/C][C]-0.055362[/C][C]-0.4698[/C][C]0.319974[/C][/ROW]
[ROW][C]35[/C][C]0.016872[/C][C]0.1432[/C][C]0.44328[/C][/ROW]
[ROW][C]36[/C][C]0.031515[/C][C]0.2674[/C][C]0.394957[/C][/ROW]
[ROW][C]37[/C][C]-0.057492[/C][C]-0.4878[/C][C]0.313575[/C][/ROW]
[ROW][C]38[/C][C]-0.064779[/C][C]-0.5497[/C][C]0.292124[/C][/ROW]
[ROW][C]39[/C][C]0.019789[/C][C]0.1679[/C][C]0.433561[/C][/ROW]
[ROW][C]40[/C][C]0.025449[/C][C]0.2159[/C][C]0.414821[/C][/ROW]
[ROW][C]41[/C][C]-0.022806[/C][C]-0.1935[/C][C]0.423549[/C][/ROW]
[ROW][C]42[/C][C]-0.003214[/C][C]-0.0273[/C][C]0.489159[/C][/ROW]
[ROW][C]43[/C][C]-0.126821[/C][C]-1.0761[/C][C]0.142735[/C][/ROW]
[ROW][C]44[/C][C]0.072416[/C][C]0.6145[/C][C]0.27042[/C][/ROW]
[ROW][C]45[/C][C]-0.026143[/C][C]-0.2218[/C][C]0.412536[/C][/ROW]
[ROW][C]46[/C][C]0.004574[/C][C]0.0388[/C][C]0.484573[/C][/ROW]
[ROW][C]47[/C][C]0.007624[/C][C]0.0647[/C][C]0.4743[/C][/ROW]
[ROW][C]48[/C][C]0.072106[/C][C]0.6118[/C][C]0.271286[/C][/ROW]
[/TABLE]
Source: https://freestatistics.org/blog/index.php?pk=40057&T=2

Globally Unique Identifier (entire table): ba.freestatistics.org/blog/index.php?pk=40057&T=2

As an alternative you can also use a QR Code:  

The GUIDs for individual cells are displayed in the table below:

Partial Autocorrelation Function
Time lag kPACF(k)T-STATP-value
10.8843647.50410
2-0.339369-2.87960.00262
30.1665061.41280.081004
40.1154370.97950.165302
50.1615791.3710.08731
6-0.046037-0.39060.34861
7-0.103948-0.8820.190349
80.0204850.17380.431246
90.2355641.99880.024701
100.1233361.04650.149406
110.1265011.07340.143339
12-0.190815-1.61910.054897
13-0.587137-4.9822e-06
140.1440641.22240.112767
15-0.100436-0.85220.198457
16-0.068904-0.58470.2803
17-0.168665-1.43120.078354
18-0.089829-0.76220.224208
190.1082280.91830.180753
200.0089990.07640.469671
210.0825470.70040.242958
22-0.119251-1.01190.157492
23-0.041705-0.35390.362233
240.0699290.59340.277399
25-0.106722-0.90560.184093
26-0.013526-0.11480.454473
270.0132680.11260.455336
280.0137870.1170.453599
290.0387690.3290.371568
30-0.018289-0.15520.438555
310.0212690.18050.428645
320.045490.3860.35032
33-0.110836-0.94050.175059
34-0.055362-0.46980.319974
350.0168720.14320.44328
360.0315150.26740.394957
37-0.057492-0.48780.313575
38-0.064779-0.54970.292124
390.0197890.16790.433561
400.0254490.21590.414821
41-0.022806-0.19350.423549
42-0.003214-0.02730.489159
43-0.126821-1.07610.142735
440.0724160.61450.27042
45-0.026143-0.22180.412536
460.0045740.03880.484573
470.0076240.06470.4743
480.0721060.61180.271286


Parameters (Session):
par1 = 48 ; par2 = 1 ; par3 = 0 ; par4 = 0 ; par5 = 12 ;
Parameters (R input):
par1 = 48 ; par2 = 1 ; par3 = 0 ; par4 = 0 ; par5 = 12 ;
R code (references can be found in the software module):
if (par1 == 'Default') {
par1 = 10*log10(length(x))
} else {
par1 <- as.numeric(par1)
}
par2 <- as.numeric(par2)
par3 <- as.numeric(par3)
par4 <- as.numeric(par4)
par5 <- as.numeric(par5)
if (par2 == 0) {
x <- log(x)
} else {
x <- (x ^ par2 - 1) / par2
}
if (par3 > 0) x <- diff(x,lag=1,difference=par3)
if (par4 > 0) x <- diff(x,lag=par5,difference=par4)
bitmap(file='pic1.png')
racf <- acf(x,par1,main='Autocorrelation',xlab='lags',ylab='ACF')
dev.off()
bitmap(file='pic2.png')
rpacf <- pacf(x,par1,main='Partial Autocorrelation',xlab='lags',ylab='PACF')
dev.off()
(myacf <- c(racf$acf))
(mypacf <- c(rpacf$acf))
lengthx <- length(x)
sqrtn <- sqrt(lengthx)
load(file='createtable')
a<-table.start()
a<-table.row.start(a)
a<-table.element(a,'Autocorrelation Function',4,TRUE)
a<-table.row.end(a)
a<-table.row.start(a)
a<-table.element(a,'Time lag k',header=TRUE)
a<-table.element(a,hyperlink('basics.htm','ACF(k)','click here for more information about the Autocorrelation Function'),header=TRUE)
a<-table.element(a,'T-STAT',header=TRUE)
a<-table.element(a,'P-value',header=TRUE)
a<-table.row.end(a)
for (i in 2:(par1+1)) {
a<-table.row.start(a)
a<-table.element(a,i-1,header=TRUE)
a<-table.element(a,round(myacf[i],6))
mytstat <- myacf[i]*sqrtn
a<-table.element(a,round(mytstat,4))
a<-table.element(a,round(1-pt(abs(mytstat),lengthx),6))
a<-table.row.end(a)
}
a<-table.end(a)
table.save(a,file='mytable.tab')
a<-table.start()
a<-table.row.start(a)
a<-table.element(a,'Partial Autocorrelation Function',4,TRUE)
a<-table.row.end(a)
a<-table.row.start(a)
a<-table.element(a,'Time lag k',header=TRUE)
a<-table.element(a,hyperlink('basics.htm','PACF(k)','click here for more information about the Partial Autocorrelation Function'),header=TRUE)
a<-table.element(a,'T-STAT',header=TRUE)
a<-table.element(a,'P-value',header=TRUE)
a<-table.row.end(a)
for (i in 1:par1) {
a<-table.row.start(a)
a<-table.element(a,i,header=TRUE)
a<-table.element(a,round(mypacf[i],6))
mytstat <- mypacf[i]*sqrtn
a<-table.element(a,round(mytstat,4))
a<-table.element(a,round(1-pt(abs(mytstat),lengthx),6))
a<-table.row.end(a)
}
a<-table.end(a)
table.save(a,file='mytable1.tab')