Free Statistics

of Irreproducible Research!

Author's title

Author*Unverified author*
R Software Modulerwasp_autocorrelation.wasp
Title produced by software(Partial) Autocorrelation Function
Date of computationThu, 14 May 2009 11:28:15 -0600
Cite this page as followsStatistical Computations at FreeStatistics.org, Office for Research Development and Education, URL https://freestatistics.org/blog/index.php?v=date/2009/May/14/t1242322141ts2er23dxglt4kb.htm/, Retrieved Mon, 29 Apr 2024 03:47:16 +0000
Statistical Computations at FreeStatistics.org, Office for Research Development and Education, URL https://freestatistics.org/blog/index.php?pk=40054, Retrieved Mon, 29 Apr 2024 03:47:16 +0000
QR Codes:

Original text written by user:
IsPrivate?No (this computation is public)
User-defined keywords
Estimated Impact130
Family? (F = Feedback message, R = changed R code, M = changed R Module, P = changed Parameters, D = changed Data)
-       [(Partial) Autocorrelation Function] [Time Series Analy...] [2009-05-14 17:28:15] [d41d8cd98f00b204e9800998ecf8427e] [Current]
Feedback Forum

Post a new message
Dataseries X:
464
675
703
887
1139
1077
1318
1260
1120
963
996
960
530
883
894
1045
1199
1287
1565
1577
1076
918
1008
1063
544
635
804
980
1018
1064
1404
1286
1104
999
996
1015
615
722
832
977
1270
1437
1520
1708
1151
934
1159
1209
699
830
996
1124
1458
1270
1753
2258
1208
1241
1265
1828
809
997
1164
1205
1538
1513
1378
2083
1357
1536
1526
1376


Summary of computational transaction
Raw Inputview raw input (R code)
Raw Outputview raw output of R engine
Computing time1 seconds
R Server'George Udny Yule' @ 72.249.76.132

\begin{tabular}{lllllllll}
\hline
Summary of computational transaction \tabularnewline
Raw Input & view raw input (R code)  \tabularnewline
Raw Output & view raw output of R engine  \tabularnewline
Computing time & 1 seconds \tabularnewline
R Server & 'George Udny Yule' @ 72.249.76.132 \tabularnewline
\hline
\end{tabular}
%Source: https://freestatistics.org/blog/index.php?pk=40054&T=0

[TABLE]
[ROW][C]Summary of computational transaction[/C][/ROW]
[ROW][C]Raw Input[/C][C]view raw input (R code) [/C][/ROW]
[ROW][C]Raw Output[/C][C]view raw output of R engine [/C][/ROW]
[ROW][C]Computing time[/C][C]1 seconds[/C][/ROW]
[ROW][C]R Server[/C][C]'George Udny Yule' @ 72.249.76.132[/C][/ROW]
[/TABLE]
Source: https://freestatistics.org/blog/index.php?pk=40054&T=0

Globally Unique Identifier (entire table): ba.freestatistics.org/blog/index.php?pk=40054&T=0

As an alternative you can also use a QR Code:  

The GUIDs for individual cells are displayed in the table below:

Summary of computational transaction
Raw Inputview raw input (R code)
Raw Outputview raw output of R engine
Computing time1 seconds
R Server'George Udny Yule' @ 72.249.76.132


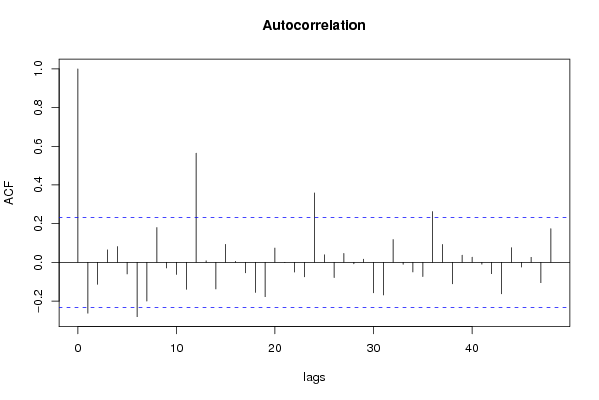
Autocorrelation Function
Time lag kACF(k)T-STATP-value
1-0.263195-2.21770.014888
2-0.113552-0.95680.170956
30.0644680.54320.29434
40.0818120.68940.246421
5-0.060253-0.50770.306618
6-0.280849-2.36650.010345
7-0.200181-1.68680.04802
80.1800721.51730.066814
9-0.029261-0.24660.402981
10-0.06285-0.52960.299026
11-0.139253-1.17340.122285
120.5644154.75585e-06
130.008230.06930.472454
14-0.137613-1.15950.125059
150.0928960.78280.218187
160.0050020.04210.483251
17-0.053878-0.4540.325613
18-0.155733-1.31220.096835
19-0.177621-1.49670.069457
200.0737530.62150.268147
21-0.001357-0.01140.495454
22-0.050082-0.4220.337152
23-0.074902-0.63110.264988
240.3586833.02230.001744
250.039070.32920.371482
26-0.078578-0.66210.255022
270.0457680.38560.350455
28-0.007654-0.06450.474378
290.0161440.1360.446089
30-0.157435-1.32660.094451
31-0.168851-1.42280.079592
320.1180060.99430.161718
33-0.009913-0.08350.466833
34-0.049734-0.41910.338215
35-0.073361-0.61810.269228
360.2622572.20980.015172
370.092310.77780.219631
38-0.111176-0.93680.176022
390.0372940.31420.377127
400.0269050.22670.410653
41-0.009588-0.08080.467918
42-0.058874-0.49610.310685
43-0.163069-1.3740.086876
440.075550.63660.263217
45-0.024143-0.20340.419689
460.0261370.22020.413162
47-0.105459-0.88860.188605
480.1738161.46460.073722

\begin{tabular}{lllllllll}
\hline
Autocorrelation Function \tabularnewline
Time lag k & ACF(k) & T-STAT & P-value \tabularnewline
1 & -0.263195 & -2.2177 & 0.014888 \tabularnewline
2 & -0.113552 & -0.9568 & 0.170956 \tabularnewline
3 & 0.064468 & 0.5432 & 0.29434 \tabularnewline
4 & 0.081812 & 0.6894 & 0.246421 \tabularnewline
5 & -0.060253 & -0.5077 & 0.306618 \tabularnewline
6 & -0.280849 & -2.3665 & 0.010345 \tabularnewline
7 & -0.200181 & -1.6868 & 0.04802 \tabularnewline
8 & 0.180072 & 1.5173 & 0.066814 \tabularnewline
9 & -0.029261 & -0.2466 & 0.402981 \tabularnewline
10 & -0.06285 & -0.5296 & 0.299026 \tabularnewline
11 & -0.139253 & -1.1734 & 0.122285 \tabularnewline
12 & 0.564415 & 4.7558 & 5e-06 \tabularnewline
13 & 0.00823 & 0.0693 & 0.472454 \tabularnewline
14 & -0.137613 & -1.1595 & 0.125059 \tabularnewline
15 & 0.092896 & 0.7828 & 0.218187 \tabularnewline
16 & 0.005002 & 0.0421 & 0.483251 \tabularnewline
17 & -0.053878 & -0.454 & 0.325613 \tabularnewline
18 & -0.155733 & -1.3122 & 0.096835 \tabularnewline
19 & -0.177621 & -1.4967 & 0.069457 \tabularnewline
20 & 0.073753 & 0.6215 & 0.268147 \tabularnewline
21 & -0.001357 & -0.0114 & 0.495454 \tabularnewline
22 & -0.050082 & -0.422 & 0.337152 \tabularnewline
23 & -0.074902 & -0.6311 & 0.264988 \tabularnewline
24 & 0.358683 & 3.0223 & 0.001744 \tabularnewline
25 & 0.03907 & 0.3292 & 0.371482 \tabularnewline
26 & -0.078578 & -0.6621 & 0.255022 \tabularnewline
27 & 0.045768 & 0.3856 & 0.350455 \tabularnewline
28 & -0.007654 & -0.0645 & 0.474378 \tabularnewline
29 & 0.016144 & 0.136 & 0.446089 \tabularnewline
30 & -0.157435 & -1.3266 & 0.094451 \tabularnewline
31 & -0.168851 & -1.4228 & 0.079592 \tabularnewline
32 & 0.118006 & 0.9943 & 0.161718 \tabularnewline
33 & -0.009913 & -0.0835 & 0.466833 \tabularnewline
34 & -0.049734 & -0.4191 & 0.338215 \tabularnewline
35 & -0.073361 & -0.6181 & 0.269228 \tabularnewline
36 & 0.262257 & 2.2098 & 0.015172 \tabularnewline
37 & 0.09231 & 0.7778 & 0.219631 \tabularnewline
38 & -0.111176 & -0.9368 & 0.176022 \tabularnewline
39 & 0.037294 & 0.3142 & 0.377127 \tabularnewline
40 & 0.026905 & 0.2267 & 0.410653 \tabularnewline
41 & -0.009588 & -0.0808 & 0.467918 \tabularnewline
42 & -0.058874 & -0.4961 & 0.310685 \tabularnewline
43 & -0.163069 & -1.374 & 0.086876 \tabularnewline
44 & 0.07555 & 0.6366 & 0.263217 \tabularnewline
45 & -0.024143 & -0.2034 & 0.419689 \tabularnewline
46 & 0.026137 & 0.2202 & 0.413162 \tabularnewline
47 & -0.105459 & -0.8886 & 0.188605 \tabularnewline
48 & 0.173816 & 1.4646 & 0.073722 \tabularnewline
\hline
\end{tabular}
%Source: https://freestatistics.org/blog/index.php?pk=40054&T=1

[TABLE]
[ROW][C]Autocorrelation Function[/C][/ROW]
[ROW][C]Time lag k[/C][C]ACF(k)[/C][C]T-STAT[/C][C]P-value[/C][/ROW]
[ROW][C]1[/C][C]-0.263195[/C][C]-2.2177[/C][C]0.014888[/C][/ROW]
[ROW][C]2[/C][C]-0.113552[/C][C]-0.9568[/C][C]0.170956[/C][/ROW]
[ROW][C]3[/C][C]0.064468[/C][C]0.5432[/C][C]0.29434[/C][/ROW]
[ROW][C]4[/C][C]0.081812[/C][C]0.6894[/C][C]0.246421[/C][/ROW]
[ROW][C]5[/C][C]-0.060253[/C][C]-0.5077[/C][C]0.306618[/C][/ROW]
[ROW][C]6[/C][C]-0.280849[/C][C]-2.3665[/C][C]0.010345[/C][/ROW]
[ROW][C]7[/C][C]-0.200181[/C][C]-1.6868[/C][C]0.04802[/C][/ROW]
[ROW][C]8[/C][C]0.180072[/C][C]1.5173[/C][C]0.066814[/C][/ROW]
[ROW][C]9[/C][C]-0.029261[/C][C]-0.2466[/C][C]0.402981[/C][/ROW]
[ROW][C]10[/C][C]-0.06285[/C][C]-0.5296[/C][C]0.299026[/C][/ROW]
[ROW][C]11[/C][C]-0.139253[/C][C]-1.1734[/C][C]0.122285[/C][/ROW]
[ROW][C]12[/C][C]0.564415[/C][C]4.7558[/C][C]5e-06[/C][/ROW]
[ROW][C]13[/C][C]0.00823[/C][C]0.0693[/C][C]0.472454[/C][/ROW]
[ROW][C]14[/C][C]-0.137613[/C][C]-1.1595[/C][C]0.125059[/C][/ROW]
[ROW][C]15[/C][C]0.092896[/C][C]0.7828[/C][C]0.218187[/C][/ROW]
[ROW][C]16[/C][C]0.005002[/C][C]0.0421[/C][C]0.483251[/C][/ROW]
[ROW][C]17[/C][C]-0.053878[/C][C]-0.454[/C][C]0.325613[/C][/ROW]
[ROW][C]18[/C][C]-0.155733[/C][C]-1.3122[/C][C]0.096835[/C][/ROW]
[ROW][C]19[/C][C]-0.177621[/C][C]-1.4967[/C][C]0.069457[/C][/ROW]
[ROW][C]20[/C][C]0.073753[/C][C]0.6215[/C][C]0.268147[/C][/ROW]
[ROW][C]21[/C][C]-0.001357[/C][C]-0.0114[/C][C]0.495454[/C][/ROW]
[ROW][C]22[/C][C]-0.050082[/C][C]-0.422[/C][C]0.337152[/C][/ROW]
[ROW][C]23[/C][C]-0.074902[/C][C]-0.6311[/C][C]0.264988[/C][/ROW]
[ROW][C]24[/C][C]0.358683[/C][C]3.0223[/C][C]0.001744[/C][/ROW]
[ROW][C]25[/C][C]0.03907[/C][C]0.3292[/C][C]0.371482[/C][/ROW]
[ROW][C]26[/C][C]-0.078578[/C][C]-0.6621[/C][C]0.255022[/C][/ROW]
[ROW][C]27[/C][C]0.045768[/C][C]0.3856[/C][C]0.350455[/C][/ROW]
[ROW][C]28[/C][C]-0.007654[/C][C]-0.0645[/C][C]0.474378[/C][/ROW]
[ROW][C]29[/C][C]0.016144[/C][C]0.136[/C][C]0.446089[/C][/ROW]
[ROW][C]30[/C][C]-0.157435[/C][C]-1.3266[/C][C]0.094451[/C][/ROW]
[ROW][C]31[/C][C]-0.168851[/C][C]-1.4228[/C][C]0.079592[/C][/ROW]
[ROW][C]32[/C][C]0.118006[/C][C]0.9943[/C][C]0.161718[/C][/ROW]
[ROW][C]33[/C][C]-0.009913[/C][C]-0.0835[/C][C]0.466833[/C][/ROW]
[ROW][C]34[/C][C]-0.049734[/C][C]-0.4191[/C][C]0.338215[/C][/ROW]
[ROW][C]35[/C][C]-0.073361[/C][C]-0.6181[/C][C]0.269228[/C][/ROW]
[ROW][C]36[/C][C]0.262257[/C][C]2.2098[/C][C]0.015172[/C][/ROW]
[ROW][C]37[/C][C]0.09231[/C][C]0.7778[/C][C]0.219631[/C][/ROW]
[ROW][C]38[/C][C]-0.111176[/C][C]-0.9368[/C][C]0.176022[/C][/ROW]
[ROW][C]39[/C][C]0.037294[/C][C]0.3142[/C][C]0.377127[/C][/ROW]
[ROW][C]40[/C][C]0.026905[/C][C]0.2267[/C][C]0.410653[/C][/ROW]
[ROW][C]41[/C][C]-0.009588[/C][C]-0.0808[/C][C]0.467918[/C][/ROW]
[ROW][C]42[/C][C]-0.058874[/C][C]-0.4961[/C][C]0.310685[/C][/ROW]
[ROW][C]43[/C][C]-0.163069[/C][C]-1.374[/C][C]0.086876[/C][/ROW]
[ROW][C]44[/C][C]0.07555[/C][C]0.6366[/C][C]0.263217[/C][/ROW]
[ROW][C]45[/C][C]-0.024143[/C][C]-0.2034[/C][C]0.419689[/C][/ROW]
[ROW][C]46[/C][C]0.026137[/C][C]0.2202[/C][C]0.413162[/C][/ROW]
[ROW][C]47[/C][C]-0.105459[/C][C]-0.8886[/C][C]0.188605[/C][/ROW]
[ROW][C]48[/C][C]0.173816[/C][C]1.4646[/C][C]0.073722[/C][/ROW]
[/TABLE]
Source: https://freestatistics.org/blog/index.php?pk=40054&T=1

Globally Unique Identifier (entire table): ba.freestatistics.org/blog/index.php?pk=40054&T=1

As an alternative you can also use a QR Code:  

The GUIDs for individual cells are displayed in the table below:

Autocorrelation Function
Time lag kACF(k)T-STATP-value
1-0.263195-2.21770.014888
2-0.113552-0.95680.170956
30.0644680.54320.29434
40.0818120.68940.246421
5-0.060253-0.50770.306618
6-0.280849-2.36650.010345
7-0.200181-1.68680.04802
80.1800721.51730.066814
9-0.029261-0.24660.402981
10-0.06285-0.52960.299026
11-0.139253-1.17340.122285
120.5644154.75585e-06
130.008230.06930.472454
14-0.137613-1.15950.125059
150.0928960.78280.218187
160.0050020.04210.483251
17-0.053878-0.4540.325613
18-0.155733-1.31220.096835
19-0.177621-1.49670.069457
200.0737530.62150.268147
21-0.001357-0.01140.495454
22-0.050082-0.4220.337152
23-0.074902-0.63110.264988
240.3586833.02230.001744
250.039070.32920.371482
26-0.078578-0.66210.255022
270.0457680.38560.350455
28-0.007654-0.06450.474378
290.0161440.1360.446089
30-0.157435-1.32660.094451
31-0.168851-1.42280.079592
320.1180060.99430.161718
33-0.009913-0.08350.466833
34-0.049734-0.41910.338215
35-0.073361-0.61810.269228
360.2622572.20980.015172
370.092310.77780.219631
38-0.111176-0.93680.176022
390.0372940.31420.377127
400.0269050.22670.410653
41-0.009588-0.08080.467918
42-0.058874-0.49610.310685
43-0.163069-1.3740.086876
440.075550.63660.263217
45-0.024143-0.20340.419689
460.0261370.22020.413162
47-0.105459-0.88860.188605
480.1738161.46460.073722


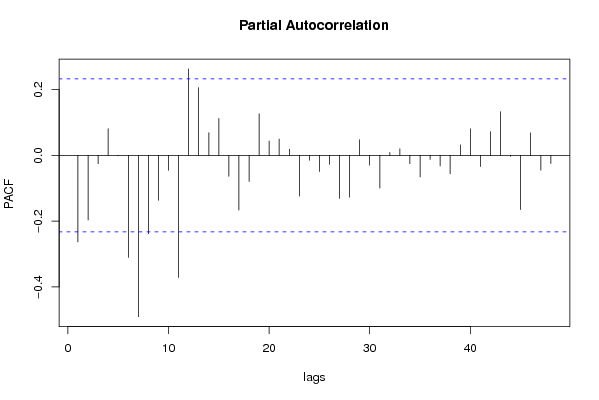
Partial Autocorrelation Function
Time lag kPACF(k)T-STATP-value
1-0.263195-2.21770.014888
2-0.196431-1.65520.051154
3-0.02569-0.21650.414621
40.0810230.68270.248504
5-0.000878-0.00740.497058
6-0.310334-2.61490.005446
7-0.490474-4.13284.8e-05
8-0.23811-2.00630.024314
9-0.136785-1.15260.126476
10-0.045632-0.38450.350878
11-0.371275-3.12840.001275
120.2626642.21320.015048
130.2062531.73790.04328
140.0689750.58120.281475
150.1121280.94480.173982
16-0.063719-0.53690.296506
17-0.166379-1.40190.082645
18-0.079271-0.66790.253167
190.1262531.06380.145506
200.043340.36520.358027
210.0496660.41850.338426
220.0186540.15720.437775
23-0.123772-1.04290.150262
24-0.014768-0.12440.45066
25-0.049303-0.41540.339538
26-0.027594-0.23250.408406
27-0.13125-1.10590.136244
28-0.127384-1.07340.143373
290.0476070.40110.34476
30-0.029902-0.2520.4009
31-0.099447-0.8380.202433
320.0089340.07530.470102
330.0198180.1670.433928
34-0.02563-0.2160.414818
35-0.065517-0.55210.291322
36-0.012592-0.10610.457901
37-0.032328-0.27240.393052
38-0.056312-0.47450.318301
390.0318210.26810.394688
400.080580.6790.24968
41-0.03411-0.28740.387317
420.0723910.610.271912
430.132851.11940.133368
44-0.00349-0.02940.48831
45-0.164798-1.38860.084646
460.0684440.57670.282976
47-0.045178-0.38070.352291
48-0.025021-0.21080.416811

\begin{tabular}{lllllllll}
\hline
Partial Autocorrelation Function \tabularnewline
Time lag k & PACF(k) & T-STAT & P-value \tabularnewline
1 & -0.263195 & -2.2177 & 0.014888 \tabularnewline
2 & -0.196431 & -1.6552 & 0.051154 \tabularnewline
3 & -0.02569 & -0.2165 & 0.414621 \tabularnewline
4 & 0.081023 & 0.6827 & 0.248504 \tabularnewline
5 & -0.000878 & -0.0074 & 0.497058 \tabularnewline
6 & -0.310334 & -2.6149 & 0.005446 \tabularnewline
7 & -0.490474 & -4.1328 & 4.8e-05 \tabularnewline
8 & -0.23811 & -2.0063 & 0.024314 \tabularnewline
9 & -0.136785 & -1.1526 & 0.126476 \tabularnewline
10 & -0.045632 & -0.3845 & 0.350878 \tabularnewline
11 & -0.371275 & -3.1284 & 0.001275 \tabularnewline
12 & 0.262664 & 2.2132 & 0.015048 \tabularnewline
13 & 0.206253 & 1.7379 & 0.04328 \tabularnewline
14 & 0.068975 & 0.5812 & 0.281475 \tabularnewline
15 & 0.112128 & 0.9448 & 0.173982 \tabularnewline
16 & -0.063719 & -0.5369 & 0.296506 \tabularnewline
17 & -0.166379 & -1.4019 & 0.082645 \tabularnewline
18 & -0.079271 & -0.6679 & 0.253167 \tabularnewline
19 & 0.126253 & 1.0638 & 0.145506 \tabularnewline
20 & 0.04334 & 0.3652 & 0.358027 \tabularnewline
21 & 0.049666 & 0.4185 & 0.338426 \tabularnewline
22 & 0.018654 & 0.1572 & 0.437775 \tabularnewline
23 & -0.123772 & -1.0429 & 0.150262 \tabularnewline
24 & -0.014768 & -0.1244 & 0.45066 \tabularnewline
25 & -0.049303 & -0.4154 & 0.339538 \tabularnewline
26 & -0.027594 & -0.2325 & 0.408406 \tabularnewline
27 & -0.13125 & -1.1059 & 0.136244 \tabularnewline
28 & -0.127384 & -1.0734 & 0.143373 \tabularnewline
29 & 0.047607 & 0.4011 & 0.34476 \tabularnewline
30 & -0.029902 & -0.252 & 0.4009 \tabularnewline
31 & -0.099447 & -0.838 & 0.202433 \tabularnewline
32 & 0.008934 & 0.0753 & 0.470102 \tabularnewline
33 & 0.019818 & 0.167 & 0.433928 \tabularnewline
34 & -0.02563 & -0.216 & 0.414818 \tabularnewline
35 & -0.065517 & -0.5521 & 0.291322 \tabularnewline
36 & -0.012592 & -0.1061 & 0.457901 \tabularnewline
37 & -0.032328 & -0.2724 & 0.393052 \tabularnewline
38 & -0.056312 & -0.4745 & 0.318301 \tabularnewline
39 & 0.031821 & 0.2681 & 0.394688 \tabularnewline
40 & 0.08058 & 0.679 & 0.24968 \tabularnewline
41 & -0.03411 & -0.2874 & 0.387317 \tabularnewline
42 & 0.072391 & 0.61 & 0.271912 \tabularnewline
43 & 0.13285 & 1.1194 & 0.133368 \tabularnewline
44 & -0.00349 & -0.0294 & 0.48831 \tabularnewline
45 & -0.164798 & -1.3886 & 0.084646 \tabularnewline
46 & 0.068444 & 0.5767 & 0.282976 \tabularnewline
47 & -0.045178 & -0.3807 & 0.352291 \tabularnewline
48 & -0.025021 & -0.2108 & 0.416811 \tabularnewline
\hline
\end{tabular}
%Source: https://freestatistics.org/blog/index.php?pk=40054&T=2

[TABLE]
[ROW][C]Partial Autocorrelation Function[/C][/ROW]
[ROW][C]Time lag k[/C][C]PACF(k)[/C][C]T-STAT[/C][C]P-value[/C][/ROW]
[ROW][C]1[/C][C]-0.263195[/C][C]-2.2177[/C][C]0.014888[/C][/ROW]
[ROW][C]2[/C][C]-0.196431[/C][C]-1.6552[/C][C]0.051154[/C][/ROW]
[ROW][C]3[/C][C]-0.02569[/C][C]-0.2165[/C][C]0.414621[/C][/ROW]
[ROW][C]4[/C][C]0.081023[/C][C]0.6827[/C][C]0.248504[/C][/ROW]
[ROW][C]5[/C][C]-0.000878[/C][C]-0.0074[/C][C]0.497058[/C][/ROW]
[ROW][C]6[/C][C]-0.310334[/C][C]-2.6149[/C][C]0.005446[/C][/ROW]
[ROW][C]7[/C][C]-0.490474[/C][C]-4.1328[/C][C]4.8e-05[/C][/ROW]
[ROW][C]8[/C][C]-0.23811[/C][C]-2.0063[/C][C]0.024314[/C][/ROW]
[ROW][C]9[/C][C]-0.136785[/C][C]-1.1526[/C][C]0.126476[/C][/ROW]
[ROW][C]10[/C][C]-0.045632[/C][C]-0.3845[/C][C]0.350878[/C][/ROW]
[ROW][C]11[/C][C]-0.371275[/C][C]-3.1284[/C][C]0.001275[/C][/ROW]
[ROW][C]12[/C][C]0.262664[/C][C]2.2132[/C][C]0.015048[/C][/ROW]
[ROW][C]13[/C][C]0.206253[/C][C]1.7379[/C][C]0.04328[/C][/ROW]
[ROW][C]14[/C][C]0.068975[/C][C]0.5812[/C][C]0.281475[/C][/ROW]
[ROW][C]15[/C][C]0.112128[/C][C]0.9448[/C][C]0.173982[/C][/ROW]
[ROW][C]16[/C][C]-0.063719[/C][C]-0.5369[/C][C]0.296506[/C][/ROW]
[ROW][C]17[/C][C]-0.166379[/C][C]-1.4019[/C][C]0.082645[/C][/ROW]
[ROW][C]18[/C][C]-0.079271[/C][C]-0.6679[/C][C]0.253167[/C][/ROW]
[ROW][C]19[/C][C]0.126253[/C][C]1.0638[/C][C]0.145506[/C][/ROW]
[ROW][C]20[/C][C]0.04334[/C][C]0.3652[/C][C]0.358027[/C][/ROW]
[ROW][C]21[/C][C]0.049666[/C][C]0.4185[/C][C]0.338426[/C][/ROW]
[ROW][C]22[/C][C]0.018654[/C][C]0.1572[/C][C]0.437775[/C][/ROW]
[ROW][C]23[/C][C]-0.123772[/C][C]-1.0429[/C][C]0.150262[/C][/ROW]
[ROW][C]24[/C][C]-0.014768[/C][C]-0.1244[/C][C]0.45066[/C][/ROW]
[ROW][C]25[/C][C]-0.049303[/C][C]-0.4154[/C][C]0.339538[/C][/ROW]
[ROW][C]26[/C][C]-0.027594[/C][C]-0.2325[/C][C]0.408406[/C][/ROW]
[ROW][C]27[/C][C]-0.13125[/C][C]-1.1059[/C][C]0.136244[/C][/ROW]
[ROW][C]28[/C][C]-0.127384[/C][C]-1.0734[/C][C]0.143373[/C][/ROW]
[ROW][C]29[/C][C]0.047607[/C][C]0.4011[/C][C]0.34476[/C][/ROW]
[ROW][C]30[/C][C]-0.029902[/C][C]-0.252[/C][C]0.4009[/C][/ROW]
[ROW][C]31[/C][C]-0.099447[/C][C]-0.838[/C][C]0.202433[/C][/ROW]
[ROW][C]32[/C][C]0.008934[/C][C]0.0753[/C][C]0.470102[/C][/ROW]
[ROW][C]33[/C][C]0.019818[/C][C]0.167[/C][C]0.433928[/C][/ROW]
[ROW][C]34[/C][C]-0.02563[/C][C]-0.216[/C][C]0.414818[/C][/ROW]
[ROW][C]35[/C][C]-0.065517[/C][C]-0.5521[/C][C]0.291322[/C][/ROW]
[ROW][C]36[/C][C]-0.012592[/C][C]-0.1061[/C][C]0.457901[/C][/ROW]
[ROW][C]37[/C][C]-0.032328[/C][C]-0.2724[/C][C]0.393052[/C][/ROW]
[ROW][C]38[/C][C]-0.056312[/C][C]-0.4745[/C][C]0.318301[/C][/ROW]
[ROW][C]39[/C][C]0.031821[/C][C]0.2681[/C][C]0.394688[/C][/ROW]
[ROW][C]40[/C][C]0.08058[/C][C]0.679[/C][C]0.24968[/C][/ROW]
[ROW][C]41[/C][C]-0.03411[/C][C]-0.2874[/C][C]0.387317[/C][/ROW]
[ROW][C]42[/C][C]0.072391[/C][C]0.61[/C][C]0.271912[/C][/ROW]
[ROW][C]43[/C][C]0.13285[/C][C]1.1194[/C][C]0.133368[/C][/ROW]
[ROW][C]44[/C][C]-0.00349[/C][C]-0.0294[/C][C]0.48831[/C][/ROW]
[ROW][C]45[/C][C]-0.164798[/C][C]-1.3886[/C][C]0.084646[/C][/ROW]
[ROW][C]46[/C][C]0.068444[/C][C]0.5767[/C][C]0.282976[/C][/ROW]
[ROW][C]47[/C][C]-0.045178[/C][C]-0.3807[/C][C]0.352291[/C][/ROW]
[ROW][C]48[/C][C]-0.025021[/C][C]-0.2108[/C][C]0.416811[/C][/ROW]
[/TABLE]
Source: https://freestatistics.org/blog/index.php?pk=40054&T=2

Globally Unique Identifier (entire table): ba.freestatistics.org/blog/index.php?pk=40054&T=2

As an alternative you can also use a QR Code:  

The GUIDs for individual cells are displayed in the table below:

Partial Autocorrelation Function
Time lag kPACF(k)T-STATP-value
1-0.263195-2.21770.014888
2-0.196431-1.65520.051154
3-0.02569-0.21650.414621
40.0810230.68270.248504
5-0.000878-0.00740.497058
6-0.310334-2.61490.005446
7-0.490474-4.13284.8e-05
8-0.23811-2.00630.024314
9-0.136785-1.15260.126476
10-0.045632-0.38450.350878
11-0.371275-3.12840.001275
120.2626642.21320.015048
130.2062531.73790.04328
140.0689750.58120.281475
150.1121280.94480.173982
16-0.063719-0.53690.296506
17-0.166379-1.40190.082645
18-0.079271-0.66790.253167
190.1262531.06380.145506
200.043340.36520.358027
210.0496660.41850.338426
220.0186540.15720.437775
23-0.123772-1.04290.150262
24-0.014768-0.12440.45066
25-0.049303-0.41540.339538
26-0.027594-0.23250.408406
27-0.13125-1.10590.136244
28-0.127384-1.07340.143373
290.0476070.40110.34476
30-0.029902-0.2520.4009
31-0.099447-0.8380.202433
320.0089340.07530.470102
330.0198180.1670.433928
34-0.02563-0.2160.414818
35-0.065517-0.55210.291322
36-0.012592-0.10610.457901
37-0.032328-0.27240.393052
38-0.056312-0.47450.318301
390.0318210.26810.394688
400.080580.6790.24968
41-0.03411-0.28740.387317
420.0723910.610.271912
430.132851.11940.133368
44-0.00349-0.02940.48831
45-0.164798-1.38860.084646
460.0684440.57670.282976
47-0.045178-0.38070.352291
48-0.025021-0.21080.416811


Parameters (Session):
par1 = 48 ; par2 = 1 ; par3 = 1 ; par4 = 0 ; par5 = 12 ;
Parameters (R input):
par1 = 48 ; par2 = 1 ; par3 = 1 ; par4 = 0 ; par5 = 12 ;
R code (references can be found in the software module):
if (par1 == 'Default') {
par1 = 10*log10(length(x))
} else {
par1 <- as.numeric(par1)
}
par2 <- as.numeric(par2)
par3 <- as.numeric(par3)
par4 <- as.numeric(par4)
par5 <- as.numeric(par5)
if (par2 == 0) {
x <- log(x)
} else {
x <- (x ^ par2 - 1) / par2
}
if (par3 > 0) x <- diff(x,lag=1,difference=par3)
if (par4 > 0) x <- diff(x,lag=par5,difference=par4)
bitmap(file='pic1.png')
racf <- acf(x,par1,main='Autocorrelation',xlab='lags',ylab='ACF')
dev.off()
bitmap(file='pic2.png')
rpacf <- pacf(x,par1,main='Partial Autocorrelation',xlab='lags',ylab='PACF')
dev.off()
(myacf <- c(racf$acf))
(mypacf <- c(rpacf$acf))
lengthx <- length(x)
sqrtn <- sqrt(lengthx)
load(file='createtable')
a<-table.start()
a<-table.row.start(a)
a<-table.element(a,'Autocorrelation Function',4,TRUE)
a<-table.row.end(a)
a<-table.row.start(a)
a<-table.element(a,'Time lag k',header=TRUE)
a<-table.element(a,hyperlink('basics.htm','ACF(k)','click here for more information about the Autocorrelation Function'),header=TRUE)
a<-table.element(a,'T-STAT',header=TRUE)
a<-table.element(a,'P-value',header=TRUE)
a<-table.row.end(a)
for (i in 2:(par1+1)) {
a<-table.row.start(a)
a<-table.element(a,i-1,header=TRUE)
a<-table.element(a,round(myacf[i],6))
mytstat <- myacf[i]*sqrtn
a<-table.element(a,round(mytstat,4))
a<-table.element(a,round(1-pt(abs(mytstat),lengthx),6))
a<-table.row.end(a)
}
a<-table.end(a)
table.save(a,file='mytable.tab')
a<-table.start()
a<-table.row.start(a)
a<-table.element(a,'Partial Autocorrelation Function',4,TRUE)
a<-table.row.end(a)
a<-table.row.start(a)
a<-table.element(a,'Time lag k',header=TRUE)
a<-table.element(a,hyperlink('basics.htm','PACF(k)','click here for more information about the Partial Autocorrelation Function'),header=TRUE)
a<-table.element(a,'T-STAT',header=TRUE)
a<-table.element(a,'P-value',header=TRUE)
a<-table.row.end(a)
for (i in 1:par1) {
a<-table.row.start(a)
a<-table.element(a,i,header=TRUE)
a<-table.element(a,round(mypacf[i],6))
mytstat <- mypacf[i]*sqrtn
a<-table.element(a,round(mytstat,4))
a<-table.element(a,round(1-pt(abs(mytstat),lengthx),6))
a<-table.row.end(a)
}
a<-table.end(a)
table.save(a,file='mytable1.tab')