Free Statistics

of Irreproducible Research!

Author's title

Author*Unverified author*
R Software Modulerwasp_autocorrelation.wasp
Title produced by software(Partial) Autocorrelation Function
Date of computationThu, 14 May 2009 11:22:35 -0600
Cite this page as followsStatistical Computations at FreeStatistics.org, Office for Research Development and Education, URL https://freestatistics.org/blog/index.php?v=date/2009/May/14/t12423218189eiag4v4jbsgbqv.htm/, Retrieved Mon, 29 Apr 2024 02:55:23 +0000
Statistical Computations at FreeStatistics.org, Office for Research Development and Education, URL https://freestatistics.org/blog/index.php?pk=40052, Retrieved Mon, 29 Apr 2024 02:55:23 +0000
QR Codes:

Original text written by user:
IsPrivate?No (this computation is public)
User-defined keywords
Estimated Impact106
Family? (F = Feedback message, R = changed R code, M = changed R Module, P = changed Parameters, D = changed Data)
-       [(Partial) Autocorrelation Function] [Time Series Analy...] [2009-05-14 17:22:35] [d41d8cd98f00b204e9800998ecf8427e] [Current]
Feedback Forum

Post a new message
Dataseries X:
464
675
703
887
1139
1077
1318
1260
1120
963
996
960
530
883
894
1045
1199
1287
1565
1577
1076
918
1008
1063
544
635
804
980
1018
1064
1404
1286
1104
999
996
1015
615
722
832
977
1270
1437
1520
1708
1151
934
1159
1209
699
830
996
1124
1458
1270
1753
2258
1208
1241
1265
1828
809
997
1164
1205
1538
1513
1378
2083
1357
1536
1526
1376


Summary of computational transaction
Raw Inputview raw input (R code)
Raw Outputview raw output of R engine
Computing time1 seconds
R Server'George Udny Yule' @ 72.249.76.132

\begin{tabular}{lllllllll}
\hline
Summary of computational transaction \tabularnewline
Raw Input & view raw input (R code)  \tabularnewline
Raw Output & view raw output of R engine  \tabularnewline
Computing time & 1 seconds \tabularnewline
R Server & 'George Udny Yule' @ 72.249.76.132 \tabularnewline
\hline
\end{tabular}
%Source: https://freestatistics.org/blog/index.php?pk=40052&T=0

[TABLE]
[ROW][C]Summary of computational transaction[/C][/ROW]
[ROW][C]Raw Input[/C][C]view raw input (R code) [/C][/ROW]
[ROW][C]Raw Output[/C][C]view raw output of R engine [/C][/ROW]
[ROW][C]Computing time[/C][C]1 seconds[/C][/ROW]
[ROW][C]R Server[/C][C]'George Udny Yule' @ 72.249.76.132[/C][/ROW]
[/TABLE]
Source: https://freestatistics.org/blog/index.php?pk=40052&T=0

Globally Unique Identifier (entire table): ba.freestatistics.org/blog/index.php?pk=40052&T=0

As an alternative you can also use a QR Code:  

The GUIDs for individual cells are displayed in the table below:

Summary of computational transaction
Raw Inputview raw input (R code)
Raw Outputview raw output of R engine
Computing time1 seconds
R Server'George Udny Yule' @ 72.249.76.132


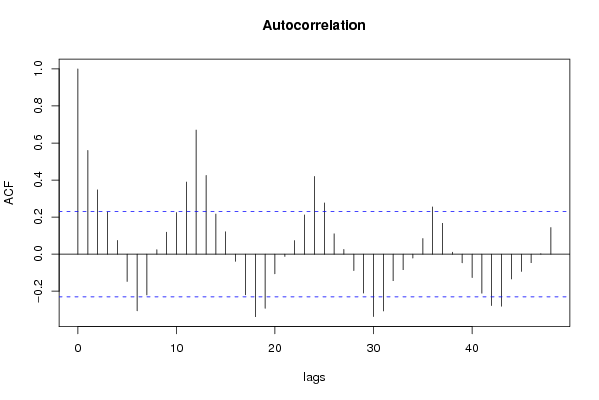
Autocorrelation Function
Time lag kACF(k)T-STATP-value
10.5602184.75365e-06
20.3470712.9450.002173
30.2274131.92970.028794
40.07390.62710.2663
5-0.147591-1.25230.107248
6-0.30614-2.59770.005687
7-0.219919-1.86610.033052
80.0240480.20410.419443
90.1184051.00470.159204
100.2247461.9070.030253
110.3894563.30460.000742
120.6702455.68720
130.4252983.60880.000282
140.2163971.83620.035229
150.1207181.02430.154554
16-0.03844-0.32620.372619
17-0.219874-1.86570.033079
18-0.337498-2.86380.00274
19-0.292311-2.48030.007732
20-0.106289-0.90190.18506
21-0.012029-0.10210.459491
220.073650.62490.266993
230.2118371.79750.038225
240.4193243.55810.000333
250.2767042.34790.010815
260.109520.92930.177918
270.0255250.21660.414571
28-0.088482-0.75080.227612
29-0.209951-1.78150.039525
30-0.337064-2.86010.002769
31-0.306637-2.60190.005624
32-0.143669-1.21910.113399
33-0.084178-0.71430.238685
34-0.021429-0.18180.428113
350.0844820.71690.237891
360.254722.16140.016996
370.1663611.41160.081185
380.0105010.08910.464624
39-0.046748-0.39670.346391
40-0.126681-1.07490.142999
41-0.210904-1.78960.038864
42-0.277878-2.35790.01055
43-0.280946-2.38390.009884
44-0.134209-1.13880.129281
45-0.093386-0.79240.215363
46-0.046087-0.39110.348453
470.0023680.02010.492013
480.14361.21850.113509

\begin{tabular}{lllllllll}
\hline
Autocorrelation Function \tabularnewline
Time lag k & ACF(k) & T-STAT & P-value \tabularnewline
1 & 0.560218 & 4.7536 & 5e-06 \tabularnewline
2 & 0.347071 & 2.945 & 0.002173 \tabularnewline
3 & 0.227413 & 1.9297 & 0.028794 \tabularnewline
4 & 0.0739 & 0.6271 & 0.2663 \tabularnewline
5 & -0.147591 & -1.2523 & 0.107248 \tabularnewline
6 & -0.30614 & -2.5977 & 0.005687 \tabularnewline
7 & -0.219919 & -1.8661 & 0.033052 \tabularnewline
8 & 0.024048 & 0.2041 & 0.419443 \tabularnewline
9 & 0.118405 & 1.0047 & 0.159204 \tabularnewline
10 & 0.224746 & 1.907 & 0.030253 \tabularnewline
11 & 0.389456 & 3.3046 & 0.000742 \tabularnewline
12 & 0.670245 & 5.6872 & 0 \tabularnewline
13 & 0.425298 & 3.6088 & 0.000282 \tabularnewline
14 & 0.216397 & 1.8362 & 0.035229 \tabularnewline
15 & 0.120718 & 1.0243 & 0.154554 \tabularnewline
16 & -0.03844 & -0.3262 & 0.372619 \tabularnewline
17 & -0.219874 & -1.8657 & 0.033079 \tabularnewline
18 & -0.337498 & -2.8638 & 0.00274 \tabularnewline
19 & -0.292311 & -2.4803 & 0.007732 \tabularnewline
20 & -0.106289 & -0.9019 & 0.18506 \tabularnewline
21 & -0.012029 & -0.1021 & 0.459491 \tabularnewline
22 & 0.07365 & 0.6249 & 0.266993 \tabularnewline
23 & 0.211837 & 1.7975 & 0.038225 \tabularnewline
24 & 0.419324 & 3.5581 & 0.000333 \tabularnewline
25 & 0.276704 & 2.3479 & 0.010815 \tabularnewline
26 & 0.10952 & 0.9293 & 0.177918 \tabularnewline
27 & 0.025525 & 0.2166 & 0.414571 \tabularnewline
28 & -0.088482 & -0.7508 & 0.227612 \tabularnewline
29 & -0.209951 & -1.7815 & 0.039525 \tabularnewline
30 & -0.337064 & -2.8601 & 0.002769 \tabularnewline
31 & -0.306637 & -2.6019 & 0.005624 \tabularnewline
32 & -0.143669 & -1.2191 & 0.113399 \tabularnewline
33 & -0.084178 & -0.7143 & 0.238685 \tabularnewline
34 & -0.021429 & -0.1818 & 0.428113 \tabularnewline
35 & 0.084482 & 0.7169 & 0.237891 \tabularnewline
36 & 0.25472 & 2.1614 & 0.016996 \tabularnewline
37 & 0.166361 & 1.4116 & 0.081185 \tabularnewline
38 & 0.010501 & 0.0891 & 0.464624 \tabularnewline
39 & -0.046748 & -0.3967 & 0.346391 \tabularnewline
40 & -0.126681 & -1.0749 & 0.142999 \tabularnewline
41 & -0.210904 & -1.7896 & 0.038864 \tabularnewline
42 & -0.277878 & -2.3579 & 0.01055 \tabularnewline
43 & -0.280946 & -2.3839 & 0.009884 \tabularnewline
44 & -0.134209 & -1.1388 & 0.129281 \tabularnewline
45 & -0.093386 & -0.7924 & 0.215363 \tabularnewline
46 & -0.046087 & -0.3911 & 0.348453 \tabularnewline
47 & 0.002368 & 0.0201 & 0.492013 \tabularnewline
48 & 0.1436 & 1.2185 & 0.113509 \tabularnewline
\hline
\end{tabular}
%Source: https://freestatistics.org/blog/index.php?pk=40052&T=1

[TABLE]
[ROW][C]Autocorrelation Function[/C][/ROW]
[ROW][C]Time lag k[/C][C]ACF(k)[/C][C]T-STAT[/C][C]P-value[/C][/ROW]
[ROW][C]1[/C][C]0.560218[/C][C]4.7536[/C][C]5e-06[/C][/ROW]
[ROW][C]2[/C][C]0.347071[/C][C]2.945[/C][C]0.002173[/C][/ROW]
[ROW][C]3[/C][C]0.227413[/C][C]1.9297[/C][C]0.028794[/C][/ROW]
[ROW][C]4[/C][C]0.0739[/C][C]0.6271[/C][C]0.2663[/C][/ROW]
[ROW][C]5[/C][C]-0.147591[/C][C]-1.2523[/C][C]0.107248[/C][/ROW]
[ROW][C]6[/C][C]-0.30614[/C][C]-2.5977[/C][C]0.005687[/C][/ROW]
[ROW][C]7[/C][C]-0.219919[/C][C]-1.8661[/C][C]0.033052[/C][/ROW]
[ROW][C]8[/C][C]0.024048[/C][C]0.2041[/C][C]0.419443[/C][/ROW]
[ROW][C]9[/C][C]0.118405[/C][C]1.0047[/C][C]0.159204[/C][/ROW]
[ROW][C]10[/C][C]0.224746[/C][C]1.907[/C][C]0.030253[/C][/ROW]
[ROW][C]11[/C][C]0.389456[/C][C]3.3046[/C][C]0.000742[/C][/ROW]
[ROW][C]12[/C][C]0.670245[/C][C]5.6872[/C][C]0[/C][/ROW]
[ROW][C]13[/C][C]0.425298[/C][C]3.6088[/C][C]0.000282[/C][/ROW]
[ROW][C]14[/C][C]0.216397[/C][C]1.8362[/C][C]0.035229[/C][/ROW]
[ROW][C]15[/C][C]0.120718[/C][C]1.0243[/C][C]0.154554[/C][/ROW]
[ROW][C]16[/C][C]-0.03844[/C][C]-0.3262[/C][C]0.372619[/C][/ROW]
[ROW][C]17[/C][C]-0.219874[/C][C]-1.8657[/C][C]0.033079[/C][/ROW]
[ROW][C]18[/C][C]-0.337498[/C][C]-2.8638[/C][C]0.00274[/C][/ROW]
[ROW][C]19[/C][C]-0.292311[/C][C]-2.4803[/C][C]0.007732[/C][/ROW]
[ROW][C]20[/C][C]-0.106289[/C][C]-0.9019[/C][C]0.18506[/C][/ROW]
[ROW][C]21[/C][C]-0.012029[/C][C]-0.1021[/C][C]0.459491[/C][/ROW]
[ROW][C]22[/C][C]0.07365[/C][C]0.6249[/C][C]0.266993[/C][/ROW]
[ROW][C]23[/C][C]0.211837[/C][C]1.7975[/C][C]0.038225[/C][/ROW]
[ROW][C]24[/C][C]0.419324[/C][C]3.5581[/C][C]0.000333[/C][/ROW]
[ROW][C]25[/C][C]0.276704[/C][C]2.3479[/C][C]0.010815[/C][/ROW]
[ROW][C]26[/C][C]0.10952[/C][C]0.9293[/C][C]0.177918[/C][/ROW]
[ROW][C]27[/C][C]0.025525[/C][C]0.2166[/C][C]0.414571[/C][/ROW]
[ROW][C]28[/C][C]-0.088482[/C][C]-0.7508[/C][C]0.227612[/C][/ROW]
[ROW][C]29[/C][C]-0.209951[/C][C]-1.7815[/C][C]0.039525[/C][/ROW]
[ROW][C]30[/C][C]-0.337064[/C][C]-2.8601[/C][C]0.002769[/C][/ROW]
[ROW][C]31[/C][C]-0.306637[/C][C]-2.6019[/C][C]0.005624[/C][/ROW]
[ROW][C]32[/C][C]-0.143669[/C][C]-1.2191[/C][C]0.113399[/C][/ROW]
[ROW][C]33[/C][C]-0.084178[/C][C]-0.7143[/C][C]0.238685[/C][/ROW]
[ROW][C]34[/C][C]-0.021429[/C][C]-0.1818[/C][C]0.428113[/C][/ROW]
[ROW][C]35[/C][C]0.084482[/C][C]0.7169[/C][C]0.237891[/C][/ROW]
[ROW][C]36[/C][C]0.25472[/C][C]2.1614[/C][C]0.016996[/C][/ROW]
[ROW][C]37[/C][C]0.166361[/C][C]1.4116[/C][C]0.081185[/C][/ROW]
[ROW][C]38[/C][C]0.010501[/C][C]0.0891[/C][C]0.464624[/C][/ROW]
[ROW][C]39[/C][C]-0.046748[/C][C]-0.3967[/C][C]0.346391[/C][/ROW]
[ROW][C]40[/C][C]-0.126681[/C][C]-1.0749[/C][C]0.142999[/C][/ROW]
[ROW][C]41[/C][C]-0.210904[/C][C]-1.7896[/C][C]0.038864[/C][/ROW]
[ROW][C]42[/C][C]-0.277878[/C][C]-2.3579[/C][C]0.01055[/C][/ROW]
[ROW][C]43[/C][C]-0.280946[/C][C]-2.3839[/C][C]0.009884[/C][/ROW]
[ROW][C]44[/C][C]-0.134209[/C][C]-1.1388[/C][C]0.129281[/C][/ROW]
[ROW][C]45[/C][C]-0.093386[/C][C]-0.7924[/C][C]0.215363[/C][/ROW]
[ROW][C]46[/C][C]-0.046087[/C][C]-0.3911[/C][C]0.348453[/C][/ROW]
[ROW][C]47[/C][C]0.002368[/C][C]0.0201[/C][C]0.492013[/C][/ROW]
[ROW][C]48[/C][C]0.1436[/C][C]1.2185[/C][C]0.113509[/C][/ROW]
[/TABLE]
Source: https://freestatistics.org/blog/index.php?pk=40052&T=1

Globally Unique Identifier (entire table): ba.freestatistics.org/blog/index.php?pk=40052&T=1

As an alternative you can also use a QR Code:  

The GUIDs for individual cells are displayed in the table below:

Autocorrelation Function
Time lag kACF(k)T-STATP-value
10.5602184.75365e-06
20.3470712.9450.002173
30.2274131.92970.028794
40.07390.62710.2663
5-0.147591-1.25230.107248
6-0.30614-2.59770.005687
7-0.219919-1.86610.033052
80.0240480.20410.419443
90.1184051.00470.159204
100.2247461.9070.030253
110.3894563.30460.000742
120.6702455.68720
130.4252983.60880.000282
140.2163971.83620.035229
150.1207181.02430.154554
16-0.03844-0.32620.372619
17-0.219874-1.86570.033079
18-0.337498-2.86380.00274
19-0.292311-2.48030.007732
20-0.106289-0.90190.18506
21-0.012029-0.10210.459491
220.073650.62490.266993
230.2118371.79750.038225
240.4193243.55810.000333
250.2767042.34790.010815
260.109520.92930.177918
270.0255250.21660.414571
28-0.088482-0.75080.227612
29-0.209951-1.78150.039525
30-0.337064-2.86010.002769
31-0.306637-2.60190.005624
32-0.143669-1.21910.113399
33-0.084178-0.71430.238685
34-0.021429-0.18180.428113
350.0844820.71690.237891
360.254722.16140.016996
370.1663611.41160.081185
380.0105010.08910.464624
39-0.046748-0.39670.346391
40-0.126681-1.07490.142999
41-0.210904-1.78960.038864
42-0.277878-2.35790.01055
43-0.280946-2.38390.009884
44-0.134209-1.13880.129281
45-0.093386-0.79240.215363
46-0.046087-0.39110.348453
470.0023680.02010.492013
480.14361.21850.113509


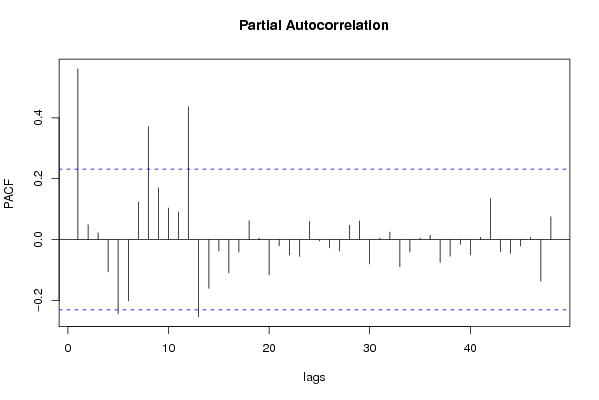
Partial Autocorrelation Function
Time lag kPACF(k)T-STATP-value
10.5602184.75365e-06
20.0484260.41090.341181
30.0222990.18920.42523
4-0.10561-0.89610.186585
5-0.242903-2.06110.021453
6-0.200815-1.7040.046349
70.1238581.0510.148393
80.3704773.14360.001212
90.1695571.43870.077279
100.1035070.87830.191355
110.0907070.76970.222004
120.435853.69830.00021
13-0.252972-2.14650.0176
14-0.159939-1.35710.08949
15-0.03782-0.32090.374603
16-0.109138-0.92610.178753
17-0.040449-0.34320.366217
180.0618370.52470.300699
190.0047090.040.484118
20-0.115062-0.97630.166083
21-0.02057-0.17450.430963
22-0.050804-0.43110.333846
23-0.05484-0.46530.321548
240.0600880.50990.305854
25-0.003923-0.03330.486767
26-0.026922-0.22840.409975
27-0.037174-0.31540.376672
280.0467460.39670.346398
290.0611830.51920.302622
30-0.080113-0.67980.249411
310.0052260.04430.482377
320.0245950.20870.417636
33-0.089006-0.75520.226284
34-0.04045-0.34320.366212
350.0049470.0420.483317
360.0140160.11890.45283
37-0.074858-0.63520.263658
38-0.054292-0.46070.323206
39-0.015721-0.13340.447124
40-0.050131-0.42540.335917
410.0076860.06520.47409
420.1345011.14130.128769
43-0.039536-0.33550.369121
44-0.045036-0.38210.351739
45-0.021267-0.18050.428652
460.0067970.05770.477085
47-0.137142-1.16370.124196
480.0753540.63940.262296

\begin{tabular}{lllllllll}
\hline
Partial Autocorrelation Function \tabularnewline
Time lag k & PACF(k) & T-STAT & P-value \tabularnewline
1 & 0.560218 & 4.7536 & 5e-06 \tabularnewline
2 & 0.048426 & 0.4109 & 0.341181 \tabularnewline
3 & 0.022299 & 0.1892 & 0.42523 \tabularnewline
4 & -0.10561 & -0.8961 & 0.186585 \tabularnewline
5 & -0.242903 & -2.0611 & 0.021453 \tabularnewline
6 & -0.200815 & -1.704 & 0.046349 \tabularnewline
7 & 0.123858 & 1.051 & 0.148393 \tabularnewline
8 & 0.370477 & 3.1436 & 0.001212 \tabularnewline
9 & 0.169557 & 1.4387 & 0.077279 \tabularnewline
10 & 0.103507 & 0.8783 & 0.191355 \tabularnewline
11 & 0.090707 & 0.7697 & 0.222004 \tabularnewline
12 & 0.43585 & 3.6983 & 0.00021 \tabularnewline
13 & -0.252972 & -2.1465 & 0.0176 \tabularnewline
14 & -0.159939 & -1.3571 & 0.08949 \tabularnewline
15 & -0.03782 & -0.3209 & 0.374603 \tabularnewline
16 & -0.109138 & -0.9261 & 0.178753 \tabularnewline
17 & -0.040449 & -0.3432 & 0.366217 \tabularnewline
18 & 0.061837 & 0.5247 & 0.300699 \tabularnewline
19 & 0.004709 & 0.04 & 0.484118 \tabularnewline
20 & -0.115062 & -0.9763 & 0.166083 \tabularnewline
21 & -0.02057 & -0.1745 & 0.430963 \tabularnewline
22 & -0.050804 & -0.4311 & 0.333846 \tabularnewline
23 & -0.05484 & -0.4653 & 0.321548 \tabularnewline
24 & 0.060088 & 0.5099 & 0.305854 \tabularnewline
25 & -0.003923 & -0.0333 & 0.486767 \tabularnewline
26 & -0.026922 & -0.2284 & 0.409975 \tabularnewline
27 & -0.037174 & -0.3154 & 0.376672 \tabularnewline
28 & 0.046746 & 0.3967 & 0.346398 \tabularnewline
29 & 0.061183 & 0.5192 & 0.302622 \tabularnewline
30 & -0.080113 & -0.6798 & 0.249411 \tabularnewline
31 & 0.005226 & 0.0443 & 0.482377 \tabularnewline
32 & 0.024595 & 0.2087 & 0.417636 \tabularnewline
33 & -0.089006 & -0.7552 & 0.226284 \tabularnewline
34 & -0.04045 & -0.3432 & 0.366212 \tabularnewline
35 & 0.004947 & 0.042 & 0.483317 \tabularnewline
36 & 0.014016 & 0.1189 & 0.45283 \tabularnewline
37 & -0.074858 & -0.6352 & 0.263658 \tabularnewline
38 & -0.054292 & -0.4607 & 0.323206 \tabularnewline
39 & -0.015721 & -0.1334 & 0.447124 \tabularnewline
40 & -0.050131 & -0.4254 & 0.335917 \tabularnewline
41 & 0.007686 & 0.0652 & 0.47409 \tabularnewline
42 & 0.134501 & 1.1413 & 0.128769 \tabularnewline
43 & -0.039536 & -0.3355 & 0.369121 \tabularnewline
44 & -0.045036 & -0.3821 & 0.351739 \tabularnewline
45 & -0.021267 & -0.1805 & 0.428652 \tabularnewline
46 & 0.006797 & 0.0577 & 0.477085 \tabularnewline
47 & -0.137142 & -1.1637 & 0.124196 \tabularnewline
48 & 0.075354 & 0.6394 & 0.262296 \tabularnewline
\hline
\end{tabular}
%Source: https://freestatistics.org/blog/index.php?pk=40052&T=2

[TABLE]
[ROW][C]Partial Autocorrelation Function[/C][/ROW]
[ROW][C]Time lag k[/C][C]PACF(k)[/C][C]T-STAT[/C][C]P-value[/C][/ROW]
[ROW][C]1[/C][C]0.560218[/C][C]4.7536[/C][C]5e-06[/C][/ROW]
[ROW][C]2[/C][C]0.048426[/C][C]0.4109[/C][C]0.341181[/C][/ROW]
[ROW][C]3[/C][C]0.022299[/C][C]0.1892[/C][C]0.42523[/C][/ROW]
[ROW][C]4[/C][C]-0.10561[/C][C]-0.8961[/C][C]0.186585[/C][/ROW]
[ROW][C]5[/C][C]-0.242903[/C][C]-2.0611[/C][C]0.021453[/C][/ROW]
[ROW][C]6[/C][C]-0.200815[/C][C]-1.704[/C][C]0.046349[/C][/ROW]
[ROW][C]7[/C][C]0.123858[/C][C]1.051[/C][C]0.148393[/C][/ROW]
[ROW][C]8[/C][C]0.370477[/C][C]3.1436[/C][C]0.001212[/C][/ROW]
[ROW][C]9[/C][C]0.169557[/C][C]1.4387[/C][C]0.077279[/C][/ROW]
[ROW][C]10[/C][C]0.103507[/C][C]0.8783[/C][C]0.191355[/C][/ROW]
[ROW][C]11[/C][C]0.090707[/C][C]0.7697[/C][C]0.222004[/C][/ROW]
[ROW][C]12[/C][C]0.43585[/C][C]3.6983[/C][C]0.00021[/C][/ROW]
[ROW][C]13[/C][C]-0.252972[/C][C]-2.1465[/C][C]0.0176[/C][/ROW]
[ROW][C]14[/C][C]-0.159939[/C][C]-1.3571[/C][C]0.08949[/C][/ROW]
[ROW][C]15[/C][C]-0.03782[/C][C]-0.3209[/C][C]0.374603[/C][/ROW]
[ROW][C]16[/C][C]-0.109138[/C][C]-0.9261[/C][C]0.178753[/C][/ROW]
[ROW][C]17[/C][C]-0.040449[/C][C]-0.3432[/C][C]0.366217[/C][/ROW]
[ROW][C]18[/C][C]0.061837[/C][C]0.5247[/C][C]0.300699[/C][/ROW]
[ROW][C]19[/C][C]0.004709[/C][C]0.04[/C][C]0.484118[/C][/ROW]
[ROW][C]20[/C][C]-0.115062[/C][C]-0.9763[/C][C]0.166083[/C][/ROW]
[ROW][C]21[/C][C]-0.02057[/C][C]-0.1745[/C][C]0.430963[/C][/ROW]
[ROW][C]22[/C][C]-0.050804[/C][C]-0.4311[/C][C]0.333846[/C][/ROW]
[ROW][C]23[/C][C]-0.05484[/C][C]-0.4653[/C][C]0.321548[/C][/ROW]
[ROW][C]24[/C][C]0.060088[/C][C]0.5099[/C][C]0.305854[/C][/ROW]
[ROW][C]25[/C][C]-0.003923[/C][C]-0.0333[/C][C]0.486767[/C][/ROW]
[ROW][C]26[/C][C]-0.026922[/C][C]-0.2284[/C][C]0.409975[/C][/ROW]
[ROW][C]27[/C][C]-0.037174[/C][C]-0.3154[/C][C]0.376672[/C][/ROW]
[ROW][C]28[/C][C]0.046746[/C][C]0.3967[/C][C]0.346398[/C][/ROW]
[ROW][C]29[/C][C]0.061183[/C][C]0.5192[/C][C]0.302622[/C][/ROW]
[ROW][C]30[/C][C]-0.080113[/C][C]-0.6798[/C][C]0.249411[/C][/ROW]
[ROW][C]31[/C][C]0.005226[/C][C]0.0443[/C][C]0.482377[/C][/ROW]
[ROW][C]32[/C][C]0.024595[/C][C]0.2087[/C][C]0.417636[/C][/ROW]
[ROW][C]33[/C][C]-0.089006[/C][C]-0.7552[/C][C]0.226284[/C][/ROW]
[ROW][C]34[/C][C]-0.04045[/C][C]-0.3432[/C][C]0.366212[/C][/ROW]
[ROW][C]35[/C][C]0.004947[/C][C]0.042[/C][C]0.483317[/C][/ROW]
[ROW][C]36[/C][C]0.014016[/C][C]0.1189[/C][C]0.45283[/C][/ROW]
[ROW][C]37[/C][C]-0.074858[/C][C]-0.6352[/C][C]0.263658[/C][/ROW]
[ROW][C]38[/C][C]-0.054292[/C][C]-0.4607[/C][C]0.323206[/C][/ROW]
[ROW][C]39[/C][C]-0.015721[/C][C]-0.1334[/C][C]0.447124[/C][/ROW]
[ROW][C]40[/C][C]-0.050131[/C][C]-0.4254[/C][C]0.335917[/C][/ROW]
[ROW][C]41[/C][C]0.007686[/C][C]0.0652[/C][C]0.47409[/C][/ROW]
[ROW][C]42[/C][C]0.134501[/C][C]1.1413[/C][C]0.128769[/C][/ROW]
[ROW][C]43[/C][C]-0.039536[/C][C]-0.3355[/C][C]0.369121[/C][/ROW]
[ROW][C]44[/C][C]-0.045036[/C][C]-0.3821[/C][C]0.351739[/C][/ROW]
[ROW][C]45[/C][C]-0.021267[/C][C]-0.1805[/C][C]0.428652[/C][/ROW]
[ROW][C]46[/C][C]0.006797[/C][C]0.0577[/C][C]0.477085[/C][/ROW]
[ROW][C]47[/C][C]-0.137142[/C][C]-1.1637[/C][C]0.124196[/C][/ROW]
[ROW][C]48[/C][C]0.075354[/C][C]0.6394[/C][C]0.262296[/C][/ROW]
[/TABLE]
Source: https://freestatistics.org/blog/index.php?pk=40052&T=2

Globally Unique Identifier (entire table): ba.freestatistics.org/blog/index.php?pk=40052&T=2

As an alternative you can also use a QR Code:  

The GUIDs for individual cells are displayed in the table below:

Partial Autocorrelation Function
Time lag kPACF(k)T-STATP-value
10.5602184.75365e-06
20.0484260.41090.341181
30.0222990.18920.42523
4-0.10561-0.89610.186585
5-0.242903-2.06110.021453
6-0.200815-1.7040.046349
70.1238581.0510.148393
80.3704773.14360.001212
90.1695571.43870.077279
100.1035070.87830.191355
110.0907070.76970.222004
120.435853.69830.00021
13-0.252972-2.14650.0176
14-0.159939-1.35710.08949
15-0.03782-0.32090.374603
16-0.109138-0.92610.178753
17-0.040449-0.34320.366217
180.0618370.52470.300699
190.0047090.040.484118
20-0.115062-0.97630.166083
21-0.02057-0.17450.430963
22-0.050804-0.43110.333846
23-0.05484-0.46530.321548
240.0600880.50990.305854
25-0.003923-0.03330.486767
26-0.026922-0.22840.409975
27-0.037174-0.31540.376672
280.0467460.39670.346398
290.0611830.51920.302622
30-0.080113-0.67980.249411
310.0052260.04430.482377
320.0245950.20870.417636
33-0.089006-0.75520.226284
34-0.04045-0.34320.366212
350.0049470.0420.483317
360.0140160.11890.45283
37-0.074858-0.63520.263658
38-0.054292-0.46070.323206
39-0.015721-0.13340.447124
40-0.050131-0.42540.335917
410.0076860.06520.47409
420.1345011.14130.128769
43-0.039536-0.33550.369121
44-0.045036-0.38210.351739
45-0.021267-0.18050.428652
460.0067970.05770.477085
47-0.137142-1.16370.124196
480.0753540.63940.262296


Parameters (Session):
par1 = 48 ; par2 = 1 ; par3 = 0 ; par4 = 0 ; par5 = 12 ;
Parameters (R input):
par1 = 48 ; par2 = 1 ; par3 = 0 ; par4 = 0 ; par5 = 12 ;
R code (references can be found in the software module):
if (par1 == 'Default') {
par1 = 10*log10(length(x))
} else {
par1 <- as.numeric(par1)
}
par2 <- as.numeric(par2)
par3 <- as.numeric(par3)
par4 <- as.numeric(par4)
par5 <- as.numeric(par5)
if (par2 == 0) {
x <- log(x)
} else {
x <- (x ^ par2 - 1) / par2
}
if (par3 > 0) x <- diff(x,lag=1,difference=par3)
if (par4 > 0) x <- diff(x,lag=par5,difference=par4)
bitmap(file='pic1.png')
racf <- acf(x,par1,main='Autocorrelation',xlab='lags',ylab='ACF')
dev.off()
bitmap(file='pic2.png')
rpacf <- pacf(x,par1,main='Partial Autocorrelation',xlab='lags',ylab='PACF')
dev.off()
(myacf <- c(racf$acf))
(mypacf <- c(rpacf$acf))
lengthx <- length(x)
sqrtn <- sqrt(lengthx)
load(file='createtable')
a<-table.start()
a<-table.row.start(a)
a<-table.element(a,'Autocorrelation Function',4,TRUE)
a<-table.row.end(a)
a<-table.row.start(a)
a<-table.element(a,'Time lag k',header=TRUE)
a<-table.element(a,hyperlink('basics.htm','ACF(k)','click here for more information about the Autocorrelation Function'),header=TRUE)
a<-table.element(a,'T-STAT',header=TRUE)
a<-table.element(a,'P-value',header=TRUE)
a<-table.row.end(a)
for (i in 2:(par1+1)) {
a<-table.row.start(a)
a<-table.element(a,i-1,header=TRUE)
a<-table.element(a,round(myacf[i],6))
mytstat <- myacf[i]*sqrtn
a<-table.element(a,round(mytstat,4))
a<-table.element(a,round(1-pt(abs(mytstat),lengthx),6))
a<-table.row.end(a)
}
a<-table.end(a)
table.save(a,file='mytable.tab')
a<-table.start()
a<-table.row.start(a)
a<-table.element(a,'Partial Autocorrelation Function',4,TRUE)
a<-table.row.end(a)
a<-table.row.start(a)
a<-table.element(a,'Time lag k',header=TRUE)
a<-table.element(a,hyperlink('basics.htm','PACF(k)','click here for more information about the Partial Autocorrelation Function'),header=TRUE)
a<-table.element(a,'T-STAT',header=TRUE)
a<-table.element(a,'P-value',header=TRUE)
a<-table.row.end(a)
for (i in 1:par1) {
a<-table.row.start(a)
a<-table.element(a,i,header=TRUE)
a<-table.element(a,round(mypacf[i],6))
mytstat <- mypacf[i]*sqrtn
a<-table.element(a,round(mytstat,4))
a<-table.element(a,round(1-pt(abs(mytstat),lengthx),6))
a<-table.row.end(a)
}
a<-table.end(a)
table.save(a,file='mytable1.tab')