Free Statistics

of Irreproducible Research!

Author's title

Author*Unverified author*
R Software Modulerwasp_autocorrelation.wasp
Title produced by software(Partial) Autocorrelation Function
Date of computationThu, 14 May 2009 09:51:56 -0600
Cite this page as followsStatistical Computations at FreeStatistics.org, Office for Research Development and Education, URL https://freestatistics.org/blog/index.php?v=date/2009/May/14/t1242316363l6pzhb2j7jehpx1.htm/, Retrieved Sun, 28 Apr 2024 23:12:59 +0000
Statistical Computations at FreeStatistics.org, Office for Research Development and Education, URL https://freestatistics.org/blog/index.php?pk=40023, Retrieved Sun, 28 Apr 2024 23:12:59 +0000
QR Codes:

Original text written by user:
IsPrivate?No (this computation is public)
User-defined keywords
Estimated Impact99
Family? (F = Feedback message, R = changed R code, M = changed R Module, P = changed Parameters, D = changed Data)
-       [(Partial) Autocorrelation Function] [Bis2-Partial-Goud...] [2009-05-14 15:51:56] [d41d8cd98f00b204e9800998ecf8427e] [Current]
Feedback Forum

Post a new message
Dataseries X:
9721
9897
9828
9924
10371
10846
10413
10709
10662
10570
10297
10635
10872
10296
10383
10431
10574
10653
10805
10872
10625
10407
10463
10556
10646
10702
11353
11346
11451
11964
12574
13031
13812
14544
14931
14886
16005
17064
15168
16050
15839
15137
14954
15648
15305
15579
16348
15928
16171
15937
15713
15594
15683
16438
17032
17696
17745
19394
20148
20108
18584
18441
18391
19178
18079
18483
19644
19195
19650
20830
23595
22937


Summary of computational transaction
Raw Inputview raw input (R code)
Raw Outputview raw output of R engine
Computing time1 seconds
R Server'George Udny Yule' @ 72.249.76.132

\begin{tabular}{lllllllll}
\hline
Summary of computational transaction \tabularnewline
Raw Input & view raw input (R code)  \tabularnewline
Raw Output & view raw output of R engine  \tabularnewline
Computing time & 1 seconds \tabularnewline
R Server & 'George Udny Yule' @ 72.249.76.132 \tabularnewline
\hline
\end{tabular}
%Source: https://freestatistics.org/blog/index.php?pk=40023&T=0

[TABLE]
[ROW][C]Summary of computational transaction[/C][/ROW]
[ROW][C]Raw Input[/C][C]view raw input (R code) [/C][/ROW]
[ROW][C]Raw Output[/C][C]view raw output of R engine [/C][/ROW]
[ROW][C]Computing time[/C][C]1 seconds[/C][/ROW]
[ROW][C]R Server[/C][C]'George Udny Yule' @ 72.249.76.132[/C][/ROW]
[/TABLE]
Source: https://freestatistics.org/blog/index.php?pk=40023&T=0

Globally Unique Identifier (entire table): ba.freestatistics.org/blog/index.php?pk=40023&T=0

As an alternative you can also use a QR Code:  

The GUIDs for individual cells are displayed in the table below:

Summary of computational transaction
Raw Inputview raw input (R code)
Raw Outputview raw output of R engine
Computing time1 seconds
R Server'George Udny Yule' @ 72.249.76.132


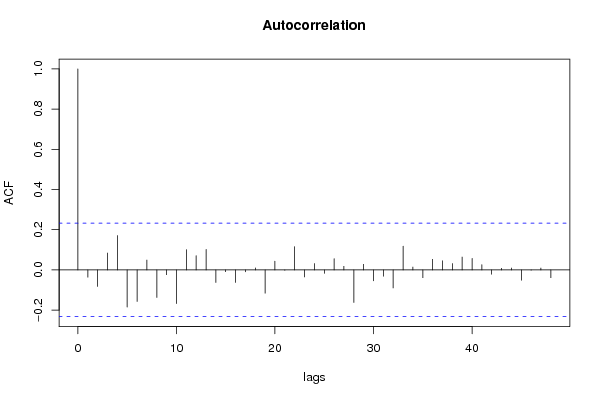
Autocorrelation Function
Time lag kACF(k)T-STATP-value
1-0.036491-0.30750.37969
2-0.082541-0.69550.244505
30.0836850.70510.241515
40.1709681.44060.077047
5-0.184927-1.55820.061813
6-0.156938-1.32240.095142
70.0488190.41140.341026
8-0.137231-1.15630.125712
9-0.023738-0.20.421017
10-0.167483-1.41120.081271
110.1007240.84870.199446
120.0708950.59740.276079
130.1018770.85840.196772
14-0.062389-0.52570.300366
15-0.008849-0.07460.470386
16-0.062559-0.52710.299873
17-0.009274-0.07810.468966
180.0099250.08360.466793
19-0.115611-0.97420.166644
200.0433990.36570.357842
21-0.00224-0.01890.492499
220.1154060.97240.167069
23-0.035015-0.2950.384411
240.0315620.26590.395525
25-0.016726-0.14090.444158
260.0558960.4710.319547
270.0181760.15320.439355
28-0.161903-1.36420.088404
290.0275840.23240.408437
30-0.054131-0.45610.324851
31-0.031348-0.26410.396218
32-0.089791-0.75660.2259
330.1178620.99310.162011
340.0140980.11880.452888
35-0.038853-0.32740.372173
360.052920.44590.328509
370.0450820.37990.352589
380.0318910.26870.394462
390.0637790.53740.296332
400.0571810.48180.315708
410.0259090.21830.413906
42-0.0215-0.18120.428378
430.0077530.06530.474049
440.0089180.07510.470154
45-0.051103-0.43060.334032
46-0.001204-0.01010.495967
470.0095170.08020.468154
48-0.038656-0.32570.372798

\begin{tabular}{lllllllll}
\hline
Autocorrelation Function \tabularnewline
Time lag k & ACF(k) & T-STAT & P-value \tabularnewline
1 & -0.036491 & -0.3075 & 0.37969 \tabularnewline
2 & -0.082541 & -0.6955 & 0.244505 \tabularnewline
3 & 0.083685 & 0.7051 & 0.241515 \tabularnewline
4 & 0.170968 & 1.4406 & 0.077047 \tabularnewline
5 & -0.184927 & -1.5582 & 0.061813 \tabularnewline
6 & -0.156938 & -1.3224 & 0.095142 \tabularnewline
7 & 0.048819 & 0.4114 & 0.341026 \tabularnewline
8 & -0.137231 & -1.1563 & 0.125712 \tabularnewline
9 & -0.023738 & -0.2 & 0.421017 \tabularnewline
10 & -0.167483 & -1.4112 & 0.081271 \tabularnewline
11 & 0.100724 & 0.8487 & 0.199446 \tabularnewline
12 & 0.070895 & 0.5974 & 0.276079 \tabularnewline
13 & 0.101877 & 0.8584 & 0.196772 \tabularnewline
14 & -0.062389 & -0.5257 & 0.300366 \tabularnewline
15 & -0.008849 & -0.0746 & 0.470386 \tabularnewline
16 & -0.062559 & -0.5271 & 0.299873 \tabularnewline
17 & -0.009274 & -0.0781 & 0.468966 \tabularnewline
18 & 0.009925 & 0.0836 & 0.466793 \tabularnewline
19 & -0.115611 & -0.9742 & 0.166644 \tabularnewline
20 & 0.043399 & 0.3657 & 0.357842 \tabularnewline
21 & -0.00224 & -0.0189 & 0.492499 \tabularnewline
22 & 0.115406 & 0.9724 & 0.167069 \tabularnewline
23 & -0.035015 & -0.295 & 0.384411 \tabularnewline
24 & 0.031562 & 0.2659 & 0.395525 \tabularnewline
25 & -0.016726 & -0.1409 & 0.444158 \tabularnewline
26 & 0.055896 & 0.471 & 0.319547 \tabularnewline
27 & 0.018176 & 0.1532 & 0.439355 \tabularnewline
28 & -0.161903 & -1.3642 & 0.088404 \tabularnewline
29 & 0.027584 & 0.2324 & 0.408437 \tabularnewline
30 & -0.054131 & -0.4561 & 0.324851 \tabularnewline
31 & -0.031348 & -0.2641 & 0.396218 \tabularnewline
32 & -0.089791 & -0.7566 & 0.2259 \tabularnewline
33 & 0.117862 & 0.9931 & 0.162011 \tabularnewline
34 & 0.014098 & 0.1188 & 0.452888 \tabularnewline
35 & -0.038853 & -0.3274 & 0.372173 \tabularnewline
36 & 0.05292 & 0.4459 & 0.328509 \tabularnewline
37 & 0.045082 & 0.3799 & 0.352589 \tabularnewline
38 & 0.031891 & 0.2687 & 0.394462 \tabularnewline
39 & 0.063779 & 0.5374 & 0.296332 \tabularnewline
40 & 0.057181 & 0.4818 & 0.315708 \tabularnewline
41 & 0.025909 & 0.2183 & 0.413906 \tabularnewline
42 & -0.0215 & -0.1812 & 0.428378 \tabularnewline
43 & 0.007753 & 0.0653 & 0.474049 \tabularnewline
44 & 0.008918 & 0.0751 & 0.470154 \tabularnewline
45 & -0.051103 & -0.4306 & 0.334032 \tabularnewline
46 & -0.001204 & -0.0101 & 0.495967 \tabularnewline
47 & 0.009517 & 0.0802 & 0.468154 \tabularnewline
48 & -0.038656 & -0.3257 & 0.372798 \tabularnewline
\hline
\end{tabular}
%Source: https://freestatistics.org/blog/index.php?pk=40023&T=1

[TABLE]
[ROW][C]Autocorrelation Function[/C][/ROW]
[ROW][C]Time lag k[/C][C]ACF(k)[/C][C]T-STAT[/C][C]P-value[/C][/ROW]
[ROW][C]1[/C][C]-0.036491[/C][C]-0.3075[/C][C]0.37969[/C][/ROW]
[ROW][C]2[/C][C]-0.082541[/C][C]-0.6955[/C][C]0.244505[/C][/ROW]
[ROW][C]3[/C][C]0.083685[/C][C]0.7051[/C][C]0.241515[/C][/ROW]
[ROW][C]4[/C][C]0.170968[/C][C]1.4406[/C][C]0.077047[/C][/ROW]
[ROW][C]5[/C][C]-0.184927[/C][C]-1.5582[/C][C]0.061813[/C][/ROW]
[ROW][C]6[/C][C]-0.156938[/C][C]-1.3224[/C][C]0.095142[/C][/ROW]
[ROW][C]7[/C][C]0.048819[/C][C]0.4114[/C][C]0.341026[/C][/ROW]
[ROW][C]8[/C][C]-0.137231[/C][C]-1.1563[/C][C]0.125712[/C][/ROW]
[ROW][C]9[/C][C]-0.023738[/C][C]-0.2[/C][C]0.421017[/C][/ROW]
[ROW][C]10[/C][C]-0.167483[/C][C]-1.4112[/C][C]0.081271[/C][/ROW]
[ROW][C]11[/C][C]0.100724[/C][C]0.8487[/C][C]0.199446[/C][/ROW]
[ROW][C]12[/C][C]0.070895[/C][C]0.5974[/C][C]0.276079[/C][/ROW]
[ROW][C]13[/C][C]0.101877[/C][C]0.8584[/C][C]0.196772[/C][/ROW]
[ROW][C]14[/C][C]-0.062389[/C][C]-0.5257[/C][C]0.300366[/C][/ROW]
[ROW][C]15[/C][C]-0.008849[/C][C]-0.0746[/C][C]0.470386[/C][/ROW]
[ROW][C]16[/C][C]-0.062559[/C][C]-0.5271[/C][C]0.299873[/C][/ROW]
[ROW][C]17[/C][C]-0.009274[/C][C]-0.0781[/C][C]0.468966[/C][/ROW]
[ROW][C]18[/C][C]0.009925[/C][C]0.0836[/C][C]0.466793[/C][/ROW]
[ROW][C]19[/C][C]-0.115611[/C][C]-0.9742[/C][C]0.166644[/C][/ROW]
[ROW][C]20[/C][C]0.043399[/C][C]0.3657[/C][C]0.357842[/C][/ROW]
[ROW][C]21[/C][C]-0.00224[/C][C]-0.0189[/C][C]0.492499[/C][/ROW]
[ROW][C]22[/C][C]0.115406[/C][C]0.9724[/C][C]0.167069[/C][/ROW]
[ROW][C]23[/C][C]-0.035015[/C][C]-0.295[/C][C]0.384411[/C][/ROW]
[ROW][C]24[/C][C]0.031562[/C][C]0.2659[/C][C]0.395525[/C][/ROW]
[ROW][C]25[/C][C]-0.016726[/C][C]-0.1409[/C][C]0.444158[/C][/ROW]
[ROW][C]26[/C][C]0.055896[/C][C]0.471[/C][C]0.319547[/C][/ROW]
[ROW][C]27[/C][C]0.018176[/C][C]0.1532[/C][C]0.439355[/C][/ROW]
[ROW][C]28[/C][C]-0.161903[/C][C]-1.3642[/C][C]0.088404[/C][/ROW]
[ROW][C]29[/C][C]0.027584[/C][C]0.2324[/C][C]0.408437[/C][/ROW]
[ROW][C]30[/C][C]-0.054131[/C][C]-0.4561[/C][C]0.324851[/C][/ROW]
[ROW][C]31[/C][C]-0.031348[/C][C]-0.2641[/C][C]0.396218[/C][/ROW]
[ROW][C]32[/C][C]-0.089791[/C][C]-0.7566[/C][C]0.2259[/C][/ROW]
[ROW][C]33[/C][C]0.117862[/C][C]0.9931[/C][C]0.162011[/C][/ROW]
[ROW][C]34[/C][C]0.014098[/C][C]0.1188[/C][C]0.452888[/C][/ROW]
[ROW][C]35[/C][C]-0.038853[/C][C]-0.3274[/C][C]0.372173[/C][/ROW]
[ROW][C]36[/C][C]0.05292[/C][C]0.4459[/C][C]0.328509[/C][/ROW]
[ROW][C]37[/C][C]0.045082[/C][C]0.3799[/C][C]0.352589[/C][/ROW]
[ROW][C]38[/C][C]0.031891[/C][C]0.2687[/C][C]0.394462[/C][/ROW]
[ROW][C]39[/C][C]0.063779[/C][C]0.5374[/C][C]0.296332[/C][/ROW]
[ROW][C]40[/C][C]0.057181[/C][C]0.4818[/C][C]0.315708[/C][/ROW]
[ROW][C]41[/C][C]0.025909[/C][C]0.2183[/C][C]0.413906[/C][/ROW]
[ROW][C]42[/C][C]-0.0215[/C][C]-0.1812[/C][C]0.428378[/C][/ROW]
[ROW][C]43[/C][C]0.007753[/C][C]0.0653[/C][C]0.474049[/C][/ROW]
[ROW][C]44[/C][C]0.008918[/C][C]0.0751[/C][C]0.470154[/C][/ROW]
[ROW][C]45[/C][C]-0.051103[/C][C]-0.4306[/C][C]0.334032[/C][/ROW]
[ROW][C]46[/C][C]-0.001204[/C][C]-0.0101[/C][C]0.495967[/C][/ROW]
[ROW][C]47[/C][C]0.009517[/C][C]0.0802[/C][C]0.468154[/C][/ROW]
[ROW][C]48[/C][C]-0.038656[/C][C]-0.3257[/C][C]0.372798[/C][/ROW]
[/TABLE]
Source: https://freestatistics.org/blog/index.php?pk=40023&T=1

Globally Unique Identifier (entire table): ba.freestatistics.org/blog/index.php?pk=40023&T=1

As an alternative you can also use a QR Code:  

The GUIDs for individual cells are displayed in the table below:

Autocorrelation Function
Time lag kACF(k)T-STATP-value
1-0.036491-0.30750.37969
2-0.082541-0.69550.244505
30.0836850.70510.241515
40.1709681.44060.077047
5-0.184927-1.55820.061813
6-0.156938-1.32240.095142
70.0488190.41140.341026
8-0.137231-1.15630.125712
9-0.023738-0.20.421017
10-0.167483-1.41120.081271
110.1007240.84870.199446
120.0708950.59740.276079
130.1018770.85840.196772
14-0.062389-0.52570.300366
15-0.008849-0.07460.470386
16-0.062559-0.52710.299873
17-0.009274-0.07810.468966
180.0099250.08360.466793
19-0.115611-0.97420.166644
200.0433990.36570.357842
21-0.00224-0.01890.492499
220.1154060.97240.167069
23-0.035015-0.2950.384411
240.0315620.26590.395525
25-0.016726-0.14090.444158
260.0558960.4710.319547
270.0181760.15320.439355
28-0.161903-1.36420.088404
290.0275840.23240.408437
30-0.054131-0.45610.324851
31-0.031348-0.26410.396218
32-0.089791-0.75660.2259
330.1178620.99310.162011
340.0140980.11880.452888
35-0.038853-0.32740.372173
360.052920.44590.328509
370.0450820.37990.352589
380.0318910.26870.394462
390.0637790.53740.296332
400.0571810.48180.315708
410.0259090.21830.413906
42-0.0215-0.18120.428378
430.0077530.06530.474049
440.0089180.07510.470154
45-0.051103-0.43060.334032
46-0.001204-0.01010.495967
470.0095170.08020.468154
48-0.038656-0.32570.372798


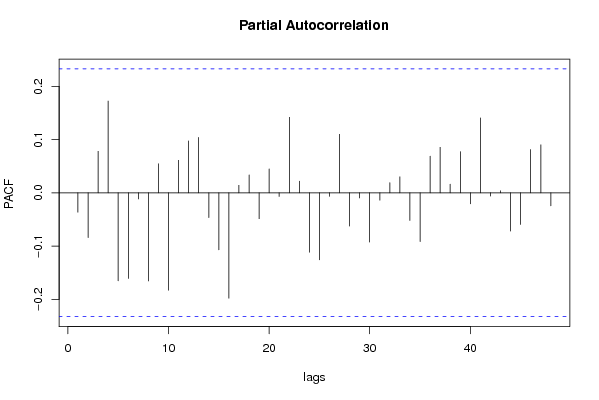
Partial Autocorrelation Function
Time lag kPACF(k)T-STATP-value
1-0.036491-0.30750.37969
2-0.083985-0.70770.240734
30.0780090.65730.256553
40.1723831.45250.075381
5-0.165412-1.39380.083865
6-0.160938-1.35610.089684
7-0.011412-0.09620.461832
8-0.165594-1.39530.083635
90.0544830.45910.32379
10-0.182852-1.54070.063913
110.0610170.51410.304375
120.0975140.82170.207008
130.1039290.87570.192068
14-0.046551-0.39220.348024
15-0.106997-0.90160.185167
16-0.198016-1.66850.049809
170.014160.11930.452682
180.0335290.28250.389183
19-0.048651-0.40990.341543
200.0448820.37820.353212
21-0.006834-0.05760.47712
220.1418341.19510.11801
230.0217370.18320.427597
24-0.111507-0.93960.17531
25-0.125784-1.05990.146397
26-0.006594-0.05560.477925
270.1098830.92590.17882
28-0.062507-0.52670.300024
29-0.009639-0.08120.467747
30-0.092431-0.77880.219333
31-0.013876-0.11690.453626
320.0190340.16040.436518
330.0300130.25290.400539
34-0.05192-0.43750.331543
35-0.091636-0.77210.221298
360.0687150.5790.28221
370.0854850.72030.236849
380.0161550.13610.446053
390.0772870.65120.258501
40-0.020611-0.17370.431308
410.1405381.18420.120143
42-0.006113-0.05150.479533
430.0036620.03090.487734
44-0.071893-0.60580.273295
45-0.059512-0.50150.308801
460.0813140.68520.247735
470.0901140.75930.225089
48-0.024438-0.20590.418721

\begin{tabular}{lllllllll}
\hline
Partial Autocorrelation Function \tabularnewline
Time lag k & PACF(k) & T-STAT & P-value \tabularnewline
1 & -0.036491 & -0.3075 & 0.37969 \tabularnewline
2 & -0.083985 & -0.7077 & 0.240734 \tabularnewline
3 & 0.078009 & 0.6573 & 0.256553 \tabularnewline
4 & 0.172383 & 1.4525 & 0.075381 \tabularnewline
5 & -0.165412 & -1.3938 & 0.083865 \tabularnewline
6 & -0.160938 & -1.3561 & 0.089684 \tabularnewline
7 & -0.011412 & -0.0962 & 0.461832 \tabularnewline
8 & -0.165594 & -1.3953 & 0.083635 \tabularnewline
9 & 0.054483 & 0.4591 & 0.32379 \tabularnewline
10 & -0.182852 & -1.5407 & 0.063913 \tabularnewline
11 & 0.061017 & 0.5141 & 0.304375 \tabularnewline
12 & 0.097514 & 0.8217 & 0.207008 \tabularnewline
13 & 0.103929 & 0.8757 & 0.192068 \tabularnewline
14 & -0.046551 & -0.3922 & 0.348024 \tabularnewline
15 & -0.106997 & -0.9016 & 0.185167 \tabularnewline
16 & -0.198016 & -1.6685 & 0.049809 \tabularnewline
17 & 0.01416 & 0.1193 & 0.452682 \tabularnewline
18 & 0.033529 & 0.2825 & 0.389183 \tabularnewline
19 & -0.048651 & -0.4099 & 0.341543 \tabularnewline
20 & 0.044882 & 0.3782 & 0.353212 \tabularnewline
21 & -0.006834 & -0.0576 & 0.47712 \tabularnewline
22 & 0.141834 & 1.1951 & 0.11801 \tabularnewline
23 & 0.021737 & 0.1832 & 0.427597 \tabularnewline
24 & -0.111507 & -0.9396 & 0.17531 \tabularnewline
25 & -0.125784 & -1.0599 & 0.146397 \tabularnewline
26 & -0.006594 & -0.0556 & 0.477925 \tabularnewline
27 & 0.109883 & 0.9259 & 0.17882 \tabularnewline
28 & -0.062507 & -0.5267 & 0.300024 \tabularnewline
29 & -0.009639 & -0.0812 & 0.467747 \tabularnewline
30 & -0.092431 & -0.7788 & 0.219333 \tabularnewline
31 & -0.013876 & -0.1169 & 0.453626 \tabularnewline
32 & 0.019034 & 0.1604 & 0.436518 \tabularnewline
33 & 0.030013 & 0.2529 & 0.400539 \tabularnewline
34 & -0.05192 & -0.4375 & 0.331543 \tabularnewline
35 & -0.091636 & -0.7721 & 0.221298 \tabularnewline
36 & 0.068715 & 0.579 & 0.28221 \tabularnewline
37 & 0.085485 & 0.7203 & 0.236849 \tabularnewline
38 & 0.016155 & 0.1361 & 0.446053 \tabularnewline
39 & 0.077287 & 0.6512 & 0.258501 \tabularnewline
40 & -0.020611 & -0.1737 & 0.431308 \tabularnewline
41 & 0.140538 & 1.1842 & 0.120143 \tabularnewline
42 & -0.006113 & -0.0515 & 0.479533 \tabularnewline
43 & 0.003662 & 0.0309 & 0.487734 \tabularnewline
44 & -0.071893 & -0.6058 & 0.273295 \tabularnewline
45 & -0.059512 & -0.5015 & 0.308801 \tabularnewline
46 & 0.081314 & 0.6852 & 0.247735 \tabularnewline
47 & 0.090114 & 0.7593 & 0.225089 \tabularnewline
48 & -0.024438 & -0.2059 & 0.418721 \tabularnewline
\hline
\end{tabular}
%Source: https://freestatistics.org/blog/index.php?pk=40023&T=2

[TABLE]
[ROW][C]Partial Autocorrelation Function[/C][/ROW]
[ROW][C]Time lag k[/C][C]PACF(k)[/C][C]T-STAT[/C][C]P-value[/C][/ROW]
[ROW][C]1[/C][C]-0.036491[/C][C]-0.3075[/C][C]0.37969[/C][/ROW]
[ROW][C]2[/C][C]-0.083985[/C][C]-0.7077[/C][C]0.240734[/C][/ROW]
[ROW][C]3[/C][C]0.078009[/C][C]0.6573[/C][C]0.256553[/C][/ROW]
[ROW][C]4[/C][C]0.172383[/C][C]1.4525[/C][C]0.075381[/C][/ROW]
[ROW][C]5[/C][C]-0.165412[/C][C]-1.3938[/C][C]0.083865[/C][/ROW]
[ROW][C]6[/C][C]-0.160938[/C][C]-1.3561[/C][C]0.089684[/C][/ROW]
[ROW][C]7[/C][C]-0.011412[/C][C]-0.0962[/C][C]0.461832[/C][/ROW]
[ROW][C]8[/C][C]-0.165594[/C][C]-1.3953[/C][C]0.083635[/C][/ROW]
[ROW][C]9[/C][C]0.054483[/C][C]0.4591[/C][C]0.32379[/C][/ROW]
[ROW][C]10[/C][C]-0.182852[/C][C]-1.5407[/C][C]0.063913[/C][/ROW]
[ROW][C]11[/C][C]0.061017[/C][C]0.5141[/C][C]0.304375[/C][/ROW]
[ROW][C]12[/C][C]0.097514[/C][C]0.8217[/C][C]0.207008[/C][/ROW]
[ROW][C]13[/C][C]0.103929[/C][C]0.8757[/C][C]0.192068[/C][/ROW]
[ROW][C]14[/C][C]-0.046551[/C][C]-0.3922[/C][C]0.348024[/C][/ROW]
[ROW][C]15[/C][C]-0.106997[/C][C]-0.9016[/C][C]0.185167[/C][/ROW]
[ROW][C]16[/C][C]-0.198016[/C][C]-1.6685[/C][C]0.049809[/C][/ROW]
[ROW][C]17[/C][C]0.01416[/C][C]0.1193[/C][C]0.452682[/C][/ROW]
[ROW][C]18[/C][C]0.033529[/C][C]0.2825[/C][C]0.389183[/C][/ROW]
[ROW][C]19[/C][C]-0.048651[/C][C]-0.4099[/C][C]0.341543[/C][/ROW]
[ROW][C]20[/C][C]0.044882[/C][C]0.3782[/C][C]0.353212[/C][/ROW]
[ROW][C]21[/C][C]-0.006834[/C][C]-0.0576[/C][C]0.47712[/C][/ROW]
[ROW][C]22[/C][C]0.141834[/C][C]1.1951[/C][C]0.11801[/C][/ROW]
[ROW][C]23[/C][C]0.021737[/C][C]0.1832[/C][C]0.427597[/C][/ROW]
[ROW][C]24[/C][C]-0.111507[/C][C]-0.9396[/C][C]0.17531[/C][/ROW]
[ROW][C]25[/C][C]-0.125784[/C][C]-1.0599[/C][C]0.146397[/C][/ROW]
[ROW][C]26[/C][C]-0.006594[/C][C]-0.0556[/C][C]0.477925[/C][/ROW]
[ROW][C]27[/C][C]0.109883[/C][C]0.9259[/C][C]0.17882[/C][/ROW]
[ROW][C]28[/C][C]-0.062507[/C][C]-0.5267[/C][C]0.300024[/C][/ROW]
[ROW][C]29[/C][C]-0.009639[/C][C]-0.0812[/C][C]0.467747[/C][/ROW]
[ROW][C]30[/C][C]-0.092431[/C][C]-0.7788[/C][C]0.219333[/C][/ROW]
[ROW][C]31[/C][C]-0.013876[/C][C]-0.1169[/C][C]0.453626[/C][/ROW]
[ROW][C]32[/C][C]0.019034[/C][C]0.1604[/C][C]0.436518[/C][/ROW]
[ROW][C]33[/C][C]0.030013[/C][C]0.2529[/C][C]0.400539[/C][/ROW]
[ROW][C]34[/C][C]-0.05192[/C][C]-0.4375[/C][C]0.331543[/C][/ROW]
[ROW][C]35[/C][C]-0.091636[/C][C]-0.7721[/C][C]0.221298[/C][/ROW]
[ROW][C]36[/C][C]0.068715[/C][C]0.579[/C][C]0.28221[/C][/ROW]
[ROW][C]37[/C][C]0.085485[/C][C]0.7203[/C][C]0.236849[/C][/ROW]
[ROW][C]38[/C][C]0.016155[/C][C]0.1361[/C][C]0.446053[/C][/ROW]
[ROW][C]39[/C][C]0.077287[/C][C]0.6512[/C][C]0.258501[/C][/ROW]
[ROW][C]40[/C][C]-0.020611[/C][C]-0.1737[/C][C]0.431308[/C][/ROW]
[ROW][C]41[/C][C]0.140538[/C][C]1.1842[/C][C]0.120143[/C][/ROW]
[ROW][C]42[/C][C]-0.006113[/C][C]-0.0515[/C][C]0.479533[/C][/ROW]
[ROW][C]43[/C][C]0.003662[/C][C]0.0309[/C][C]0.487734[/C][/ROW]
[ROW][C]44[/C][C]-0.071893[/C][C]-0.6058[/C][C]0.273295[/C][/ROW]
[ROW][C]45[/C][C]-0.059512[/C][C]-0.5015[/C][C]0.308801[/C][/ROW]
[ROW][C]46[/C][C]0.081314[/C][C]0.6852[/C][C]0.247735[/C][/ROW]
[ROW][C]47[/C][C]0.090114[/C][C]0.7593[/C][C]0.225089[/C][/ROW]
[ROW][C]48[/C][C]-0.024438[/C][C]-0.2059[/C][C]0.418721[/C][/ROW]
[/TABLE]
Source: https://freestatistics.org/blog/index.php?pk=40023&T=2

Globally Unique Identifier (entire table): ba.freestatistics.org/blog/index.php?pk=40023&T=2

As an alternative you can also use a QR Code:  

The GUIDs for individual cells are displayed in the table below:

Partial Autocorrelation Function
Time lag kPACF(k)T-STATP-value
1-0.036491-0.30750.37969
2-0.083985-0.70770.240734
30.0780090.65730.256553
40.1723831.45250.075381
5-0.165412-1.39380.083865
6-0.160938-1.35610.089684
7-0.011412-0.09620.461832
8-0.165594-1.39530.083635
90.0544830.45910.32379
10-0.182852-1.54070.063913
110.0610170.51410.304375
120.0975140.82170.207008
130.1039290.87570.192068
14-0.046551-0.39220.348024
15-0.106997-0.90160.185167
16-0.198016-1.66850.049809
170.014160.11930.452682
180.0335290.28250.389183
19-0.048651-0.40990.341543
200.0448820.37820.353212
21-0.006834-0.05760.47712
220.1418341.19510.11801
230.0217370.18320.427597
24-0.111507-0.93960.17531
25-0.125784-1.05990.146397
26-0.006594-0.05560.477925
270.1098830.92590.17882
28-0.062507-0.52670.300024
29-0.009639-0.08120.467747
30-0.092431-0.77880.219333
31-0.013876-0.11690.453626
320.0190340.16040.436518
330.0300130.25290.400539
34-0.05192-0.43750.331543
35-0.091636-0.77210.221298
360.0687150.5790.28221
370.0854850.72030.236849
380.0161550.13610.446053
390.0772870.65120.258501
40-0.020611-0.17370.431308
410.1405381.18420.120143
42-0.006113-0.05150.479533
430.0036620.03090.487734
44-0.071893-0.60580.273295
45-0.059512-0.50150.308801
460.0813140.68520.247735
470.0901140.75930.225089
48-0.024438-0.20590.418721


Parameters (Session):
par1 = 48 ; par2 = 1 ; par3 = 1 ; par4 = 0 ; par5 = 12 ;
Parameters (R input):
par1 = 48 ; par2 = 1 ; par3 = 1 ; par4 = 0 ; par5 = 12 ;
R code (references can be found in the software module):
if (par1 == 'Default') {
par1 = 10*log10(length(x))
} else {
par1 <- as.numeric(par1)
}
par2 <- as.numeric(par2)
par3 <- as.numeric(par3)
par4 <- as.numeric(par4)
par5 <- as.numeric(par5)
if (par2 == 0) {
x <- log(x)
} else {
x <- (x ^ par2 - 1) / par2
}
if (par3 > 0) x <- diff(x,lag=1,difference=par3)
if (par4 > 0) x <- diff(x,lag=par5,difference=par4)
bitmap(file='pic1.png')
racf <- acf(x,par1,main='Autocorrelation',xlab='lags',ylab='ACF')
dev.off()
bitmap(file='pic2.png')
rpacf <- pacf(x,par1,main='Partial Autocorrelation',xlab='lags',ylab='PACF')
dev.off()
(myacf <- c(racf$acf))
(mypacf <- c(rpacf$acf))
lengthx <- length(x)
sqrtn <- sqrt(lengthx)
load(file='createtable')
a<-table.start()
a<-table.row.start(a)
a<-table.element(a,'Autocorrelation Function',4,TRUE)
a<-table.row.end(a)
a<-table.row.start(a)
a<-table.element(a,'Time lag k',header=TRUE)
a<-table.element(a,hyperlink('basics.htm','ACF(k)','click here for more information about the Autocorrelation Function'),header=TRUE)
a<-table.element(a,'T-STAT',header=TRUE)
a<-table.element(a,'P-value',header=TRUE)
a<-table.row.end(a)
for (i in 2:(par1+1)) {
a<-table.row.start(a)
a<-table.element(a,i-1,header=TRUE)
a<-table.element(a,round(myacf[i],6))
mytstat <- myacf[i]*sqrtn
a<-table.element(a,round(mytstat,4))
a<-table.element(a,round(1-pt(abs(mytstat),lengthx),6))
a<-table.row.end(a)
}
a<-table.end(a)
table.save(a,file='mytable.tab')
a<-table.start()
a<-table.row.start(a)
a<-table.element(a,'Partial Autocorrelation Function',4,TRUE)
a<-table.row.end(a)
a<-table.row.start(a)
a<-table.element(a,'Time lag k',header=TRUE)
a<-table.element(a,hyperlink('basics.htm','PACF(k)','click here for more information about the Partial Autocorrelation Function'),header=TRUE)
a<-table.element(a,'T-STAT',header=TRUE)
a<-table.element(a,'P-value',header=TRUE)
a<-table.row.end(a)
for (i in 1:par1) {
a<-table.row.start(a)
a<-table.element(a,i,header=TRUE)
a<-table.element(a,round(mypacf[i],6))
mytstat <- mypacf[i]*sqrtn
a<-table.element(a,round(mytstat,4))
a<-table.element(a,round(1-pt(abs(mytstat),lengthx),6))
a<-table.row.end(a)
}
a<-table.end(a)
table.save(a,file='mytable1.tab')