Free Statistics

of Irreproducible Research!

Author's title

Author*Unverified author*
R Software Modulerwasp_autocorrelation.wasp
Title produced by software(Partial) Autocorrelation Function
Date of computationThu, 14 May 2009 07:55:41 -0600
Cite this page as followsStatistical Computations at FreeStatistics.org, Office for Research Development and Education, URL https://freestatistics.org/blog/index.php?v=date/2009/May/14/t1242309403awuydr1g6jtfqd8.htm/, Retrieved Sun, 28 Apr 2024 19:27:03 +0000
Statistical Computations at FreeStatistics.org, Office for Research Development and Education, URL https://freestatistics.org/blog/index.php?pk=40000, Retrieved Sun, 28 Apr 2024 19:27:03 +0000
QR Codes:

Original text written by user:
IsPrivate?No (this computation is public)
User-defined keywords
Estimated Impact115
Family? (F = Feedback message, R = changed R code, M = changed R Module, P = changed Parameters, D = changed Data)
-       [(Partial) Autocorrelation Function] [opgave 6 bis oef ...] [2009-05-14 13:55:41] [35929c65abb99b6a5fe7f94d9e3dcf69] [Current]
Feedback Forum

Post a new message
Dataseries X:
580
579
572
560
551
537
541
588
607
599
578
563
566
561
554
540
526
512
505
554
584
569
540
522
526
527
516
503
489
479
475
524
552
532
511
492
492
493
481
462
457
442
439
488
521
501
485
464
460
467
460
448
443
436
431
484
510
513
503
471
471
476
475
470
461
455
456
517
525
523
519
509
512
519
517
510
509
501
507
569
580
578
565
547
555
562
561
555
544
537
543
594
611
613
611
594
595
591
589
584
573
567
569
621
629
628
612
595
597
593
590
580
574
573
573
620
626
620
588
566
557
561
549
532
526
511
499
555
565
542
527
510
514
517
508
493
490
469
478
528
534
518
506
502
516


Summary of computational transaction
Raw Inputview raw input (R code)
Raw Outputview raw output of R engine
Computing time1 seconds
R Server'Gwilym Jenkins' @ 72.249.127.135

\begin{tabular}{lllllllll}
\hline
Summary of computational transaction \tabularnewline
Raw Input & view raw input (R code)  \tabularnewline
Raw Output & view raw output of R engine  \tabularnewline
Computing time & 1 seconds \tabularnewline
R Server & 'Gwilym Jenkins' @ 72.249.127.135 \tabularnewline
\hline
\end{tabular}
%Source: https://freestatistics.org/blog/index.php?pk=40000&T=0

[TABLE]
[ROW][C]Summary of computational transaction[/C][/ROW]
[ROW][C]Raw Input[/C][C]view raw input (R code) [/C][/ROW]
[ROW][C]Raw Output[/C][C]view raw output of R engine [/C][/ROW]
[ROW][C]Computing time[/C][C]1 seconds[/C][/ROW]
[ROW][C]R Server[/C][C]'Gwilym Jenkins' @ 72.249.127.135[/C][/ROW]
[/TABLE]
Source: https://freestatistics.org/blog/index.php?pk=40000&T=0

Globally Unique Identifier (entire table): ba.freestatistics.org/blog/index.php?pk=40000&T=0

As an alternative you can also use a QR Code:  

The GUIDs for individual cells are displayed in the table below:

Summary of computational transaction
Raw Inputview raw input (R code)
Raw Outputview raw output of R engine
Computing time1 seconds
R Server'Gwilym Jenkins' @ 72.249.127.135


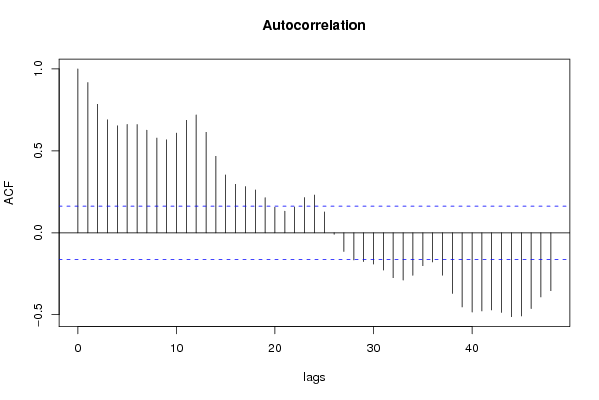
Autocorrelation Function
Time lag kACF(k)T-STATP-value
10.91663511.03770
20.783959.440
30.6896558.30450
40.6531397.86480
50.6612487.96250
60.6604957.95340
70.6264947.5440
80.5779326.95920
90.567436.83280
100.6083347.32530
110.6868548.27080
120.7192368.66080
130.6135037.38760
140.4666345.6190
150.3534694.25631.9e-05
160.295623.55970.000251
170.2822623.39890.000437
180.26143.14770.000999
190.2140292.57730.005478
200.1552941.870.031751
210.1318051.58710.05733
220.15681.88810.030504
230.2147132.58550.005355
240.230262.77270.003145
250.1275081.53540.063432
26-0.00936-0.11270.455208
27-0.113779-1.37010.086389
28-0.16588-1.99750.023823
29-0.175775-2.11660.018
30-0.190626-2.29540.011571
31-0.227163-2.73540.003504
32-0.274021-3.29960.000609
33-0.28865-3.47580.000336
34-0.259502-3.12480.001075
35-0.200607-2.41560.008476
36-0.177733-2.14020.017006
37-0.258847-3.11690.001102
38-0.369829-4.45338e-06
39-0.452345-5.4470
40-0.483744-5.8250
41-0.476653-5.73970
42-0.471215-5.67420
43-0.486343-5.85630
44-0.511867-6.16370
45-0.507328-6.1090
46-0.462259-5.56630
47-0.391894-4.7193e-06
48-0.353531-4.25711.9e-05

\begin{tabular}{lllllllll}
\hline
Autocorrelation Function \tabularnewline
Time lag k & ACF(k) & T-STAT & P-value \tabularnewline
1 & 0.916635 & 11.0377 & 0 \tabularnewline
2 & 0.78395 & 9.44 & 0 \tabularnewline
3 & 0.689655 & 8.3045 & 0 \tabularnewline
4 & 0.653139 & 7.8648 & 0 \tabularnewline
5 & 0.661248 & 7.9625 & 0 \tabularnewline
6 & 0.660495 & 7.9534 & 0 \tabularnewline
7 & 0.626494 & 7.544 & 0 \tabularnewline
8 & 0.577932 & 6.9592 & 0 \tabularnewline
9 & 0.56743 & 6.8328 & 0 \tabularnewline
10 & 0.608334 & 7.3253 & 0 \tabularnewline
11 & 0.686854 & 8.2708 & 0 \tabularnewline
12 & 0.719236 & 8.6608 & 0 \tabularnewline
13 & 0.613503 & 7.3876 & 0 \tabularnewline
14 & 0.466634 & 5.619 & 0 \tabularnewline
15 & 0.353469 & 4.2563 & 1.9e-05 \tabularnewline
16 & 0.29562 & 3.5597 & 0.000251 \tabularnewline
17 & 0.282262 & 3.3989 & 0.000437 \tabularnewline
18 & 0.2614 & 3.1477 & 0.000999 \tabularnewline
19 & 0.214029 & 2.5773 & 0.005478 \tabularnewline
20 & 0.155294 & 1.87 & 0.031751 \tabularnewline
21 & 0.131805 & 1.5871 & 0.05733 \tabularnewline
22 & 0.1568 & 1.8881 & 0.030504 \tabularnewline
23 & 0.214713 & 2.5855 & 0.005355 \tabularnewline
24 & 0.23026 & 2.7727 & 0.003145 \tabularnewline
25 & 0.127508 & 1.5354 & 0.063432 \tabularnewline
26 & -0.00936 & -0.1127 & 0.455208 \tabularnewline
27 & -0.113779 & -1.3701 & 0.086389 \tabularnewline
28 & -0.16588 & -1.9975 & 0.023823 \tabularnewline
29 & -0.175775 & -2.1166 & 0.018 \tabularnewline
30 & -0.190626 & -2.2954 & 0.011571 \tabularnewline
31 & -0.227163 & -2.7354 & 0.003504 \tabularnewline
32 & -0.274021 & -3.2996 & 0.000609 \tabularnewline
33 & -0.28865 & -3.4758 & 0.000336 \tabularnewline
34 & -0.259502 & -3.1248 & 0.001075 \tabularnewline
35 & -0.200607 & -2.4156 & 0.008476 \tabularnewline
36 & -0.177733 & -2.1402 & 0.017006 \tabularnewline
37 & -0.258847 & -3.1169 & 0.001102 \tabularnewline
38 & -0.369829 & -4.4533 & 8e-06 \tabularnewline
39 & -0.452345 & -5.447 & 0 \tabularnewline
40 & -0.483744 & -5.825 & 0 \tabularnewline
41 & -0.476653 & -5.7397 & 0 \tabularnewline
42 & -0.471215 & -5.6742 & 0 \tabularnewline
43 & -0.486343 & -5.8563 & 0 \tabularnewline
44 & -0.511867 & -6.1637 & 0 \tabularnewline
45 & -0.507328 & -6.109 & 0 \tabularnewline
46 & -0.462259 & -5.5663 & 0 \tabularnewline
47 & -0.391894 & -4.719 & 3e-06 \tabularnewline
48 & -0.353531 & -4.2571 & 1.9e-05 \tabularnewline
\hline
\end{tabular}
%Source: https://freestatistics.org/blog/index.php?pk=40000&T=1

[TABLE]
[ROW][C]Autocorrelation Function[/C][/ROW]
[ROW][C]Time lag k[/C][C]ACF(k)[/C][C]T-STAT[/C][C]P-value[/C][/ROW]
[ROW][C]1[/C][C]0.916635[/C][C]11.0377[/C][C]0[/C][/ROW]
[ROW][C]2[/C][C]0.78395[/C][C]9.44[/C][C]0[/C][/ROW]
[ROW][C]3[/C][C]0.689655[/C][C]8.3045[/C][C]0[/C][/ROW]
[ROW][C]4[/C][C]0.653139[/C][C]7.8648[/C][C]0[/C][/ROW]
[ROW][C]5[/C][C]0.661248[/C][C]7.9625[/C][C]0[/C][/ROW]
[ROW][C]6[/C][C]0.660495[/C][C]7.9534[/C][C]0[/C][/ROW]
[ROW][C]7[/C][C]0.626494[/C][C]7.544[/C][C]0[/C][/ROW]
[ROW][C]8[/C][C]0.577932[/C][C]6.9592[/C][C]0[/C][/ROW]
[ROW][C]9[/C][C]0.56743[/C][C]6.8328[/C][C]0[/C][/ROW]
[ROW][C]10[/C][C]0.608334[/C][C]7.3253[/C][C]0[/C][/ROW]
[ROW][C]11[/C][C]0.686854[/C][C]8.2708[/C][C]0[/C][/ROW]
[ROW][C]12[/C][C]0.719236[/C][C]8.6608[/C][C]0[/C][/ROW]
[ROW][C]13[/C][C]0.613503[/C][C]7.3876[/C][C]0[/C][/ROW]
[ROW][C]14[/C][C]0.466634[/C][C]5.619[/C][C]0[/C][/ROW]
[ROW][C]15[/C][C]0.353469[/C][C]4.2563[/C][C]1.9e-05[/C][/ROW]
[ROW][C]16[/C][C]0.29562[/C][C]3.5597[/C][C]0.000251[/C][/ROW]
[ROW][C]17[/C][C]0.282262[/C][C]3.3989[/C][C]0.000437[/C][/ROW]
[ROW][C]18[/C][C]0.2614[/C][C]3.1477[/C][C]0.000999[/C][/ROW]
[ROW][C]19[/C][C]0.214029[/C][C]2.5773[/C][C]0.005478[/C][/ROW]
[ROW][C]20[/C][C]0.155294[/C][C]1.87[/C][C]0.031751[/C][/ROW]
[ROW][C]21[/C][C]0.131805[/C][C]1.5871[/C][C]0.05733[/C][/ROW]
[ROW][C]22[/C][C]0.1568[/C][C]1.8881[/C][C]0.030504[/C][/ROW]
[ROW][C]23[/C][C]0.214713[/C][C]2.5855[/C][C]0.005355[/C][/ROW]
[ROW][C]24[/C][C]0.23026[/C][C]2.7727[/C][C]0.003145[/C][/ROW]
[ROW][C]25[/C][C]0.127508[/C][C]1.5354[/C][C]0.063432[/C][/ROW]
[ROW][C]26[/C][C]-0.00936[/C][C]-0.1127[/C][C]0.455208[/C][/ROW]
[ROW][C]27[/C][C]-0.113779[/C][C]-1.3701[/C][C]0.086389[/C][/ROW]
[ROW][C]28[/C][C]-0.16588[/C][C]-1.9975[/C][C]0.023823[/C][/ROW]
[ROW][C]29[/C][C]-0.175775[/C][C]-2.1166[/C][C]0.018[/C][/ROW]
[ROW][C]30[/C][C]-0.190626[/C][C]-2.2954[/C][C]0.011571[/C][/ROW]
[ROW][C]31[/C][C]-0.227163[/C][C]-2.7354[/C][C]0.003504[/C][/ROW]
[ROW][C]32[/C][C]-0.274021[/C][C]-3.2996[/C][C]0.000609[/C][/ROW]
[ROW][C]33[/C][C]-0.28865[/C][C]-3.4758[/C][C]0.000336[/C][/ROW]
[ROW][C]34[/C][C]-0.259502[/C][C]-3.1248[/C][C]0.001075[/C][/ROW]
[ROW][C]35[/C][C]-0.200607[/C][C]-2.4156[/C][C]0.008476[/C][/ROW]
[ROW][C]36[/C][C]-0.177733[/C][C]-2.1402[/C][C]0.017006[/C][/ROW]
[ROW][C]37[/C][C]-0.258847[/C][C]-3.1169[/C][C]0.001102[/C][/ROW]
[ROW][C]38[/C][C]-0.369829[/C][C]-4.4533[/C][C]8e-06[/C][/ROW]
[ROW][C]39[/C][C]-0.452345[/C][C]-5.447[/C][C]0[/C][/ROW]
[ROW][C]40[/C][C]-0.483744[/C][C]-5.825[/C][C]0[/C][/ROW]
[ROW][C]41[/C][C]-0.476653[/C][C]-5.7397[/C][C]0[/C][/ROW]
[ROW][C]42[/C][C]-0.471215[/C][C]-5.6742[/C][C]0[/C][/ROW]
[ROW][C]43[/C][C]-0.486343[/C][C]-5.8563[/C][C]0[/C][/ROW]
[ROW][C]44[/C][C]-0.511867[/C][C]-6.1637[/C][C]0[/C][/ROW]
[ROW][C]45[/C][C]-0.507328[/C][C]-6.109[/C][C]0[/C][/ROW]
[ROW][C]46[/C][C]-0.462259[/C][C]-5.5663[/C][C]0[/C][/ROW]
[ROW][C]47[/C][C]-0.391894[/C][C]-4.719[/C][C]3e-06[/C][/ROW]
[ROW][C]48[/C][C]-0.353531[/C][C]-4.2571[/C][C]1.9e-05[/C][/ROW]
[/TABLE]
Source: https://freestatistics.org/blog/index.php?pk=40000&T=1

Globally Unique Identifier (entire table): ba.freestatistics.org/blog/index.php?pk=40000&T=1

As an alternative you can also use a QR Code:  

The GUIDs for individual cells are displayed in the table below:

Autocorrelation Function
Time lag kACF(k)T-STATP-value
10.91663511.03770
20.783959.440
30.6896558.30450
40.6531397.86480
50.6612487.96250
60.6604957.95340
70.6264947.5440
80.5779326.95920
90.567436.83280
100.6083347.32530
110.6868548.27080
120.7192368.66080
130.6135037.38760
140.4666345.6190
150.3534694.25631.9e-05
160.295623.55970.000251
170.2822623.39890.000437
180.26143.14770.000999
190.2140292.57730.005478
200.1552941.870.031751
210.1318051.58710.05733
220.15681.88810.030504
230.2147132.58550.005355
240.230262.77270.003145
250.1275081.53540.063432
26-0.00936-0.11270.455208
27-0.113779-1.37010.086389
28-0.16588-1.99750.023823
29-0.175775-2.11660.018
30-0.190626-2.29540.011571
31-0.227163-2.73540.003504
32-0.274021-3.29960.000609
33-0.28865-3.47580.000336
34-0.259502-3.12480.001075
35-0.200607-2.41560.008476
36-0.177733-2.14020.017006
37-0.258847-3.11690.001102
38-0.369829-4.45338e-06
39-0.452345-5.4470
40-0.483744-5.8250
41-0.476653-5.73970
42-0.471215-5.67420
43-0.486343-5.85630
44-0.511867-6.16370
45-0.507328-6.1090
46-0.462259-5.56630
47-0.391894-4.7193e-06
48-0.353531-4.25711.9e-05


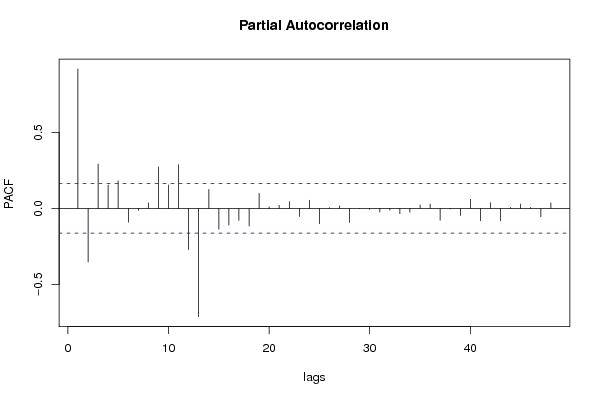
Partial Autocorrelation Function
Time lag kPACF(k)T-STATP-value
10.91663511.03770
2-0.352166-4.24062e-05
30.2915093.51020.000298
40.1536161.84980.033191
50.1812782.18290.015327
6-0.090977-1.09550.137555
7-0.011687-0.14070.444137
80.0353960.42620.335287
90.2722233.2780.000654
100.1537771.85170.03305
110.2869383.45520.000361
12-0.270425-3.25630.000703
13-0.711798-8.57120
140.1247581.50230.0676
15-0.137507-1.65580.049962
16-0.109784-1.3220.094129
17-0.079362-0.95560.17042
18-0.115186-1.3870.083782
190.0983861.18470.119033
200.0099810.12020.452252
210.0198170.23860.405863
220.0444740.53550.29655
23-0.054067-0.65110.25802
240.0539080.64910.258636
25-0.100554-1.21080.113965
260.0049270.05930.476388
270.016480.19840.421487
28-0.092528-1.11420.133523
29-0.000775-0.00930.496284
30-0.007328-0.08820.464905
31-0.024014-0.28920.386431
32-0.011115-0.13380.446858
33-0.034789-0.41890.337951
34-0.024801-0.29860.382819
350.0221990.26730.394804
360.0284040.3420.366413
37-0.077436-0.93250.176325
38-0.00455-0.05480.478189
39-0.047351-0.57020.284717
400.0592790.71380.238243
41-0.080773-0.97260.166176
420.0375080.45170.326098
43-0.081821-0.98530.163069
440.0062060.07470.470266
450.0280430.33770.368043
460.0064120.07720.469283
47-0.055146-0.66410.253856
480.0361260.4350.332101

\begin{tabular}{lllllllll}
\hline
Partial Autocorrelation Function \tabularnewline
Time lag k & PACF(k) & T-STAT & P-value \tabularnewline
1 & 0.916635 & 11.0377 & 0 \tabularnewline
2 & -0.352166 & -4.2406 & 2e-05 \tabularnewline
3 & 0.291509 & 3.5102 & 0.000298 \tabularnewline
4 & 0.153616 & 1.8498 & 0.033191 \tabularnewline
5 & 0.181278 & 2.1829 & 0.015327 \tabularnewline
6 & -0.090977 & -1.0955 & 0.137555 \tabularnewline
7 & -0.011687 & -0.1407 & 0.444137 \tabularnewline
8 & 0.035396 & 0.4262 & 0.335287 \tabularnewline
9 & 0.272223 & 3.278 & 0.000654 \tabularnewline
10 & 0.153777 & 1.8517 & 0.03305 \tabularnewline
11 & 0.286938 & 3.4552 & 0.000361 \tabularnewline
12 & -0.270425 & -3.2563 & 0.000703 \tabularnewline
13 & -0.711798 & -8.5712 & 0 \tabularnewline
14 & 0.124758 & 1.5023 & 0.0676 \tabularnewline
15 & -0.137507 & -1.6558 & 0.049962 \tabularnewline
16 & -0.109784 & -1.322 & 0.094129 \tabularnewline
17 & -0.079362 & -0.9556 & 0.17042 \tabularnewline
18 & -0.115186 & -1.387 & 0.083782 \tabularnewline
19 & 0.098386 & 1.1847 & 0.119033 \tabularnewline
20 & 0.009981 & 0.1202 & 0.452252 \tabularnewline
21 & 0.019817 & 0.2386 & 0.405863 \tabularnewline
22 & 0.044474 & 0.5355 & 0.29655 \tabularnewline
23 & -0.054067 & -0.6511 & 0.25802 \tabularnewline
24 & 0.053908 & 0.6491 & 0.258636 \tabularnewline
25 & -0.100554 & -1.2108 & 0.113965 \tabularnewline
26 & 0.004927 & 0.0593 & 0.476388 \tabularnewline
27 & 0.01648 & 0.1984 & 0.421487 \tabularnewline
28 & -0.092528 & -1.1142 & 0.133523 \tabularnewline
29 & -0.000775 & -0.0093 & 0.496284 \tabularnewline
30 & -0.007328 & -0.0882 & 0.464905 \tabularnewline
31 & -0.024014 & -0.2892 & 0.386431 \tabularnewline
32 & -0.011115 & -0.1338 & 0.446858 \tabularnewline
33 & -0.034789 & -0.4189 & 0.337951 \tabularnewline
34 & -0.024801 & -0.2986 & 0.382819 \tabularnewline
35 & 0.022199 & 0.2673 & 0.394804 \tabularnewline
36 & 0.028404 & 0.342 & 0.366413 \tabularnewline
37 & -0.077436 & -0.9325 & 0.176325 \tabularnewline
38 & -0.00455 & -0.0548 & 0.478189 \tabularnewline
39 & -0.047351 & -0.5702 & 0.284717 \tabularnewline
40 & 0.059279 & 0.7138 & 0.238243 \tabularnewline
41 & -0.080773 & -0.9726 & 0.166176 \tabularnewline
42 & 0.037508 & 0.4517 & 0.326098 \tabularnewline
43 & -0.081821 & -0.9853 & 0.163069 \tabularnewline
44 & 0.006206 & 0.0747 & 0.470266 \tabularnewline
45 & 0.028043 & 0.3377 & 0.368043 \tabularnewline
46 & 0.006412 & 0.0772 & 0.469283 \tabularnewline
47 & -0.055146 & -0.6641 & 0.253856 \tabularnewline
48 & 0.036126 & 0.435 & 0.332101 \tabularnewline
\hline
\end{tabular}
%Source: https://freestatistics.org/blog/index.php?pk=40000&T=2

[TABLE]
[ROW][C]Partial Autocorrelation Function[/C][/ROW]
[ROW][C]Time lag k[/C][C]PACF(k)[/C][C]T-STAT[/C][C]P-value[/C][/ROW]
[ROW][C]1[/C][C]0.916635[/C][C]11.0377[/C][C]0[/C][/ROW]
[ROW][C]2[/C][C]-0.352166[/C][C]-4.2406[/C][C]2e-05[/C][/ROW]
[ROW][C]3[/C][C]0.291509[/C][C]3.5102[/C][C]0.000298[/C][/ROW]
[ROW][C]4[/C][C]0.153616[/C][C]1.8498[/C][C]0.033191[/C][/ROW]
[ROW][C]5[/C][C]0.181278[/C][C]2.1829[/C][C]0.015327[/C][/ROW]
[ROW][C]6[/C][C]-0.090977[/C][C]-1.0955[/C][C]0.137555[/C][/ROW]
[ROW][C]7[/C][C]-0.011687[/C][C]-0.1407[/C][C]0.444137[/C][/ROW]
[ROW][C]8[/C][C]0.035396[/C][C]0.4262[/C][C]0.335287[/C][/ROW]
[ROW][C]9[/C][C]0.272223[/C][C]3.278[/C][C]0.000654[/C][/ROW]
[ROW][C]10[/C][C]0.153777[/C][C]1.8517[/C][C]0.03305[/C][/ROW]
[ROW][C]11[/C][C]0.286938[/C][C]3.4552[/C][C]0.000361[/C][/ROW]
[ROW][C]12[/C][C]-0.270425[/C][C]-3.2563[/C][C]0.000703[/C][/ROW]
[ROW][C]13[/C][C]-0.711798[/C][C]-8.5712[/C][C]0[/C][/ROW]
[ROW][C]14[/C][C]0.124758[/C][C]1.5023[/C][C]0.0676[/C][/ROW]
[ROW][C]15[/C][C]-0.137507[/C][C]-1.6558[/C][C]0.049962[/C][/ROW]
[ROW][C]16[/C][C]-0.109784[/C][C]-1.322[/C][C]0.094129[/C][/ROW]
[ROW][C]17[/C][C]-0.079362[/C][C]-0.9556[/C][C]0.17042[/C][/ROW]
[ROW][C]18[/C][C]-0.115186[/C][C]-1.387[/C][C]0.083782[/C][/ROW]
[ROW][C]19[/C][C]0.098386[/C][C]1.1847[/C][C]0.119033[/C][/ROW]
[ROW][C]20[/C][C]0.009981[/C][C]0.1202[/C][C]0.452252[/C][/ROW]
[ROW][C]21[/C][C]0.019817[/C][C]0.2386[/C][C]0.405863[/C][/ROW]
[ROW][C]22[/C][C]0.044474[/C][C]0.5355[/C][C]0.29655[/C][/ROW]
[ROW][C]23[/C][C]-0.054067[/C][C]-0.6511[/C][C]0.25802[/C][/ROW]
[ROW][C]24[/C][C]0.053908[/C][C]0.6491[/C][C]0.258636[/C][/ROW]
[ROW][C]25[/C][C]-0.100554[/C][C]-1.2108[/C][C]0.113965[/C][/ROW]
[ROW][C]26[/C][C]0.004927[/C][C]0.0593[/C][C]0.476388[/C][/ROW]
[ROW][C]27[/C][C]0.01648[/C][C]0.1984[/C][C]0.421487[/C][/ROW]
[ROW][C]28[/C][C]-0.092528[/C][C]-1.1142[/C][C]0.133523[/C][/ROW]
[ROW][C]29[/C][C]-0.000775[/C][C]-0.0093[/C][C]0.496284[/C][/ROW]
[ROW][C]30[/C][C]-0.007328[/C][C]-0.0882[/C][C]0.464905[/C][/ROW]
[ROW][C]31[/C][C]-0.024014[/C][C]-0.2892[/C][C]0.386431[/C][/ROW]
[ROW][C]32[/C][C]-0.011115[/C][C]-0.1338[/C][C]0.446858[/C][/ROW]
[ROW][C]33[/C][C]-0.034789[/C][C]-0.4189[/C][C]0.337951[/C][/ROW]
[ROW][C]34[/C][C]-0.024801[/C][C]-0.2986[/C][C]0.382819[/C][/ROW]
[ROW][C]35[/C][C]0.022199[/C][C]0.2673[/C][C]0.394804[/C][/ROW]
[ROW][C]36[/C][C]0.028404[/C][C]0.342[/C][C]0.366413[/C][/ROW]
[ROW][C]37[/C][C]-0.077436[/C][C]-0.9325[/C][C]0.176325[/C][/ROW]
[ROW][C]38[/C][C]-0.00455[/C][C]-0.0548[/C][C]0.478189[/C][/ROW]
[ROW][C]39[/C][C]-0.047351[/C][C]-0.5702[/C][C]0.284717[/C][/ROW]
[ROW][C]40[/C][C]0.059279[/C][C]0.7138[/C][C]0.238243[/C][/ROW]
[ROW][C]41[/C][C]-0.080773[/C][C]-0.9726[/C][C]0.166176[/C][/ROW]
[ROW][C]42[/C][C]0.037508[/C][C]0.4517[/C][C]0.326098[/C][/ROW]
[ROW][C]43[/C][C]-0.081821[/C][C]-0.9853[/C][C]0.163069[/C][/ROW]
[ROW][C]44[/C][C]0.006206[/C][C]0.0747[/C][C]0.470266[/C][/ROW]
[ROW][C]45[/C][C]0.028043[/C][C]0.3377[/C][C]0.368043[/C][/ROW]
[ROW][C]46[/C][C]0.006412[/C][C]0.0772[/C][C]0.469283[/C][/ROW]
[ROW][C]47[/C][C]-0.055146[/C][C]-0.6641[/C][C]0.253856[/C][/ROW]
[ROW][C]48[/C][C]0.036126[/C][C]0.435[/C][C]0.332101[/C][/ROW]
[/TABLE]
Source: https://freestatistics.org/blog/index.php?pk=40000&T=2

Globally Unique Identifier (entire table): ba.freestatistics.org/blog/index.php?pk=40000&T=2

As an alternative you can also use a QR Code:  

The GUIDs for individual cells are displayed in the table below:

Partial Autocorrelation Function
Time lag kPACF(k)T-STATP-value
10.91663511.03770
2-0.352166-4.24062e-05
30.2915093.51020.000298
40.1536161.84980.033191
50.1812782.18290.015327
6-0.090977-1.09550.137555
7-0.011687-0.14070.444137
80.0353960.42620.335287
90.2722233.2780.000654
100.1537771.85170.03305
110.2869383.45520.000361
12-0.270425-3.25630.000703
13-0.711798-8.57120
140.1247581.50230.0676
15-0.137507-1.65580.049962
16-0.109784-1.3220.094129
17-0.079362-0.95560.17042
18-0.115186-1.3870.083782
190.0983861.18470.119033
200.0099810.12020.452252
210.0198170.23860.405863
220.0444740.53550.29655
23-0.054067-0.65110.25802
240.0539080.64910.258636
25-0.100554-1.21080.113965
260.0049270.05930.476388
270.016480.19840.421487
28-0.092528-1.11420.133523
29-0.000775-0.00930.496284
30-0.007328-0.08820.464905
31-0.024014-0.28920.386431
32-0.011115-0.13380.446858
33-0.034789-0.41890.337951
34-0.024801-0.29860.382819
350.0221990.26730.394804
360.0284040.3420.366413
37-0.077436-0.93250.176325
38-0.00455-0.05480.478189
39-0.047351-0.57020.284717
400.0592790.71380.238243
41-0.080773-0.97260.166176
420.0375080.45170.326098
43-0.081821-0.98530.163069
440.0062060.07470.470266
450.0280430.33770.368043
460.0064120.07720.469283
47-0.055146-0.66410.253856
480.0361260.4350.332101


Parameters (Session):
par1 = 48 ; par2 = 1 ; par3 = 0 ; par4 = 0 ; par5 = 12 ;
Parameters (R input):
par1 = 48 ; par2 = 1 ; par3 = 0 ; par4 = 0 ; par5 = 12 ;
R code (references can be found in the software module):
if (par1 == 'Default') {
par1 = 10*log10(length(x))
} else {
par1 <- as.numeric(par1)
}
par2 <- as.numeric(par2)
par3 <- as.numeric(par3)
par4 <- as.numeric(par4)
par5 <- as.numeric(par5)
if (par2 == 0) {
x <- log(x)
} else {
x <- (x ^ par2 - 1) / par2
}
if (par3 > 0) x <- diff(x,lag=1,difference=par3)
if (par4 > 0) x <- diff(x,lag=par5,difference=par4)
bitmap(file='pic1.png')
racf <- acf(x,par1,main='Autocorrelation',xlab='lags',ylab='ACF')
dev.off()
bitmap(file='pic2.png')
rpacf <- pacf(x,par1,main='Partial Autocorrelation',xlab='lags',ylab='PACF')
dev.off()
(myacf <- c(racf$acf))
(mypacf <- c(rpacf$acf))
lengthx <- length(x)
sqrtn <- sqrt(lengthx)
load(file='createtable')
a<-table.start()
a<-table.row.start(a)
a<-table.element(a,'Autocorrelation Function',4,TRUE)
a<-table.row.end(a)
a<-table.row.start(a)
a<-table.element(a,'Time lag k',header=TRUE)
a<-table.element(a,hyperlink('basics.htm','ACF(k)','click here for more information about the Autocorrelation Function'),header=TRUE)
a<-table.element(a,'T-STAT',header=TRUE)
a<-table.element(a,'P-value',header=TRUE)
a<-table.row.end(a)
for (i in 2:(par1+1)) {
a<-table.row.start(a)
a<-table.element(a,i-1,header=TRUE)
a<-table.element(a,round(myacf[i],6))
mytstat <- myacf[i]*sqrtn
a<-table.element(a,round(mytstat,4))
a<-table.element(a,round(1-pt(abs(mytstat),lengthx),6))
a<-table.row.end(a)
}
a<-table.end(a)
table.save(a,file='mytable.tab')
a<-table.start()
a<-table.row.start(a)
a<-table.element(a,'Partial Autocorrelation Function',4,TRUE)
a<-table.row.end(a)
a<-table.row.start(a)
a<-table.element(a,'Time lag k',header=TRUE)
a<-table.element(a,hyperlink('basics.htm','PACF(k)','click here for more information about the Partial Autocorrelation Function'),header=TRUE)
a<-table.element(a,'T-STAT',header=TRUE)
a<-table.element(a,'P-value',header=TRUE)
a<-table.row.end(a)
for (i in 1:par1) {
a<-table.row.start(a)
a<-table.element(a,i,header=TRUE)
a<-table.element(a,round(mypacf[i],6))
mytstat <- mypacf[i]*sqrtn
a<-table.element(a,round(mytstat,4))
a<-table.element(a,round(1-pt(abs(mytstat),lengthx),6))
a<-table.row.end(a)
}
a<-table.end(a)
table.save(a,file='mytable1.tab')