Free Statistics

of Irreproducible Research!

Author's title

Author*Unverified author*
R Software Modulerwasp_autocorrelation.wasp
Title produced by software(Partial) Autocorrelation Function
Date of computationThu, 14 May 2009 03:55:24 -0600
Cite this page as followsStatistical Computations at FreeStatistics.org, Office for Research Development and Education, URL https://freestatistics.org/blog/index.php?v=date/2009/May/14/t1242294964pcmcd533yncq0a6.htm/, Retrieved Mon, 29 Apr 2024 03:29:27 +0000
Statistical Computations at FreeStatistics.org, Office for Research Development and Education, URL https://freestatistics.org/blog/index.php?pk=39962, Retrieved Mon, 29 Apr 2024 03:29:27 +0000
QR Codes:

Original text written by user:
IsPrivate?No (this computation is public)
User-defined keywords
Estimated Impact166
Family? (F = Feedback message, R = changed R code, M = changed R Module, P = changed Parameters, D = changed Data)
-       [(Partial) Autocorrelation Function] [Opgave 6bis: gedi...] [2009-05-14 09:55:24] [32d3db078a25d9ceaa1d8e026862f0e2] [Current]
Feedback Forum

Post a new message
Dataseries X:
2194
2419
2742
2137
2710
2173
2363
2126
1905
2121
1983
1734
2074
2049
2406
2558
2251
2059
2397
1747
1707
2319
1631
1627
1791
2034
1997
2169
2028
2253
2218
1855
2187
1852
1570
1851
1954
1828
2251
2277
2085
2282
2266
1878
2267
2069
1746
2299
2360
2214
2825
2355
2333
3016
2155
2172
2150
2533
2058
2160
2260
2498
2695
2799
2945
2930
2318
2540
2570
2669
2450
2842
3440
2678
2981
2259
2844
2546
2456
2295
2379
2479
2057
2280
2351
2275
2543
2305
2188
2720
2398
2147
1898
2538
2081
2057
2497
2460
2195
2823
2100
2640
2342
2171
2482


Summary of computational transaction
Raw Inputview raw input (R code)
Raw Outputview raw output of R engine
Computing time1 seconds
R Server'George Udny Yule' @ 72.249.76.132

\begin{tabular}{lllllllll}
\hline
Summary of computational transaction \tabularnewline
Raw Input & view raw input (R code)  \tabularnewline
Raw Output & view raw output of R engine  \tabularnewline
Computing time & 1 seconds \tabularnewline
R Server & 'George Udny Yule' @ 72.249.76.132 \tabularnewline
\hline
\end{tabular}
%Source: https://freestatistics.org/blog/index.php?pk=39962&T=0

[TABLE]
[ROW][C]Summary of computational transaction[/C][/ROW]
[ROW][C]Raw Input[/C][C]view raw input (R code) [/C][/ROW]
[ROW][C]Raw Output[/C][C]view raw output of R engine [/C][/ROW]
[ROW][C]Computing time[/C][C]1 seconds[/C][/ROW]
[ROW][C]R Server[/C][C]'George Udny Yule' @ 72.249.76.132[/C][/ROW]
[/TABLE]
Source: https://freestatistics.org/blog/index.php?pk=39962&T=0

Globally Unique Identifier (entire table): ba.freestatistics.org/blog/index.php?pk=39962&T=0

As an alternative you can also use a QR Code:  

The GUIDs for individual cells are displayed in the table below:

Summary of computational transaction
Raw Inputview raw input (R code)
Raw Outputview raw output of R engine
Computing time1 seconds
R Server'George Udny Yule' @ 72.249.76.132


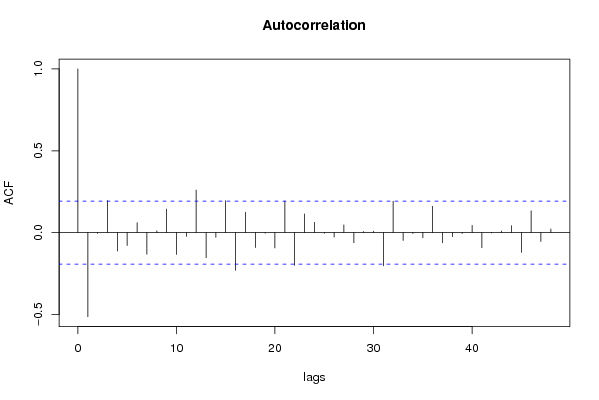
Autocorrelation Function
Time lag kACF(k)T-STATP-value
1-0.513415-5.23580
2-0.004803-0.0490.480515
30.1960581.99940.024086
4-0.112899-1.15130.126115
5-0.078063-0.79610.213898
60.0604560.61650.269446
7-0.131711-1.34320.091066
80.0108360.11050.45611
90.1436091.46450.073033
10-0.133585-1.36230.088023
11-0.02247-0.22910.409601
120.2597032.64850.004673
13-0.153537-1.56580.060219
14-0.028441-0.290.386179
150.1955661.99440.024363
16-0.230116-2.34670.010417
170.1249521.27430.102704
18-0.091054-0.92860.17763
19-0.003636-0.03710.485245
20-0.093323-0.95170.171725
210.1924821.96290.026162
22-0.19963-2.03580.022155
230.1139371.16190.123962
240.0626850.63930.262027
25-0.004226-0.04310.482855
26-0.02707-0.27610.391526
270.0470620.47990.31614
28-0.061258-0.62470.266766
290.0076050.07760.469165
300.008550.08720.465341
31-0.203015-2.07040.020448
320.1922311.96040.026313
33-0.047835-0.48780.313351
34-0.004673-0.04770.481041
35-0.031737-0.32370.373424
360.1608811.64070.051944
37-0.062353-0.63590.263125
38-0.024739-0.25230.400659
39-0.004749-0.04840.480734
400.0437930.44660.328044
41-0.092233-0.94060.174547
42-0.002067-0.02110.49161
430.0097140.09910.46064
440.0424150.43260.333118
45-0.121466-1.23870.10912
460.1328661.3550.089182
47-0.05395-0.55020.291687
480.022550.230.409287

\begin{tabular}{lllllllll}
\hline
Autocorrelation Function \tabularnewline
Time lag k & ACF(k) & T-STAT & P-value \tabularnewline
1 & -0.513415 & -5.2358 & 0 \tabularnewline
2 & -0.004803 & -0.049 & 0.480515 \tabularnewline
3 & 0.196058 & 1.9994 & 0.024086 \tabularnewline
4 & -0.112899 & -1.1513 & 0.126115 \tabularnewline
5 & -0.078063 & -0.7961 & 0.213898 \tabularnewline
6 & 0.060456 & 0.6165 & 0.269446 \tabularnewline
7 & -0.131711 & -1.3432 & 0.091066 \tabularnewline
8 & 0.010836 & 0.1105 & 0.45611 \tabularnewline
9 & 0.143609 & 1.4645 & 0.073033 \tabularnewline
10 & -0.133585 & -1.3623 & 0.088023 \tabularnewline
11 & -0.02247 & -0.2291 & 0.409601 \tabularnewline
12 & 0.259703 & 2.6485 & 0.004673 \tabularnewline
13 & -0.153537 & -1.5658 & 0.060219 \tabularnewline
14 & -0.028441 & -0.29 & 0.386179 \tabularnewline
15 & 0.195566 & 1.9944 & 0.024363 \tabularnewline
16 & -0.230116 & -2.3467 & 0.010417 \tabularnewline
17 & 0.124952 & 1.2743 & 0.102704 \tabularnewline
18 & -0.091054 & -0.9286 & 0.17763 \tabularnewline
19 & -0.003636 & -0.0371 & 0.485245 \tabularnewline
20 & -0.093323 & -0.9517 & 0.171725 \tabularnewline
21 & 0.192482 & 1.9629 & 0.026162 \tabularnewline
22 & -0.19963 & -2.0358 & 0.022155 \tabularnewline
23 & 0.113937 & 1.1619 & 0.123962 \tabularnewline
24 & 0.062685 & 0.6393 & 0.262027 \tabularnewline
25 & -0.004226 & -0.0431 & 0.482855 \tabularnewline
26 & -0.02707 & -0.2761 & 0.391526 \tabularnewline
27 & 0.047062 & 0.4799 & 0.31614 \tabularnewline
28 & -0.061258 & -0.6247 & 0.266766 \tabularnewline
29 & 0.007605 & 0.0776 & 0.469165 \tabularnewline
30 & 0.00855 & 0.0872 & 0.465341 \tabularnewline
31 & -0.203015 & -2.0704 & 0.020448 \tabularnewline
32 & 0.192231 & 1.9604 & 0.026313 \tabularnewline
33 & -0.047835 & -0.4878 & 0.313351 \tabularnewline
34 & -0.004673 & -0.0477 & 0.481041 \tabularnewline
35 & -0.031737 & -0.3237 & 0.373424 \tabularnewline
36 & 0.160881 & 1.6407 & 0.051944 \tabularnewline
37 & -0.062353 & -0.6359 & 0.263125 \tabularnewline
38 & -0.024739 & -0.2523 & 0.400659 \tabularnewline
39 & -0.004749 & -0.0484 & 0.480734 \tabularnewline
40 & 0.043793 & 0.4466 & 0.328044 \tabularnewline
41 & -0.092233 & -0.9406 & 0.174547 \tabularnewline
42 & -0.002067 & -0.0211 & 0.49161 \tabularnewline
43 & 0.009714 & 0.0991 & 0.46064 \tabularnewline
44 & 0.042415 & 0.4326 & 0.333118 \tabularnewline
45 & -0.121466 & -1.2387 & 0.10912 \tabularnewline
46 & 0.132866 & 1.355 & 0.089182 \tabularnewline
47 & -0.05395 & -0.5502 & 0.291687 \tabularnewline
48 & 0.02255 & 0.23 & 0.409287 \tabularnewline
\hline
\end{tabular}
%Source: https://freestatistics.org/blog/index.php?pk=39962&T=1

[TABLE]
[ROW][C]Autocorrelation Function[/C][/ROW]
[ROW][C]Time lag k[/C][C]ACF(k)[/C][C]T-STAT[/C][C]P-value[/C][/ROW]
[ROW][C]1[/C][C]-0.513415[/C][C]-5.2358[/C][C]0[/C][/ROW]
[ROW][C]2[/C][C]-0.004803[/C][C]-0.049[/C][C]0.480515[/C][/ROW]
[ROW][C]3[/C][C]0.196058[/C][C]1.9994[/C][C]0.024086[/C][/ROW]
[ROW][C]4[/C][C]-0.112899[/C][C]-1.1513[/C][C]0.126115[/C][/ROW]
[ROW][C]5[/C][C]-0.078063[/C][C]-0.7961[/C][C]0.213898[/C][/ROW]
[ROW][C]6[/C][C]0.060456[/C][C]0.6165[/C][C]0.269446[/C][/ROW]
[ROW][C]7[/C][C]-0.131711[/C][C]-1.3432[/C][C]0.091066[/C][/ROW]
[ROW][C]8[/C][C]0.010836[/C][C]0.1105[/C][C]0.45611[/C][/ROW]
[ROW][C]9[/C][C]0.143609[/C][C]1.4645[/C][C]0.073033[/C][/ROW]
[ROW][C]10[/C][C]-0.133585[/C][C]-1.3623[/C][C]0.088023[/C][/ROW]
[ROW][C]11[/C][C]-0.02247[/C][C]-0.2291[/C][C]0.409601[/C][/ROW]
[ROW][C]12[/C][C]0.259703[/C][C]2.6485[/C][C]0.004673[/C][/ROW]
[ROW][C]13[/C][C]-0.153537[/C][C]-1.5658[/C][C]0.060219[/C][/ROW]
[ROW][C]14[/C][C]-0.028441[/C][C]-0.29[/C][C]0.386179[/C][/ROW]
[ROW][C]15[/C][C]0.195566[/C][C]1.9944[/C][C]0.024363[/C][/ROW]
[ROW][C]16[/C][C]-0.230116[/C][C]-2.3467[/C][C]0.010417[/C][/ROW]
[ROW][C]17[/C][C]0.124952[/C][C]1.2743[/C][C]0.102704[/C][/ROW]
[ROW][C]18[/C][C]-0.091054[/C][C]-0.9286[/C][C]0.17763[/C][/ROW]
[ROW][C]19[/C][C]-0.003636[/C][C]-0.0371[/C][C]0.485245[/C][/ROW]
[ROW][C]20[/C][C]-0.093323[/C][C]-0.9517[/C][C]0.171725[/C][/ROW]
[ROW][C]21[/C][C]0.192482[/C][C]1.9629[/C][C]0.026162[/C][/ROW]
[ROW][C]22[/C][C]-0.19963[/C][C]-2.0358[/C][C]0.022155[/C][/ROW]
[ROW][C]23[/C][C]0.113937[/C][C]1.1619[/C][C]0.123962[/C][/ROW]
[ROW][C]24[/C][C]0.062685[/C][C]0.6393[/C][C]0.262027[/C][/ROW]
[ROW][C]25[/C][C]-0.004226[/C][C]-0.0431[/C][C]0.482855[/C][/ROW]
[ROW][C]26[/C][C]-0.02707[/C][C]-0.2761[/C][C]0.391526[/C][/ROW]
[ROW][C]27[/C][C]0.047062[/C][C]0.4799[/C][C]0.31614[/C][/ROW]
[ROW][C]28[/C][C]-0.061258[/C][C]-0.6247[/C][C]0.266766[/C][/ROW]
[ROW][C]29[/C][C]0.007605[/C][C]0.0776[/C][C]0.469165[/C][/ROW]
[ROW][C]30[/C][C]0.00855[/C][C]0.0872[/C][C]0.465341[/C][/ROW]
[ROW][C]31[/C][C]-0.203015[/C][C]-2.0704[/C][C]0.020448[/C][/ROW]
[ROW][C]32[/C][C]0.192231[/C][C]1.9604[/C][C]0.026313[/C][/ROW]
[ROW][C]33[/C][C]-0.047835[/C][C]-0.4878[/C][C]0.313351[/C][/ROW]
[ROW][C]34[/C][C]-0.004673[/C][C]-0.0477[/C][C]0.481041[/C][/ROW]
[ROW][C]35[/C][C]-0.031737[/C][C]-0.3237[/C][C]0.373424[/C][/ROW]
[ROW][C]36[/C][C]0.160881[/C][C]1.6407[/C][C]0.051944[/C][/ROW]
[ROW][C]37[/C][C]-0.062353[/C][C]-0.6359[/C][C]0.263125[/C][/ROW]
[ROW][C]38[/C][C]-0.024739[/C][C]-0.2523[/C][C]0.400659[/C][/ROW]
[ROW][C]39[/C][C]-0.004749[/C][C]-0.0484[/C][C]0.480734[/C][/ROW]
[ROW][C]40[/C][C]0.043793[/C][C]0.4466[/C][C]0.328044[/C][/ROW]
[ROW][C]41[/C][C]-0.092233[/C][C]-0.9406[/C][C]0.174547[/C][/ROW]
[ROW][C]42[/C][C]-0.002067[/C][C]-0.0211[/C][C]0.49161[/C][/ROW]
[ROW][C]43[/C][C]0.009714[/C][C]0.0991[/C][C]0.46064[/C][/ROW]
[ROW][C]44[/C][C]0.042415[/C][C]0.4326[/C][C]0.333118[/C][/ROW]
[ROW][C]45[/C][C]-0.121466[/C][C]-1.2387[/C][C]0.10912[/C][/ROW]
[ROW][C]46[/C][C]0.132866[/C][C]1.355[/C][C]0.089182[/C][/ROW]
[ROW][C]47[/C][C]-0.05395[/C][C]-0.5502[/C][C]0.291687[/C][/ROW]
[ROW][C]48[/C][C]0.02255[/C][C]0.23[/C][C]0.409287[/C][/ROW]
[/TABLE]
Source: https://freestatistics.org/blog/index.php?pk=39962&T=1

Globally Unique Identifier (entire table): ba.freestatistics.org/blog/index.php?pk=39962&T=1

As an alternative you can also use a QR Code:  

The GUIDs for individual cells are displayed in the table below:

Autocorrelation Function
Time lag kACF(k)T-STATP-value
1-0.513415-5.23580
2-0.004803-0.0490.480515
30.1960581.99940.024086
4-0.112899-1.15130.126115
5-0.078063-0.79610.213898
60.0604560.61650.269446
7-0.131711-1.34320.091066
80.0108360.11050.45611
90.1436091.46450.073033
10-0.133585-1.36230.088023
11-0.02247-0.22910.409601
120.2597032.64850.004673
13-0.153537-1.56580.060219
14-0.028441-0.290.386179
150.1955661.99440.024363
16-0.230116-2.34670.010417
170.1249521.27430.102704
18-0.091054-0.92860.17763
19-0.003636-0.03710.485245
20-0.093323-0.95170.171725
210.1924821.96290.026162
22-0.19963-2.03580.022155
230.1139371.16190.123962
240.0626850.63930.262027
25-0.004226-0.04310.482855
26-0.02707-0.27610.391526
270.0470620.47990.31614
28-0.061258-0.62470.266766
290.0076050.07760.469165
300.008550.08720.465341
31-0.203015-2.07040.020448
320.1922311.96040.026313
33-0.047835-0.48780.313351
34-0.004673-0.04770.481041
35-0.031737-0.32370.373424
360.1608811.64070.051944
37-0.062353-0.63590.263125
38-0.024739-0.25230.400659
39-0.004749-0.04840.480734
400.0437930.44660.328044
41-0.092233-0.94060.174547
42-0.002067-0.02110.49161
430.0097140.09910.46064
440.0424150.43260.333118
45-0.121466-1.23870.10912
460.1328661.3550.089182
47-0.05395-0.55020.291687
480.022550.230.409287


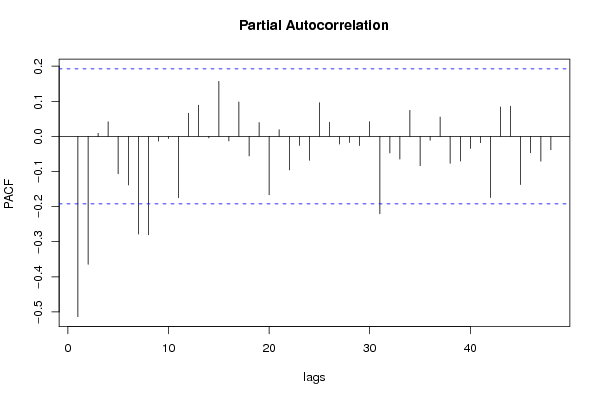
Partial Autocorrelation Function
Time lag kPACF(k)T-STATP-value
1-0.513415-5.23580
2-0.36447-3.71690.000163
30.0087210.08890.46465
40.0416280.42450.336032
5-0.106595-1.08710.139762
6-0.138201-1.40940.080853
7-0.278121-2.83630.002743
8-0.280233-2.85780.002577
9-0.013304-0.13570.446169
10-0.006221-0.06340.474768
11-0.174928-1.78390.038677
120.0661110.67420.250838
130.0890990.90860.182822
14-0.004316-0.0440.48249
150.1568131.59920.056407
16-0.013055-0.13310.447171
170.0982391.00180.159372
18-0.055791-0.5690.285304
190.0396420.40430.343423
20-0.166433-1.69730.046316
210.0192380.19620.422422
22-0.095635-0.97530.165841
23-0.025535-0.26040.39753
24-0.068111-0.69460.244429
250.0959860.97890.164958
260.0405020.4130.340214
27-0.021645-0.22070.412863
28-0.017121-0.17460.430865
29-0.025991-0.26510.395746
300.0419760.42810.334742
31-0.220356-2.24720.01337
32-0.047219-0.48150.315571
33-0.064474-0.65750.256153
340.0743820.75860.224917
35-0.083489-0.85140.198245
36-0.011229-0.11450.454528
370.054990.56080.288073
38-0.076629-0.78150.218153
39-0.070336-0.71730.237402
40-0.034332-0.35010.36348
41-0.017934-0.18290.42762
42-0.174301-1.77750.039203
430.0839640.85630.196908
440.0860090.87710.19122
45-0.137297-1.40020.08222
46-0.046673-0.4760.317546
47-0.070627-0.72030.23649
48-0.037854-0.3860.35013

\begin{tabular}{lllllllll}
\hline
Partial Autocorrelation Function \tabularnewline
Time lag k & PACF(k) & T-STAT & P-value \tabularnewline
1 & -0.513415 & -5.2358 & 0 \tabularnewline
2 & -0.36447 & -3.7169 & 0.000163 \tabularnewline
3 & 0.008721 & 0.0889 & 0.46465 \tabularnewline
4 & 0.041628 & 0.4245 & 0.336032 \tabularnewline
5 & -0.106595 & -1.0871 & 0.139762 \tabularnewline
6 & -0.138201 & -1.4094 & 0.080853 \tabularnewline
7 & -0.278121 & -2.8363 & 0.002743 \tabularnewline
8 & -0.280233 & -2.8578 & 0.002577 \tabularnewline
9 & -0.013304 & -0.1357 & 0.446169 \tabularnewline
10 & -0.006221 & -0.0634 & 0.474768 \tabularnewline
11 & -0.174928 & -1.7839 & 0.038677 \tabularnewline
12 & 0.066111 & 0.6742 & 0.250838 \tabularnewline
13 & 0.089099 & 0.9086 & 0.182822 \tabularnewline
14 & -0.004316 & -0.044 & 0.48249 \tabularnewline
15 & 0.156813 & 1.5992 & 0.056407 \tabularnewline
16 & -0.013055 & -0.1331 & 0.447171 \tabularnewline
17 & 0.098239 & 1.0018 & 0.159372 \tabularnewline
18 & -0.055791 & -0.569 & 0.285304 \tabularnewline
19 & 0.039642 & 0.4043 & 0.343423 \tabularnewline
20 & -0.166433 & -1.6973 & 0.046316 \tabularnewline
21 & 0.019238 & 0.1962 & 0.422422 \tabularnewline
22 & -0.095635 & -0.9753 & 0.165841 \tabularnewline
23 & -0.025535 & -0.2604 & 0.39753 \tabularnewline
24 & -0.068111 & -0.6946 & 0.244429 \tabularnewline
25 & 0.095986 & 0.9789 & 0.164958 \tabularnewline
26 & 0.040502 & 0.413 & 0.340214 \tabularnewline
27 & -0.021645 & -0.2207 & 0.412863 \tabularnewline
28 & -0.017121 & -0.1746 & 0.430865 \tabularnewline
29 & -0.025991 & -0.2651 & 0.395746 \tabularnewline
30 & 0.041976 & 0.4281 & 0.334742 \tabularnewline
31 & -0.220356 & -2.2472 & 0.01337 \tabularnewline
32 & -0.047219 & -0.4815 & 0.315571 \tabularnewline
33 & -0.064474 & -0.6575 & 0.256153 \tabularnewline
34 & 0.074382 & 0.7586 & 0.224917 \tabularnewline
35 & -0.083489 & -0.8514 & 0.198245 \tabularnewline
36 & -0.011229 & -0.1145 & 0.454528 \tabularnewline
37 & 0.05499 & 0.5608 & 0.288073 \tabularnewline
38 & -0.076629 & -0.7815 & 0.218153 \tabularnewline
39 & -0.070336 & -0.7173 & 0.237402 \tabularnewline
40 & -0.034332 & -0.3501 & 0.36348 \tabularnewline
41 & -0.017934 & -0.1829 & 0.42762 \tabularnewline
42 & -0.174301 & -1.7775 & 0.039203 \tabularnewline
43 & 0.083964 & 0.8563 & 0.196908 \tabularnewline
44 & 0.086009 & 0.8771 & 0.19122 \tabularnewline
45 & -0.137297 & -1.4002 & 0.08222 \tabularnewline
46 & -0.046673 & -0.476 & 0.317546 \tabularnewline
47 & -0.070627 & -0.7203 & 0.23649 \tabularnewline
48 & -0.037854 & -0.386 & 0.35013 \tabularnewline
\hline
\end{tabular}
%Source: https://freestatistics.org/blog/index.php?pk=39962&T=2

[TABLE]
[ROW][C]Partial Autocorrelation Function[/C][/ROW]
[ROW][C]Time lag k[/C][C]PACF(k)[/C][C]T-STAT[/C][C]P-value[/C][/ROW]
[ROW][C]1[/C][C]-0.513415[/C][C]-5.2358[/C][C]0[/C][/ROW]
[ROW][C]2[/C][C]-0.36447[/C][C]-3.7169[/C][C]0.000163[/C][/ROW]
[ROW][C]3[/C][C]0.008721[/C][C]0.0889[/C][C]0.46465[/C][/ROW]
[ROW][C]4[/C][C]0.041628[/C][C]0.4245[/C][C]0.336032[/C][/ROW]
[ROW][C]5[/C][C]-0.106595[/C][C]-1.0871[/C][C]0.139762[/C][/ROW]
[ROW][C]6[/C][C]-0.138201[/C][C]-1.4094[/C][C]0.080853[/C][/ROW]
[ROW][C]7[/C][C]-0.278121[/C][C]-2.8363[/C][C]0.002743[/C][/ROW]
[ROW][C]8[/C][C]-0.280233[/C][C]-2.8578[/C][C]0.002577[/C][/ROW]
[ROW][C]9[/C][C]-0.013304[/C][C]-0.1357[/C][C]0.446169[/C][/ROW]
[ROW][C]10[/C][C]-0.006221[/C][C]-0.0634[/C][C]0.474768[/C][/ROW]
[ROW][C]11[/C][C]-0.174928[/C][C]-1.7839[/C][C]0.038677[/C][/ROW]
[ROW][C]12[/C][C]0.066111[/C][C]0.6742[/C][C]0.250838[/C][/ROW]
[ROW][C]13[/C][C]0.089099[/C][C]0.9086[/C][C]0.182822[/C][/ROW]
[ROW][C]14[/C][C]-0.004316[/C][C]-0.044[/C][C]0.48249[/C][/ROW]
[ROW][C]15[/C][C]0.156813[/C][C]1.5992[/C][C]0.056407[/C][/ROW]
[ROW][C]16[/C][C]-0.013055[/C][C]-0.1331[/C][C]0.447171[/C][/ROW]
[ROW][C]17[/C][C]0.098239[/C][C]1.0018[/C][C]0.159372[/C][/ROW]
[ROW][C]18[/C][C]-0.055791[/C][C]-0.569[/C][C]0.285304[/C][/ROW]
[ROW][C]19[/C][C]0.039642[/C][C]0.4043[/C][C]0.343423[/C][/ROW]
[ROW][C]20[/C][C]-0.166433[/C][C]-1.6973[/C][C]0.046316[/C][/ROW]
[ROW][C]21[/C][C]0.019238[/C][C]0.1962[/C][C]0.422422[/C][/ROW]
[ROW][C]22[/C][C]-0.095635[/C][C]-0.9753[/C][C]0.165841[/C][/ROW]
[ROW][C]23[/C][C]-0.025535[/C][C]-0.2604[/C][C]0.39753[/C][/ROW]
[ROW][C]24[/C][C]-0.068111[/C][C]-0.6946[/C][C]0.244429[/C][/ROW]
[ROW][C]25[/C][C]0.095986[/C][C]0.9789[/C][C]0.164958[/C][/ROW]
[ROW][C]26[/C][C]0.040502[/C][C]0.413[/C][C]0.340214[/C][/ROW]
[ROW][C]27[/C][C]-0.021645[/C][C]-0.2207[/C][C]0.412863[/C][/ROW]
[ROW][C]28[/C][C]-0.017121[/C][C]-0.1746[/C][C]0.430865[/C][/ROW]
[ROW][C]29[/C][C]-0.025991[/C][C]-0.2651[/C][C]0.395746[/C][/ROW]
[ROW][C]30[/C][C]0.041976[/C][C]0.4281[/C][C]0.334742[/C][/ROW]
[ROW][C]31[/C][C]-0.220356[/C][C]-2.2472[/C][C]0.01337[/C][/ROW]
[ROW][C]32[/C][C]-0.047219[/C][C]-0.4815[/C][C]0.315571[/C][/ROW]
[ROW][C]33[/C][C]-0.064474[/C][C]-0.6575[/C][C]0.256153[/C][/ROW]
[ROW][C]34[/C][C]0.074382[/C][C]0.7586[/C][C]0.224917[/C][/ROW]
[ROW][C]35[/C][C]-0.083489[/C][C]-0.8514[/C][C]0.198245[/C][/ROW]
[ROW][C]36[/C][C]-0.011229[/C][C]-0.1145[/C][C]0.454528[/C][/ROW]
[ROW][C]37[/C][C]0.05499[/C][C]0.5608[/C][C]0.288073[/C][/ROW]
[ROW][C]38[/C][C]-0.076629[/C][C]-0.7815[/C][C]0.218153[/C][/ROW]
[ROW][C]39[/C][C]-0.070336[/C][C]-0.7173[/C][C]0.237402[/C][/ROW]
[ROW][C]40[/C][C]-0.034332[/C][C]-0.3501[/C][C]0.36348[/C][/ROW]
[ROW][C]41[/C][C]-0.017934[/C][C]-0.1829[/C][C]0.42762[/C][/ROW]
[ROW][C]42[/C][C]-0.174301[/C][C]-1.7775[/C][C]0.039203[/C][/ROW]
[ROW][C]43[/C][C]0.083964[/C][C]0.8563[/C][C]0.196908[/C][/ROW]
[ROW][C]44[/C][C]0.086009[/C][C]0.8771[/C][C]0.19122[/C][/ROW]
[ROW][C]45[/C][C]-0.137297[/C][C]-1.4002[/C][C]0.08222[/C][/ROW]
[ROW][C]46[/C][C]-0.046673[/C][C]-0.476[/C][C]0.317546[/C][/ROW]
[ROW][C]47[/C][C]-0.070627[/C][C]-0.7203[/C][C]0.23649[/C][/ROW]
[ROW][C]48[/C][C]-0.037854[/C][C]-0.386[/C][C]0.35013[/C][/ROW]
[/TABLE]
Source: https://freestatistics.org/blog/index.php?pk=39962&T=2

Globally Unique Identifier (entire table): ba.freestatistics.org/blog/index.php?pk=39962&T=2

As an alternative you can also use a QR Code:  

The GUIDs for individual cells are displayed in the table below:

Partial Autocorrelation Function
Time lag kPACF(k)T-STATP-value
1-0.513415-5.23580
2-0.36447-3.71690.000163
30.0087210.08890.46465
40.0416280.42450.336032
5-0.106595-1.08710.139762
6-0.138201-1.40940.080853
7-0.278121-2.83630.002743
8-0.280233-2.85780.002577
9-0.013304-0.13570.446169
10-0.006221-0.06340.474768
11-0.174928-1.78390.038677
120.0661110.67420.250838
130.0890990.90860.182822
14-0.004316-0.0440.48249
150.1568131.59920.056407
16-0.013055-0.13310.447171
170.0982391.00180.159372
18-0.055791-0.5690.285304
190.0396420.40430.343423
20-0.166433-1.69730.046316
210.0192380.19620.422422
22-0.095635-0.97530.165841
23-0.025535-0.26040.39753
24-0.068111-0.69460.244429
250.0959860.97890.164958
260.0405020.4130.340214
27-0.021645-0.22070.412863
28-0.017121-0.17460.430865
29-0.025991-0.26510.395746
300.0419760.42810.334742
31-0.220356-2.24720.01337
32-0.047219-0.48150.315571
33-0.064474-0.65750.256153
340.0743820.75860.224917
35-0.083489-0.85140.198245
36-0.011229-0.11450.454528
370.054990.56080.288073
38-0.076629-0.78150.218153
39-0.070336-0.71730.237402
40-0.034332-0.35010.36348
41-0.017934-0.18290.42762
42-0.174301-1.77750.039203
430.0839640.85630.196908
440.0860090.87710.19122
45-0.137297-1.40020.08222
46-0.046673-0.4760.317546
47-0.070627-0.72030.23649
48-0.037854-0.3860.35013


Parameters (Session):
par1 = 48 ; par2 = 1 ; par3 = 1 ; par4 = 0 ; par5 = 12 ;
Parameters (R input):
par1 = 48 ; par2 = 1 ; par3 = 1 ; par4 = 0 ; par5 = 12 ;
R code (references can be found in the software module):
if (par1 == 'Default') {
par1 = 10*log10(length(x))
} else {
par1 <- as.numeric(par1)
}
par2 <- as.numeric(par2)
par3 <- as.numeric(par3)
par4 <- as.numeric(par4)
par5 <- as.numeric(par5)
if (par2 == 0) {
x <- log(x)
} else {
x <- (x ^ par2 - 1) / par2
}
if (par3 > 0) x <- diff(x,lag=1,difference=par3)
if (par4 > 0) x <- diff(x,lag=par5,difference=par4)
bitmap(file='pic1.png')
racf <- acf(x,par1,main='Autocorrelation',xlab='lags',ylab='ACF')
dev.off()
bitmap(file='pic2.png')
rpacf <- pacf(x,par1,main='Partial Autocorrelation',xlab='lags',ylab='PACF')
dev.off()
(myacf <- c(racf$acf))
(mypacf <- c(rpacf$acf))
lengthx <- length(x)
sqrtn <- sqrt(lengthx)
load(file='createtable')
a<-table.start()
a<-table.row.start(a)
a<-table.element(a,'Autocorrelation Function',4,TRUE)
a<-table.row.end(a)
a<-table.row.start(a)
a<-table.element(a,'Time lag k',header=TRUE)
a<-table.element(a,hyperlink('basics.htm','ACF(k)','click here for more information about the Autocorrelation Function'),header=TRUE)
a<-table.element(a,'T-STAT',header=TRUE)
a<-table.element(a,'P-value',header=TRUE)
a<-table.row.end(a)
for (i in 2:(par1+1)) {
a<-table.row.start(a)
a<-table.element(a,i-1,header=TRUE)
a<-table.element(a,round(myacf[i],6))
mytstat <- myacf[i]*sqrtn
a<-table.element(a,round(mytstat,4))
a<-table.element(a,round(1-pt(abs(mytstat),lengthx),6))
a<-table.row.end(a)
}
a<-table.end(a)
table.save(a,file='mytable.tab')
a<-table.start()
a<-table.row.start(a)
a<-table.element(a,'Partial Autocorrelation Function',4,TRUE)
a<-table.row.end(a)
a<-table.row.start(a)
a<-table.element(a,'Time lag k',header=TRUE)
a<-table.element(a,hyperlink('basics.htm','PACF(k)','click here for more information about the Partial Autocorrelation Function'),header=TRUE)
a<-table.element(a,'T-STAT',header=TRUE)
a<-table.element(a,'P-value',header=TRUE)
a<-table.row.end(a)
for (i in 1:par1) {
a<-table.row.start(a)
a<-table.element(a,i,header=TRUE)
a<-table.element(a,round(mypacf[i],6))
mytstat <- mypacf[i]*sqrtn
a<-table.element(a,round(mytstat,4))
a<-table.element(a,round(1-pt(abs(mytstat),lengthx),6))
a<-table.row.end(a)
}
a<-table.end(a)
table.save(a,file='mytable1.tab')