Free Statistics

of Irreproducible Research!

Author's title

Gedifferentieerde Autocorrelation consumptieprijs biefstuk - Mattias Dierck...

Author*Unverified author*
R Software Modulerwasp_autocorrelation.wasp
Title produced by software(Partial) Autocorrelation Function
Date of computationWed, 13 May 2009 13:27:21 -0600
Cite this page as followsStatistical Computations at FreeStatistics.org, Office for Research Development and Education, URL https://freestatistics.org/blog/index.php?v=date/2009/May/13/t1242242888nwaii97t7mrj0o3.htm/, Retrieved Thu, 09 May 2024 01:46:35 +0000
Statistical Computations at FreeStatistics.org, Office for Research Development and Education, URL https://freestatistics.org/blog/index.php?pk=39919, Retrieved Thu, 09 May 2024 01:46:35 +0000
QR Codes:

Original text written by user:
IsPrivate?No (this computation is public)
User-defined keywords
Estimated Impact119
Family? (F = Feedback message, R = changed R code, M = changed R Module, P = changed Parameters, D = changed Data)
-       [(Partial) Autocorrelation Function] [Gedifferentieerde...] [2009-05-13 19:27:21] [cad785efdc96cabf1c219520e59eafa5] [Current]
Feedback Forum

Post a new message
Dataseries X:
9.370
9.330
9.310
9.260
9.350
9.380
9.430
9.270
9.290
9.270
9.290
9.310
9.330
9.350
9.340
9.470
9.630
9.620
9.630
9.500
9.550
9.580
9.610
9.570
9.610
9.650
9.620
9.650
9.960
10.030
10.030
9.720
9.750
9.770
9.780
9.820
9.840
9.900
9.940
10.120
10.520
10.570
10.570
10.120
10.050
10.140
10.170
10.200
10.200
10.350
10.430
10.570
10.820
10.900
10.830
10.650
10.570
10.610
10.630
10.710
10.720
10.770
10.790
10.920
10.900
11.000
10.990
10.910
10.880
10.870
11.000
10.990
11.030
11.040
10.990


Summary of computational transaction
Raw Inputview raw input (R code)
Raw Outputview raw output of R engine
Computing time1 seconds
R Server'Gwilym Jenkins' @ 72.249.127.135
R Framework error message
Warning: there are blank lines in the 'Data' field.
Please, use NA for missing data - blank lines are simply
 deleted and are NOT treated as missing values.

\begin{tabular}{lllllllll}
\hline
Summary of computational transaction \tabularnewline
Raw Input & view raw input (R code)  \tabularnewline
Raw Output & view raw output of R engine  \tabularnewline
Computing time & 1 seconds \tabularnewline
R Server & 'Gwilym Jenkins' @ 72.249.127.135 \tabularnewline
R Framework error message & 
Warning: there are blank lines in the 'Data' field.
Please, use NA for missing data - blank lines are simply
 deleted and are NOT treated as missing values.
\tabularnewline \hline \end{tabular} %Source: https://freestatistics.org/blog/index.php?pk=39919&T=0

[TABLE]
[ROW][C]Summary of computational transaction[/C][/ROW]
[ROW][C]Raw Input[/C][C]view raw input (R code) [/C][/ROW]
[ROW][C]Raw Output[/C][C]view raw output of R engine [/C][/ROW]
[ROW][C]Computing time[/C][C]1 seconds[/C][/ROW]
[ROW][C]R Server[/C][C]'Gwilym Jenkins' @ 72.249.127.135[/C][/ROW]
[ROW][C]R Framework error message[/C][C]
Warning: there are blank lines in the 'Data' field.
Please, use NA for missing data - blank lines are simply
 deleted and are NOT treated as missing values.
[/C][/ROW] [/TABLE] Source: https://freestatistics.org/blog/index.php?pk=39919&T=0

Globally Unique Identifier (entire table): ba.freestatistics.org/blog/index.php?pk=39919&T=0

As an alternative you can also use a QR Code:  

The GUIDs for individual cells are displayed in the table below:

Summary of computational transaction
Raw Inputview raw input (R code)
Raw Outputview raw output of R engine
Computing time1 seconds
R Server'Gwilym Jenkins' @ 72.249.127.135
R Framework error message
Warning: there are blank lines in the 'Data' field.
Please, use NA for missing data - blank lines are simply
 deleted and are NOT treated as missing values.


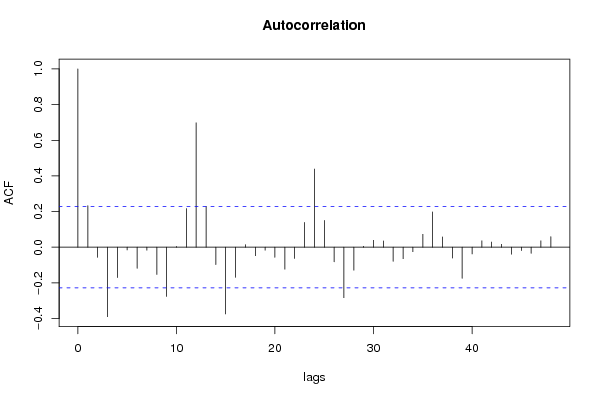
Autocorrelation Function
Time lag kACF(k)T-STATP-value
10.2328232.00280.02443
2-0.056846-0.4890.313143
3-0.389408-3.34980.000638
4-0.17043-1.46610.07343
5-0.015035-0.12930.448722
6-0.118222-1.0170.156237
7-0.016269-0.140.44454
8-0.152507-1.31190.096803
9-0.276042-2.37460.010081
100.0046040.03960.484256
110.2166121.86340.033189
120.6978526.00320
130.228931.96930.026329
14-0.097047-0.83480.20325
15-0.374416-3.22080.00095
16-0.168832-1.45230.075316
170.0145640.12530.450318
18-0.047545-0.4090.34186
19-0.016727-0.14390.442988
20-0.056731-0.4880.313489
21-0.123455-1.0620.145845
22-0.062918-0.54120.294984
230.1393631.19880.117207
240.4381753.76930.000163
250.1500691.29090.100371
26-0.082069-0.7060.241207
27-0.283382-2.43770.00859
28-0.128592-1.10620.136114
290.0051790.04460.482292
300.038880.33450.369491
310.0349920.3010.382124
32-0.078968-0.67930.249531
33-0.064102-0.55140.291501
34-0.025385-0.21840.413871
350.0722380.62140.268119
360.1980021.70330.046357
370.0576610.4960.310675
38-0.06053-0.52070.302066
39-0.174627-1.50220.068651
40-0.037784-0.3250.373038
410.0358320.30820.379382
420.0291970.25120.401193
430.0161520.13890.444937
44-0.038734-0.33320.369963
45-0.018863-0.16230.435769
46-0.034087-0.29320.385086
470.0358880.30870.379201
480.059310.51020.305715

\begin{tabular}{lllllllll}
\hline
Autocorrelation Function \tabularnewline
Time lag k & ACF(k) & T-STAT & P-value \tabularnewline
1 & 0.232823 & 2.0028 & 0.02443 \tabularnewline
2 & -0.056846 & -0.489 & 0.313143 \tabularnewline
3 & -0.389408 & -3.3498 & 0.000638 \tabularnewline
4 & -0.17043 & -1.4661 & 0.07343 \tabularnewline
5 & -0.015035 & -0.1293 & 0.448722 \tabularnewline
6 & -0.118222 & -1.017 & 0.156237 \tabularnewline
7 & -0.016269 & -0.14 & 0.44454 \tabularnewline
8 & -0.152507 & -1.3119 & 0.096803 \tabularnewline
9 & -0.276042 & -2.3746 & 0.010081 \tabularnewline
10 & 0.004604 & 0.0396 & 0.484256 \tabularnewline
11 & 0.216612 & 1.8634 & 0.033189 \tabularnewline
12 & 0.697852 & 6.0032 & 0 \tabularnewline
13 & 0.22893 & 1.9693 & 0.026329 \tabularnewline
14 & -0.097047 & -0.8348 & 0.20325 \tabularnewline
15 & -0.374416 & -3.2208 & 0.00095 \tabularnewline
16 & -0.168832 & -1.4523 & 0.075316 \tabularnewline
17 & 0.014564 & 0.1253 & 0.450318 \tabularnewline
18 & -0.047545 & -0.409 & 0.34186 \tabularnewline
19 & -0.016727 & -0.1439 & 0.442988 \tabularnewline
20 & -0.056731 & -0.488 & 0.313489 \tabularnewline
21 & -0.123455 & -1.062 & 0.145845 \tabularnewline
22 & -0.062918 & -0.5412 & 0.294984 \tabularnewline
23 & 0.139363 & 1.1988 & 0.117207 \tabularnewline
24 & 0.438175 & 3.7693 & 0.000163 \tabularnewline
25 & 0.150069 & 1.2909 & 0.100371 \tabularnewline
26 & -0.082069 & -0.706 & 0.241207 \tabularnewline
27 & -0.283382 & -2.4377 & 0.00859 \tabularnewline
28 & -0.128592 & -1.1062 & 0.136114 \tabularnewline
29 & 0.005179 & 0.0446 & 0.482292 \tabularnewline
30 & 0.03888 & 0.3345 & 0.369491 \tabularnewline
31 & 0.034992 & 0.301 & 0.382124 \tabularnewline
32 & -0.078968 & -0.6793 & 0.249531 \tabularnewline
33 & -0.064102 & -0.5514 & 0.291501 \tabularnewline
34 & -0.025385 & -0.2184 & 0.413871 \tabularnewline
35 & 0.072238 & 0.6214 & 0.268119 \tabularnewline
36 & 0.198002 & 1.7033 & 0.046357 \tabularnewline
37 & 0.057661 & 0.496 & 0.310675 \tabularnewline
38 & -0.06053 & -0.5207 & 0.302066 \tabularnewline
39 & -0.174627 & -1.5022 & 0.068651 \tabularnewline
40 & -0.037784 & -0.325 & 0.373038 \tabularnewline
41 & 0.035832 & 0.3082 & 0.379382 \tabularnewline
42 & 0.029197 & 0.2512 & 0.401193 \tabularnewline
43 & 0.016152 & 0.1389 & 0.444937 \tabularnewline
44 & -0.038734 & -0.3332 & 0.369963 \tabularnewline
45 & -0.018863 & -0.1623 & 0.435769 \tabularnewline
46 & -0.034087 & -0.2932 & 0.385086 \tabularnewline
47 & 0.035888 & 0.3087 & 0.379201 \tabularnewline
48 & 0.05931 & 0.5102 & 0.305715 \tabularnewline
\hline
\end{tabular}
%Source: https://freestatistics.org/blog/index.php?pk=39919&T=1

[TABLE]
[ROW][C]Autocorrelation Function[/C][/ROW]
[ROW][C]Time lag k[/C][C]ACF(k)[/C][C]T-STAT[/C][C]P-value[/C][/ROW]
[ROW][C]1[/C][C]0.232823[/C][C]2.0028[/C][C]0.02443[/C][/ROW]
[ROW][C]2[/C][C]-0.056846[/C][C]-0.489[/C][C]0.313143[/C][/ROW]
[ROW][C]3[/C][C]-0.389408[/C][C]-3.3498[/C][C]0.000638[/C][/ROW]
[ROW][C]4[/C][C]-0.17043[/C][C]-1.4661[/C][C]0.07343[/C][/ROW]
[ROW][C]5[/C][C]-0.015035[/C][C]-0.1293[/C][C]0.448722[/C][/ROW]
[ROW][C]6[/C][C]-0.118222[/C][C]-1.017[/C][C]0.156237[/C][/ROW]
[ROW][C]7[/C][C]-0.016269[/C][C]-0.14[/C][C]0.44454[/C][/ROW]
[ROW][C]8[/C][C]-0.152507[/C][C]-1.3119[/C][C]0.096803[/C][/ROW]
[ROW][C]9[/C][C]-0.276042[/C][C]-2.3746[/C][C]0.010081[/C][/ROW]
[ROW][C]10[/C][C]0.004604[/C][C]0.0396[/C][C]0.484256[/C][/ROW]
[ROW][C]11[/C][C]0.216612[/C][C]1.8634[/C][C]0.033189[/C][/ROW]
[ROW][C]12[/C][C]0.697852[/C][C]6.0032[/C][C]0[/C][/ROW]
[ROW][C]13[/C][C]0.22893[/C][C]1.9693[/C][C]0.026329[/C][/ROW]
[ROW][C]14[/C][C]-0.097047[/C][C]-0.8348[/C][C]0.20325[/C][/ROW]
[ROW][C]15[/C][C]-0.374416[/C][C]-3.2208[/C][C]0.00095[/C][/ROW]
[ROW][C]16[/C][C]-0.168832[/C][C]-1.4523[/C][C]0.075316[/C][/ROW]
[ROW][C]17[/C][C]0.014564[/C][C]0.1253[/C][C]0.450318[/C][/ROW]
[ROW][C]18[/C][C]-0.047545[/C][C]-0.409[/C][C]0.34186[/C][/ROW]
[ROW][C]19[/C][C]-0.016727[/C][C]-0.1439[/C][C]0.442988[/C][/ROW]
[ROW][C]20[/C][C]-0.056731[/C][C]-0.488[/C][C]0.313489[/C][/ROW]
[ROW][C]21[/C][C]-0.123455[/C][C]-1.062[/C][C]0.145845[/C][/ROW]
[ROW][C]22[/C][C]-0.062918[/C][C]-0.5412[/C][C]0.294984[/C][/ROW]
[ROW][C]23[/C][C]0.139363[/C][C]1.1988[/C][C]0.117207[/C][/ROW]
[ROW][C]24[/C][C]0.438175[/C][C]3.7693[/C][C]0.000163[/C][/ROW]
[ROW][C]25[/C][C]0.150069[/C][C]1.2909[/C][C]0.100371[/C][/ROW]
[ROW][C]26[/C][C]-0.082069[/C][C]-0.706[/C][C]0.241207[/C][/ROW]
[ROW][C]27[/C][C]-0.283382[/C][C]-2.4377[/C][C]0.00859[/C][/ROW]
[ROW][C]28[/C][C]-0.128592[/C][C]-1.1062[/C][C]0.136114[/C][/ROW]
[ROW][C]29[/C][C]0.005179[/C][C]0.0446[/C][C]0.482292[/C][/ROW]
[ROW][C]30[/C][C]0.03888[/C][C]0.3345[/C][C]0.369491[/C][/ROW]
[ROW][C]31[/C][C]0.034992[/C][C]0.301[/C][C]0.382124[/C][/ROW]
[ROW][C]32[/C][C]-0.078968[/C][C]-0.6793[/C][C]0.249531[/C][/ROW]
[ROW][C]33[/C][C]-0.064102[/C][C]-0.5514[/C][C]0.291501[/C][/ROW]
[ROW][C]34[/C][C]-0.025385[/C][C]-0.2184[/C][C]0.413871[/C][/ROW]
[ROW][C]35[/C][C]0.072238[/C][C]0.6214[/C][C]0.268119[/C][/ROW]
[ROW][C]36[/C][C]0.198002[/C][C]1.7033[/C][C]0.046357[/C][/ROW]
[ROW][C]37[/C][C]0.057661[/C][C]0.496[/C][C]0.310675[/C][/ROW]
[ROW][C]38[/C][C]-0.06053[/C][C]-0.5207[/C][C]0.302066[/C][/ROW]
[ROW][C]39[/C][C]-0.174627[/C][C]-1.5022[/C][C]0.068651[/C][/ROW]
[ROW][C]40[/C][C]-0.037784[/C][C]-0.325[/C][C]0.373038[/C][/ROW]
[ROW][C]41[/C][C]0.035832[/C][C]0.3082[/C][C]0.379382[/C][/ROW]
[ROW][C]42[/C][C]0.029197[/C][C]0.2512[/C][C]0.401193[/C][/ROW]
[ROW][C]43[/C][C]0.016152[/C][C]0.1389[/C][C]0.444937[/C][/ROW]
[ROW][C]44[/C][C]-0.038734[/C][C]-0.3332[/C][C]0.369963[/C][/ROW]
[ROW][C]45[/C][C]-0.018863[/C][C]-0.1623[/C][C]0.435769[/C][/ROW]
[ROW][C]46[/C][C]-0.034087[/C][C]-0.2932[/C][C]0.385086[/C][/ROW]
[ROW][C]47[/C][C]0.035888[/C][C]0.3087[/C][C]0.379201[/C][/ROW]
[ROW][C]48[/C][C]0.05931[/C][C]0.5102[/C][C]0.305715[/C][/ROW]
[/TABLE]
Source: https://freestatistics.org/blog/index.php?pk=39919&T=1

Globally Unique Identifier (entire table): ba.freestatistics.org/blog/index.php?pk=39919&T=1

As an alternative you can also use a QR Code:  

The GUIDs for individual cells are displayed in the table below:

Autocorrelation Function
Time lag kACF(k)T-STATP-value
10.2328232.00280.02443
2-0.056846-0.4890.313143
3-0.389408-3.34980.000638
4-0.17043-1.46610.07343
5-0.015035-0.12930.448722
6-0.118222-1.0170.156237
7-0.016269-0.140.44454
8-0.152507-1.31190.096803
9-0.276042-2.37460.010081
100.0046040.03960.484256
110.2166121.86340.033189
120.6978526.00320
130.228931.96930.026329
14-0.097047-0.83480.20325
15-0.374416-3.22080.00095
16-0.168832-1.45230.075316
170.0145640.12530.450318
18-0.047545-0.4090.34186
19-0.016727-0.14390.442988
20-0.056731-0.4880.313489
21-0.123455-1.0620.145845
22-0.062918-0.54120.294984
230.1393631.19880.117207
240.4381753.76930.000163
250.1500691.29090.100371
26-0.082069-0.7060.241207
27-0.283382-2.43770.00859
28-0.128592-1.10620.136114
290.0051790.04460.482292
300.038880.33450.369491
310.0349920.3010.382124
32-0.078968-0.67930.249531
33-0.064102-0.55140.291501
34-0.025385-0.21840.413871
350.0722380.62140.268119
360.1980021.70330.046357
370.0576610.4960.310675
38-0.06053-0.52070.302066
39-0.174627-1.50220.068651
40-0.037784-0.3250.373038
410.0358320.30820.379382
420.0291970.25120.401193
430.0161520.13890.444937
44-0.038734-0.33320.369963
45-0.018863-0.16230.435769
46-0.034087-0.29320.385086
470.0358880.30870.379201
480.059310.51020.305715


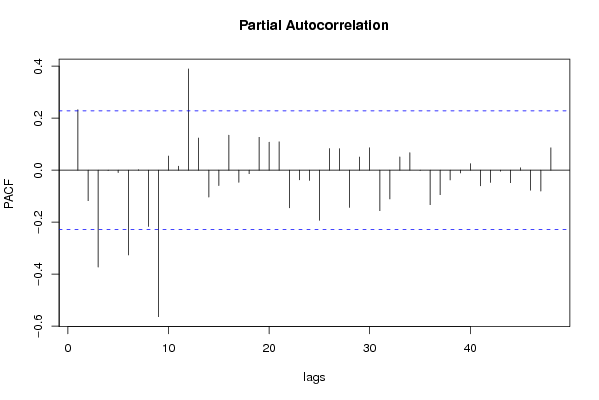
Partial Autocorrelation Function
Time lag kPACF(k)T-STATP-value
10.2328232.00280.02443
2-0.117417-1.01010.15788
3-0.372319-3.20280.001004
4-0.000783-0.00670.497322
5-0.008935-0.07690.46947
6-0.32598-2.80420.003219
70.0017420.0150.494042
8-0.216169-1.85960.033462
9-0.563245-4.84523e-06
100.0547060.47060.319655
110.0156460.13460.446651
120.3895683.35120.000635
130.123541.06270.14568
14-0.103474-0.89010.188144
15-0.059172-0.5090.306128
160.1348171.15970.124941
17-0.046393-0.39910.345489
18-0.013464-0.11580.454055
190.1265941.0890.139843
200.107750.92690.178496
210.1092250.93960.175243
22-0.144512-1.24310.10887
23-0.036856-0.3170.376052
24-0.039532-0.34010.367383
25-0.192664-1.65740.050841
260.083190.71560.238236
270.082860.71280.239108
28-0.143058-1.23060.111179
290.0504870.43430.332666
300.0861280.74090.23055
31-0.1559-1.34110.091995
32-0.110332-0.94910.172826
330.0511520.440.330599
340.0675980.58150.281335
35-0.000669-0.00580.497712
36-0.132629-1.14090.128792
37-0.094142-0.80980.210315
38-0.037402-0.32170.374277
39-0.010408-0.08950.464451
400.0253250.21790.414071
41-0.059918-0.51540.303892
42-0.046987-0.40420.343615
43-0.003707-0.03190.487325
44-0.047927-0.41230.340662
450.0094440.08120.467735
46-0.076601-0.65890.255989
47-0.08-0.68820.246743
480.0862940.74230.230118

\begin{tabular}{lllllllll}
\hline
Partial Autocorrelation Function \tabularnewline
Time lag k & PACF(k) & T-STAT & P-value \tabularnewline
1 & 0.232823 & 2.0028 & 0.02443 \tabularnewline
2 & -0.117417 & -1.0101 & 0.15788 \tabularnewline
3 & -0.372319 & -3.2028 & 0.001004 \tabularnewline
4 & -0.000783 & -0.0067 & 0.497322 \tabularnewline
5 & -0.008935 & -0.0769 & 0.46947 \tabularnewline
6 & -0.32598 & -2.8042 & 0.003219 \tabularnewline
7 & 0.001742 & 0.015 & 0.494042 \tabularnewline
8 & -0.216169 & -1.8596 & 0.033462 \tabularnewline
9 & -0.563245 & -4.8452 & 3e-06 \tabularnewline
10 & 0.054706 & 0.4706 & 0.319655 \tabularnewline
11 & 0.015646 & 0.1346 & 0.446651 \tabularnewline
12 & 0.389568 & 3.3512 & 0.000635 \tabularnewline
13 & 0.12354 & 1.0627 & 0.14568 \tabularnewline
14 & -0.103474 & -0.8901 & 0.188144 \tabularnewline
15 & -0.059172 & -0.509 & 0.306128 \tabularnewline
16 & 0.134817 & 1.1597 & 0.124941 \tabularnewline
17 & -0.046393 & -0.3991 & 0.345489 \tabularnewline
18 & -0.013464 & -0.1158 & 0.454055 \tabularnewline
19 & 0.126594 & 1.089 & 0.139843 \tabularnewline
20 & 0.10775 & 0.9269 & 0.178496 \tabularnewline
21 & 0.109225 & 0.9396 & 0.175243 \tabularnewline
22 & -0.144512 & -1.2431 & 0.10887 \tabularnewline
23 & -0.036856 & -0.317 & 0.376052 \tabularnewline
24 & -0.039532 & -0.3401 & 0.367383 \tabularnewline
25 & -0.192664 & -1.6574 & 0.050841 \tabularnewline
26 & 0.08319 & 0.7156 & 0.238236 \tabularnewline
27 & 0.08286 & 0.7128 & 0.239108 \tabularnewline
28 & -0.143058 & -1.2306 & 0.111179 \tabularnewline
29 & 0.050487 & 0.4343 & 0.332666 \tabularnewline
30 & 0.086128 & 0.7409 & 0.23055 \tabularnewline
31 & -0.1559 & -1.3411 & 0.091995 \tabularnewline
32 & -0.110332 & -0.9491 & 0.172826 \tabularnewline
33 & 0.051152 & 0.44 & 0.330599 \tabularnewline
34 & 0.067598 & 0.5815 & 0.281335 \tabularnewline
35 & -0.000669 & -0.0058 & 0.497712 \tabularnewline
36 & -0.132629 & -1.1409 & 0.128792 \tabularnewline
37 & -0.094142 & -0.8098 & 0.210315 \tabularnewline
38 & -0.037402 & -0.3217 & 0.374277 \tabularnewline
39 & -0.010408 & -0.0895 & 0.464451 \tabularnewline
40 & 0.025325 & 0.2179 & 0.414071 \tabularnewline
41 & -0.059918 & -0.5154 & 0.303892 \tabularnewline
42 & -0.046987 & -0.4042 & 0.343615 \tabularnewline
43 & -0.003707 & -0.0319 & 0.487325 \tabularnewline
44 & -0.047927 & -0.4123 & 0.340662 \tabularnewline
45 & 0.009444 & 0.0812 & 0.467735 \tabularnewline
46 & -0.076601 & -0.6589 & 0.255989 \tabularnewline
47 & -0.08 & -0.6882 & 0.246743 \tabularnewline
48 & 0.086294 & 0.7423 & 0.230118 \tabularnewline
\hline
\end{tabular}
%Source: https://freestatistics.org/blog/index.php?pk=39919&T=2

[TABLE]
[ROW][C]Partial Autocorrelation Function[/C][/ROW]
[ROW][C]Time lag k[/C][C]PACF(k)[/C][C]T-STAT[/C][C]P-value[/C][/ROW]
[ROW][C]1[/C][C]0.232823[/C][C]2.0028[/C][C]0.02443[/C][/ROW]
[ROW][C]2[/C][C]-0.117417[/C][C]-1.0101[/C][C]0.15788[/C][/ROW]
[ROW][C]3[/C][C]-0.372319[/C][C]-3.2028[/C][C]0.001004[/C][/ROW]
[ROW][C]4[/C][C]-0.000783[/C][C]-0.0067[/C][C]0.497322[/C][/ROW]
[ROW][C]5[/C][C]-0.008935[/C][C]-0.0769[/C][C]0.46947[/C][/ROW]
[ROW][C]6[/C][C]-0.32598[/C][C]-2.8042[/C][C]0.003219[/C][/ROW]
[ROW][C]7[/C][C]0.001742[/C][C]0.015[/C][C]0.494042[/C][/ROW]
[ROW][C]8[/C][C]-0.216169[/C][C]-1.8596[/C][C]0.033462[/C][/ROW]
[ROW][C]9[/C][C]-0.563245[/C][C]-4.8452[/C][C]3e-06[/C][/ROW]
[ROW][C]10[/C][C]0.054706[/C][C]0.4706[/C][C]0.319655[/C][/ROW]
[ROW][C]11[/C][C]0.015646[/C][C]0.1346[/C][C]0.446651[/C][/ROW]
[ROW][C]12[/C][C]0.389568[/C][C]3.3512[/C][C]0.000635[/C][/ROW]
[ROW][C]13[/C][C]0.12354[/C][C]1.0627[/C][C]0.14568[/C][/ROW]
[ROW][C]14[/C][C]-0.103474[/C][C]-0.8901[/C][C]0.188144[/C][/ROW]
[ROW][C]15[/C][C]-0.059172[/C][C]-0.509[/C][C]0.306128[/C][/ROW]
[ROW][C]16[/C][C]0.134817[/C][C]1.1597[/C][C]0.124941[/C][/ROW]
[ROW][C]17[/C][C]-0.046393[/C][C]-0.3991[/C][C]0.345489[/C][/ROW]
[ROW][C]18[/C][C]-0.013464[/C][C]-0.1158[/C][C]0.454055[/C][/ROW]
[ROW][C]19[/C][C]0.126594[/C][C]1.089[/C][C]0.139843[/C][/ROW]
[ROW][C]20[/C][C]0.10775[/C][C]0.9269[/C][C]0.178496[/C][/ROW]
[ROW][C]21[/C][C]0.109225[/C][C]0.9396[/C][C]0.175243[/C][/ROW]
[ROW][C]22[/C][C]-0.144512[/C][C]-1.2431[/C][C]0.10887[/C][/ROW]
[ROW][C]23[/C][C]-0.036856[/C][C]-0.317[/C][C]0.376052[/C][/ROW]
[ROW][C]24[/C][C]-0.039532[/C][C]-0.3401[/C][C]0.367383[/C][/ROW]
[ROW][C]25[/C][C]-0.192664[/C][C]-1.6574[/C][C]0.050841[/C][/ROW]
[ROW][C]26[/C][C]0.08319[/C][C]0.7156[/C][C]0.238236[/C][/ROW]
[ROW][C]27[/C][C]0.08286[/C][C]0.7128[/C][C]0.239108[/C][/ROW]
[ROW][C]28[/C][C]-0.143058[/C][C]-1.2306[/C][C]0.111179[/C][/ROW]
[ROW][C]29[/C][C]0.050487[/C][C]0.4343[/C][C]0.332666[/C][/ROW]
[ROW][C]30[/C][C]0.086128[/C][C]0.7409[/C][C]0.23055[/C][/ROW]
[ROW][C]31[/C][C]-0.1559[/C][C]-1.3411[/C][C]0.091995[/C][/ROW]
[ROW][C]32[/C][C]-0.110332[/C][C]-0.9491[/C][C]0.172826[/C][/ROW]
[ROW][C]33[/C][C]0.051152[/C][C]0.44[/C][C]0.330599[/C][/ROW]
[ROW][C]34[/C][C]0.067598[/C][C]0.5815[/C][C]0.281335[/C][/ROW]
[ROW][C]35[/C][C]-0.000669[/C][C]-0.0058[/C][C]0.497712[/C][/ROW]
[ROW][C]36[/C][C]-0.132629[/C][C]-1.1409[/C][C]0.128792[/C][/ROW]
[ROW][C]37[/C][C]-0.094142[/C][C]-0.8098[/C][C]0.210315[/C][/ROW]
[ROW][C]38[/C][C]-0.037402[/C][C]-0.3217[/C][C]0.374277[/C][/ROW]
[ROW][C]39[/C][C]-0.010408[/C][C]-0.0895[/C][C]0.464451[/C][/ROW]
[ROW][C]40[/C][C]0.025325[/C][C]0.2179[/C][C]0.414071[/C][/ROW]
[ROW][C]41[/C][C]-0.059918[/C][C]-0.5154[/C][C]0.303892[/C][/ROW]
[ROW][C]42[/C][C]-0.046987[/C][C]-0.4042[/C][C]0.343615[/C][/ROW]
[ROW][C]43[/C][C]-0.003707[/C][C]-0.0319[/C][C]0.487325[/C][/ROW]
[ROW][C]44[/C][C]-0.047927[/C][C]-0.4123[/C][C]0.340662[/C][/ROW]
[ROW][C]45[/C][C]0.009444[/C][C]0.0812[/C][C]0.467735[/C][/ROW]
[ROW][C]46[/C][C]-0.076601[/C][C]-0.6589[/C][C]0.255989[/C][/ROW]
[ROW][C]47[/C][C]-0.08[/C][C]-0.6882[/C][C]0.246743[/C][/ROW]
[ROW][C]48[/C][C]0.086294[/C][C]0.7423[/C][C]0.230118[/C][/ROW]
[/TABLE]
Source: https://freestatistics.org/blog/index.php?pk=39919&T=2

Globally Unique Identifier (entire table): ba.freestatistics.org/blog/index.php?pk=39919&T=2

As an alternative you can also use a QR Code:  

The GUIDs for individual cells are displayed in the table below:

Partial Autocorrelation Function
Time lag kPACF(k)T-STATP-value
10.2328232.00280.02443
2-0.117417-1.01010.15788
3-0.372319-3.20280.001004
4-0.000783-0.00670.497322
5-0.008935-0.07690.46947
6-0.32598-2.80420.003219
70.0017420.0150.494042
8-0.216169-1.85960.033462
9-0.563245-4.84523e-06
100.0547060.47060.319655
110.0156460.13460.446651
120.3895683.35120.000635
130.123541.06270.14568
14-0.103474-0.89010.188144
15-0.059172-0.5090.306128
160.1348171.15970.124941
17-0.046393-0.39910.345489
18-0.013464-0.11580.454055
190.1265941.0890.139843
200.107750.92690.178496
210.1092250.93960.175243
22-0.144512-1.24310.10887
23-0.036856-0.3170.376052
24-0.039532-0.34010.367383
25-0.192664-1.65740.050841
260.083190.71560.238236
270.082860.71280.239108
28-0.143058-1.23060.111179
290.0504870.43430.332666
300.0861280.74090.23055
31-0.1559-1.34110.091995
32-0.110332-0.94910.172826
330.0511520.440.330599
340.0675980.58150.281335
35-0.000669-0.00580.497712
36-0.132629-1.14090.128792
37-0.094142-0.80980.210315
38-0.037402-0.32170.374277
39-0.010408-0.08950.464451
400.0253250.21790.414071
41-0.059918-0.51540.303892
42-0.046987-0.40420.343615
43-0.003707-0.03190.487325
44-0.047927-0.41230.340662
450.0094440.08120.467735
46-0.076601-0.65890.255989
47-0.08-0.68820.246743
480.0862940.74230.230118


Parameters (Session):
par1 = 48 ; par2 = 1 ; par3 = 1 ; par4 = 0 ; par5 = 12 ;
Parameters (R input):
par1 = 48 ; par2 = 1 ; par3 = 1 ; par4 = 0 ; par5 = 12 ;
R code (references can be found in the software module):
if (par1 == 'Default') {
par1 = 10*log10(length(x))
} else {
par1 <- as.numeric(par1)
}
par2 <- as.numeric(par2)
par3 <- as.numeric(par3)
par4 <- as.numeric(par4)
par5 <- as.numeric(par5)
if (par2 == 0) {
x <- log(x)
} else {
x <- (x ^ par2 - 1) / par2
}
if (par3 > 0) x <- diff(x,lag=1,difference=par3)
if (par4 > 0) x <- diff(x,lag=par5,difference=par4)
bitmap(file='pic1.png')
racf <- acf(x,par1,main='Autocorrelation',xlab='lags',ylab='ACF')
dev.off()
bitmap(file='pic2.png')
rpacf <- pacf(x,par1,main='Partial Autocorrelation',xlab='lags',ylab='PACF')
dev.off()
(myacf <- c(racf$acf))
(mypacf <- c(rpacf$acf))
lengthx <- length(x)
sqrtn <- sqrt(lengthx)
load(file='createtable')
a<-table.start()
a<-table.row.start(a)
a<-table.element(a,'Autocorrelation Function',4,TRUE)
a<-table.row.end(a)
a<-table.row.start(a)
a<-table.element(a,'Time lag k',header=TRUE)
a<-table.element(a,hyperlink('basics.htm','ACF(k)','click here for more information about the Autocorrelation Function'),header=TRUE)
a<-table.element(a,'T-STAT',header=TRUE)
a<-table.element(a,'P-value',header=TRUE)
a<-table.row.end(a)
for (i in 2:(par1+1)) {
a<-table.row.start(a)
a<-table.element(a,i-1,header=TRUE)
a<-table.element(a,round(myacf[i],6))
mytstat <- myacf[i]*sqrtn
a<-table.element(a,round(mytstat,4))
a<-table.element(a,round(1-pt(abs(mytstat),lengthx),6))
a<-table.row.end(a)
}
a<-table.end(a)
table.save(a,file='mytable.tab')
a<-table.start()
a<-table.row.start(a)
a<-table.element(a,'Partial Autocorrelation Function',4,TRUE)
a<-table.row.end(a)
a<-table.row.start(a)
a<-table.element(a,'Time lag k',header=TRUE)
a<-table.element(a,hyperlink('basics.htm','PACF(k)','click here for more information about the Partial Autocorrelation Function'),header=TRUE)
a<-table.element(a,'T-STAT',header=TRUE)
a<-table.element(a,'P-value',header=TRUE)
a<-table.row.end(a)
for (i in 1:par1) {
a<-table.row.start(a)
a<-table.element(a,i,header=TRUE)
a<-table.element(a,round(mypacf[i],6))
mytstat <- mypacf[i]*sqrtn
a<-table.element(a,round(mytstat,4))
a<-table.element(a,round(1-pt(abs(mytstat),lengthx),6))
a<-table.row.end(a)
}
a<-table.end(a)
table.save(a,file='mytable1.tab')