Free Statistics

of Irreproducible Research!

Author's title

Autocorrelatiefunctie - Omzetcijfers Carrefour Burcht - Jeroen Van Eeckhove...

Author*Unverified author*
R Software Modulerwasp_autocorrelation.wasp
Title produced by software(Partial) Autocorrelation Function
Date of computationWed, 13 May 2009 00:32:44 -0600
Cite this page as followsStatistical Computations at FreeStatistics.org, Office for Research Development and Education, URL https://freestatistics.org/blog/index.php?v=date/2009/May/13/t1242196557khikbw1zv6re00a.htm/, Retrieved Wed, 08 May 2024 12:50:04 +0000
Statistical Computations at FreeStatistics.org, Office for Research Development and Education, URL https://freestatistics.org/blog/index.php?pk=39778, Retrieved Wed, 08 May 2024 12:50:04 +0000
QR Codes:

Original text written by user:
IsPrivate?No (this computation is public)
User-defined keywords
Estimated Impact157
Family? (F = Feedback message, R = changed R code, M = changed R Module, P = changed Parameters, D = changed Data)
-     [Kernel Density Estimation] [dichtheidsgrafiek...] [2009-02-18 14:18:56] [92e5d5bf28178acf91a63035e9cc5b92]
- RMPD    [(Partial) Autocorrelation Function] [Autocorrelatiefun...] [2009-05-13 06:32:44] [13980c6c3342d2be2ef42581b409ab4a] [Current]
Feedback Forum

Post a new message
Dataseries X:
2291180
1971664
2193270
2197733
2345324
2195121
2170583
2241521
2154945
2912568
2392562
3336621
4080642
3735329
4018383
4171360
3855698
4101316
4199346
3959646
3960841
4784025
4105467
5929558
4048642
3828808
4268127
4171816
4004783
4295447
3968177
3918480
4040260
4530715
4103330
6025506
4632308
4133863
4519182
4151573
4486595
4504699
4180443
4222193
4373727
4734738
4403232
5903985
4414074
4061816
4504697
3994176
4114925
4485120
4171230
4476075
4179369
4823185
4585751
6110454
4279575
3782118
4098678
4065616
4413733
4481214
4345018
4294488
4361269
4535031
4318397
6040168


Summary of computational transaction
Raw Inputview raw input (R code)
Raw Outputview raw output of R engine
Computing time1 seconds
R Server'Gwilym Jenkins' @ 72.249.127.135

\begin{tabular}{lllllllll}
\hline
Summary of computational transaction \tabularnewline
Raw Input & view raw input (R code)  \tabularnewline
Raw Output & view raw output of R engine  \tabularnewline
Computing time & 1 seconds \tabularnewline
R Server & 'Gwilym Jenkins' @ 72.249.127.135 \tabularnewline
\hline
\end{tabular}
%Source: https://freestatistics.org/blog/index.php?pk=39778&T=0

[TABLE]
[ROW][C]Summary of computational transaction[/C][/ROW]
[ROW][C]Raw Input[/C][C]view raw input (R code) [/C][/ROW]
[ROW][C]Raw Output[/C][C]view raw output of R engine [/C][/ROW]
[ROW][C]Computing time[/C][C]1 seconds[/C][/ROW]
[ROW][C]R Server[/C][C]'Gwilym Jenkins' @ 72.249.127.135[/C][/ROW]
[/TABLE]
Source: https://freestatistics.org/blog/index.php?pk=39778&T=0

Globally Unique Identifier (entire table): ba.freestatistics.org/blog/index.php?pk=39778&T=0

As an alternative you can also use a QR Code:  

The GUIDs for individual cells are displayed in the table below:

Summary of computational transaction
Raw Inputview raw input (R code)
Raw Outputview raw output of R engine
Computing time1 seconds
R Server'Gwilym Jenkins' @ 72.249.127.135


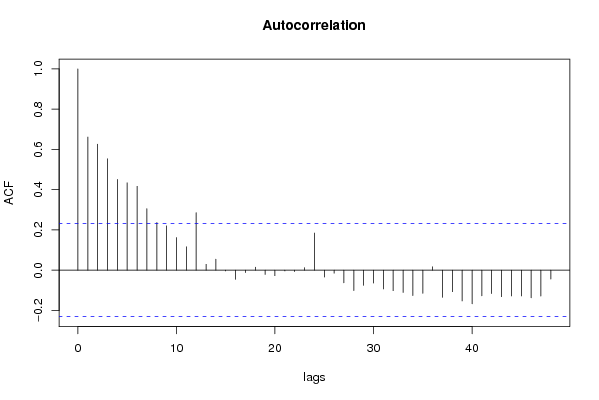
Autocorrelation Function
Time lag kACF(k)T-STATP-value
10.6615095.61310
20.6263355.31461e-06
30.5533614.69546e-06
40.4508973.8260.000137
50.4344393.68630.000219
60.4166223.53520.000358
70.3054992.59220.00577
80.2368912.01010.024085
90.2201581.86810.032908
100.1618861.37360.086907
110.1160630.98480.164003
120.2856992.42420.008926
130.0290920.24690.402861
140.0548680.46560.321465
15-0.003579-0.03040.487928
16-0.045671-0.38750.349752
17-0.012152-0.10310.459081
180.0146670.12450.45065
19-0.020969-0.17790.429641
20-0.027125-0.23020.409309
21-0.00355-0.03010.488027
22-0.007215-0.06120.475676
230.0125650.10660.457695
240.1845021.56560.060919
25-0.034271-0.29080.38602
26-0.014935-0.12670.449755
27-0.062657-0.53170.298299
28-0.101339-0.85990.196352
29-0.075356-0.63940.26229
30-0.064116-0.5440.294048
31-0.093557-0.79390.214943
32-0.102081-0.86620.194632
33-0.110862-0.94070.175003
34-0.126145-1.07040.144013
35-0.115076-0.97650.166054
360.0168210.14270.443451
37-0.134676-1.14280.128461
38-0.106694-0.90530.184155
39-0.152995-1.29820.09918
40-0.167329-1.41980.079985
41-0.127148-1.07890.142119
42-0.116453-0.98810.163197
43-0.132076-1.12070.133069
44-0.127966-1.08580.140588
45-0.127835-1.08470.140833
46-0.137075-1.16310.124311
47-0.128954-1.09420.138754
48-0.043954-0.3730.355136

\begin{tabular}{lllllllll}
\hline
Autocorrelation Function \tabularnewline
Time lag k & ACF(k) & T-STAT & P-value \tabularnewline
1 & 0.661509 & 5.6131 & 0 \tabularnewline
2 & 0.626335 & 5.3146 & 1e-06 \tabularnewline
3 & 0.553361 & 4.6954 & 6e-06 \tabularnewline
4 & 0.450897 & 3.826 & 0.000137 \tabularnewline
5 & 0.434439 & 3.6863 & 0.000219 \tabularnewline
6 & 0.416622 & 3.5352 & 0.000358 \tabularnewline
7 & 0.305499 & 2.5922 & 0.00577 \tabularnewline
8 & 0.236891 & 2.0101 & 0.024085 \tabularnewline
9 & 0.220158 & 1.8681 & 0.032908 \tabularnewline
10 & 0.161886 & 1.3736 & 0.086907 \tabularnewline
11 & 0.116063 & 0.9848 & 0.164003 \tabularnewline
12 & 0.285699 & 2.4242 & 0.008926 \tabularnewline
13 & 0.029092 & 0.2469 & 0.402861 \tabularnewline
14 & 0.054868 & 0.4656 & 0.321465 \tabularnewline
15 & -0.003579 & -0.0304 & 0.487928 \tabularnewline
16 & -0.045671 & -0.3875 & 0.349752 \tabularnewline
17 & -0.012152 & -0.1031 & 0.459081 \tabularnewline
18 & 0.014667 & 0.1245 & 0.45065 \tabularnewline
19 & -0.020969 & -0.1779 & 0.429641 \tabularnewline
20 & -0.027125 & -0.2302 & 0.409309 \tabularnewline
21 & -0.00355 & -0.0301 & 0.488027 \tabularnewline
22 & -0.007215 & -0.0612 & 0.475676 \tabularnewline
23 & 0.012565 & 0.1066 & 0.457695 \tabularnewline
24 & 0.184502 & 1.5656 & 0.060919 \tabularnewline
25 & -0.034271 & -0.2908 & 0.38602 \tabularnewline
26 & -0.014935 & -0.1267 & 0.449755 \tabularnewline
27 & -0.062657 & -0.5317 & 0.298299 \tabularnewline
28 & -0.101339 & -0.8599 & 0.196352 \tabularnewline
29 & -0.075356 & -0.6394 & 0.26229 \tabularnewline
30 & -0.064116 & -0.544 & 0.294048 \tabularnewline
31 & -0.093557 & -0.7939 & 0.214943 \tabularnewline
32 & -0.102081 & -0.8662 & 0.194632 \tabularnewline
33 & -0.110862 & -0.9407 & 0.175003 \tabularnewline
34 & -0.126145 & -1.0704 & 0.144013 \tabularnewline
35 & -0.115076 & -0.9765 & 0.166054 \tabularnewline
36 & 0.016821 & 0.1427 & 0.443451 \tabularnewline
37 & -0.134676 & -1.1428 & 0.128461 \tabularnewline
38 & -0.106694 & -0.9053 & 0.184155 \tabularnewline
39 & -0.152995 & -1.2982 & 0.09918 \tabularnewline
40 & -0.167329 & -1.4198 & 0.079985 \tabularnewline
41 & -0.127148 & -1.0789 & 0.142119 \tabularnewline
42 & -0.116453 & -0.9881 & 0.163197 \tabularnewline
43 & -0.132076 & -1.1207 & 0.133069 \tabularnewline
44 & -0.127966 & -1.0858 & 0.140588 \tabularnewline
45 & -0.127835 & -1.0847 & 0.140833 \tabularnewline
46 & -0.137075 & -1.1631 & 0.124311 \tabularnewline
47 & -0.128954 & -1.0942 & 0.138754 \tabularnewline
48 & -0.043954 & -0.373 & 0.355136 \tabularnewline
\hline
\end{tabular}
%Source: https://freestatistics.org/blog/index.php?pk=39778&T=1

[TABLE]
[ROW][C]Autocorrelation Function[/C][/ROW]
[ROW][C]Time lag k[/C][C]ACF(k)[/C][C]T-STAT[/C][C]P-value[/C][/ROW]
[ROW][C]1[/C][C]0.661509[/C][C]5.6131[/C][C]0[/C][/ROW]
[ROW][C]2[/C][C]0.626335[/C][C]5.3146[/C][C]1e-06[/C][/ROW]
[ROW][C]3[/C][C]0.553361[/C][C]4.6954[/C][C]6e-06[/C][/ROW]
[ROW][C]4[/C][C]0.450897[/C][C]3.826[/C][C]0.000137[/C][/ROW]
[ROW][C]5[/C][C]0.434439[/C][C]3.6863[/C][C]0.000219[/C][/ROW]
[ROW][C]6[/C][C]0.416622[/C][C]3.5352[/C][C]0.000358[/C][/ROW]
[ROW][C]7[/C][C]0.305499[/C][C]2.5922[/C][C]0.00577[/C][/ROW]
[ROW][C]8[/C][C]0.236891[/C][C]2.0101[/C][C]0.024085[/C][/ROW]
[ROW][C]9[/C][C]0.220158[/C][C]1.8681[/C][C]0.032908[/C][/ROW]
[ROW][C]10[/C][C]0.161886[/C][C]1.3736[/C][C]0.086907[/C][/ROW]
[ROW][C]11[/C][C]0.116063[/C][C]0.9848[/C][C]0.164003[/C][/ROW]
[ROW][C]12[/C][C]0.285699[/C][C]2.4242[/C][C]0.008926[/C][/ROW]
[ROW][C]13[/C][C]0.029092[/C][C]0.2469[/C][C]0.402861[/C][/ROW]
[ROW][C]14[/C][C]0.054868[/C][C]0.4656[/C][C]0.321465[/C][/ROW]
[ROW][C]15[/C][C]-0.003579[/C][C]-0.0304[/C][C]0.487928[/C][/ROW]
[ROW][C]16[/C][C]-0.045671[/C][C]-0.3875[/C][C]0.349752[/C][/ROW]
[ROW][C]17[/C][C]-0.012152[/C][C]-0.1031[/C][C]0.459081[/C][/ROW]
[ROW][C]18[/C][C]0.014667[/C][C]0.1245[/C][C]0.45065[/C][/ROW]
[ROW][C]19[/C][C]-0.020969[/C][C]-0.1779[/C][C]0.429641[/C][/ROW]
[ROW][C]20[/C][C]-0.027125[/C][C]-0.2302[/C][C]0.409309[/C][/ROW]
[ROW][C]21[/C][C]-0.00355[/C][C]-0.0301[/C][C]0.488027[/C][/ROW]
[ROW][C]22[/C][C]-0.007215[/C][C]-0.0612[/C][C]0.475676[/C][/ROW]
[ROW][C]23[/C][C]0.012565[/C][C]0.1066[/C][C]0.457695[/C][/ROW]
[ROW][C]24[/C][C]0.184502[/C][C]1.5656[/C][C]0.060919[/C][/ROW]
[ROW][C]25[/C][C]-0.034271[/C][C]-0.2908[/C][C]0.38602[/C][/ROW]
[ROW][C]26[/C][C]-0.014935[/C][C]-0.1267[/C][C]0.449755[/C][/ROW]
[ROW][C]27[/C][C]-0.062657[/C][C]-0.5317[/C][C]0.298299[/C][/ROW]
[ROW][C]28[/C][C]-0.101339[/C][C]-0.8599[/C][C]0.196352[/C][/ROW]
[ROW][C]29[/C][C]-0.075356[/C][C]-0.6394[/C][C]0.26229[/C][/ROW]
[ROW][C]30[/C][C]-0.064116[/C][C]-0.544[/C][C]0.294048[/C][/ROW]
[ROW][C]31[/C][C]-0.093557[/C][C]-0.7939[/C][C]0.214943[/C][/ROW]
[ROW][C]32[/C][C]-0.102081[/C][C]-0.8662[/C][C]0.194632[/C][/ROW]
[ROW][C]33[/C][C]-0.110862[/C][C]-0.9407[/C][C]0.175003[/C][/ROW]
[ROW][C]34[/C][C]-0.126145[/C][C]-1.0704[/C][C]0.144013[/C][/ROW]
[ROW][C]35[/C][C]-0.115076[/C][C]-0.9765[/C][C]0.166054[/C][/ROW]
[ROW][C]36[/C][C]0.016821[/C][C]0.1427[/C][C]0.443451[/C][/ROW]
[ROW][C]37[/C][C]-0.134676[/C][C]-1.1428[/C][C]0.128461[/C][/ROW]
[ROW][C]38[/C][C]-0.106694[/C][C]-0.9053[/C][C]0.184155[/C][/ROW]
[ROW][C]39[/C][C]-0.152995[/C][C]-1.2982[/C][C]0.09918[/C][/ROW]
[ROW][C]40[/C][C]-0.167329[/C][C]-1.4198[/C][C]0.079985[/C][/ROW]
[ROW][C]41[/C][C]-0.127148[/C][C]-1.0789[/C][C]0.142119[/C][/ROW]
[ROW][C]42[/C][C]-0.116453[/C][C]-0.9881[/C][C]0.163197[/C][/ROW]
[ROW][C]43[/C][C]-0.132076[/C][C]-1.1207[/C][C]0.133069[/C][/ROW]
[ROW][C]44[/C][C]-0.127966[/C][C]-1.0858[/C][C]0.140588[/C][/ROW]
[ROW][C]45[/C][C]-0.127835[/C][C]-1.0847[/C][C]0.140833[/C][/ROW]
[ROW][C]46[/C][C]-0.137075[/C][C]-1.1631[/C][C]0.124311[/C][/ROW]
[ROW][C]47[/C][C]-0.128954[/C][C]-1.0942[/C][C]0.138754[/C][/ROW]
[ROW][C]48[/C][C]-0.043954[/C][C]-0.373[/C][C]0.355136[/C][/ROW]
[/TABLE]
Source: https://freestatistics.org/blog/index.php?pk=39778&T=1

Globally Unique Identifier (entire table): ba.freestatistics.org/blog/index.php?pk=39778&T=1

As an alternative you can also use a QR Code:  

The GUIDs for individual cells are displayed in the table below:

Autocorrelation Function
Time lag kACF(k)T-STATP-value
10.6615095.61310
20.6263355.31461e-06
30.5533614.69546e-06
40.4508973.8260.000137
50.4344393.68630.000219
60.4166223.53520.000358
70.3054992.59220.00577
80.2368912.01010.024085
90.2201581.86810.032908
100.1618861.37360.086907
110.1160630.98480.164003
120.2856992.42420.008926
130.0290920.24690.402861
140.0548680.46560.321465
15-0.003579-0.03040.487928
16-0.045671-0.38750.349752
17-0.012152-0.10310.459081
180.0146670.12450.45065
19-0.020969-0.17790.429641
20-0.027125-0.23020.409309
21-0.00355-0.03010.488027
22-0.007215-0.06120.475676
230.0125650.10660.457695
240.1845021.56560.060919
25-0.034271-0.29080.38602
26-0.014935-0.12670.449755
27-0.062657-0.53170.298299
28-0.101339-0.85990.196352
29-0.075356-0.63940.26229
30-0.064116-0.5440.294048
31-0.093557-0.79390.214943
32-0.102081-0.86620.194632
33-0.110862-0.94070.175003
34-0.126145-1.07040.144013
35-0.115076-0.97650.166054
360.0168210.14270.443451
37-0.134676-1.14280.128461
38-0.106694-0.90530.184155
39-0.152995-1.29820.09918
40-0.167329-1.41980.079985
41-0.127148-1.07890.142119
42-0.116453-0.98810.163197
43-0.132076-1.12070.133069
44-0.127966-1.08580.140588
45-0.127835-1.08470.140833
46-0.137075-1.16310.124311
47-0.128954-1.09420.138754
48-0.043954-0.3730.355136


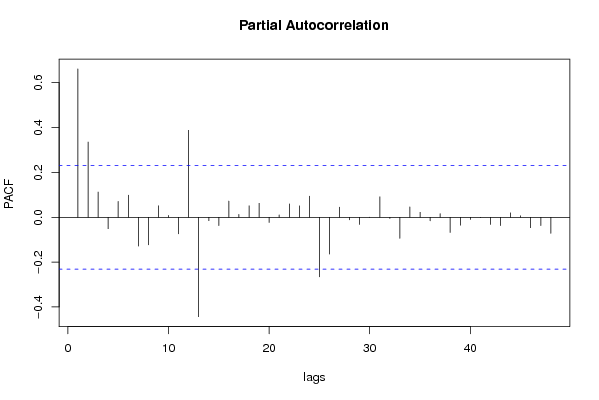
Partial Autocorrelation Function
Time lag kPACF(k)T-STATP-value
10.6615095.61310
20.3355942.84760.002868
30.1123740.95350.171758
4-0.050813-0.43120.333818
50.0706310.59930.275419
60.0982590.83380.203588
7-0.128565-1.09090.139474
8-0.122717-1.04130.150613
90.0511270.43380.332856
100.0083710.0710.471785
11-0.073835-0.62650.26648
120.3877833.29040.000775
13-0.443225-3.76090.000171
14-0.01548-0.13140.447932
15-0.036951-0.31350.377389
160.0720320.61120.271491
170.0128790.10930.456643
180.0513010.43530.332321
190.0624510.52990.298901
20-0.023269-0.19740.422018
210.010450.08870.464793
220.0593720.50380.307974
230.0508360.43140.333748
240.0942260.79950.213305
25-0.26577-2.25510.013583
26-0.164336-1.39440.083737
270.0449240.38120.35209
28-0.01121-0.09510.462243
29-0.032088-0.27230.393095
305.2e-054e-040.499823
310.0910980.7730.221029
32-0.005325-0.04520.482041
33-0.093845-0.79630.214238
340.0462910.39280.347817
350.0220420.1870.426081
36-0.015644-0.13270.447384
370.0157890.1340.446898
38-0.067396-0.57190.284594
39-0.035325-0.29970.38262
40-0.009782-0.0830.467039
41-0.001354-0.01150.495434
42-0.03223-0.27350.392635
43-0.037103-0.31480.3769
440.0196240.16650.43411
450.006380.05410.478488
46-0.046524-0.39480.347089
47-0.036721-0.31160.378127
48-0.071595-0.60750.272714

\begin{tabular}{lllllllll}
\hline
Partial Autocorrelation Function \tabularnewline
Time lag k & PACF(k) & T-STAT & P-value \tabularnewline
1 & 0.661509 & 5.6131 & 0 \tabularnewline
2 & 0.335594 & 2.8476 & 0.002868 \tabularnewline
3 & 0.112374 & 0.9535 & 0.171758 \tabularnewline
4 & -0.050813 & -0.4312 & 0.333818 \tabularnewline
5 & 0.070631 & 0.5993 & 0.275419 \tabularnewline
6 & 0.098259 & 0.8338 & 0.203588 \tabularnewline
7 & -0.128565 & -1.0909 & 0.139474 \tabularnewline
8 & -0.122717 & -1.0413 & 0.150613 \tabularnewline
9 & 0.051127 & 0.4338 & 0.332856 \tabularnewline
10 & 0.008371 & 0.071 & 0.471785 \tabularnewline
11 & -0.073835 & -0.6265 & 0.26648 \tabularnewline
12 & 0.387783 & 3.2904 & 0.000775 \tabularnewline
13 & -0.443225 & -3.7609 & 0.000171 \tabularnewline
14 & -0.01548 & -0.1314 & 0.447932 \tabularnewline
15 & -0.036951 & -0.3135 & 0.377389 \tabularnewline
16 & 0.072032 & 0.6112 & 0.271491 \tabularnewline
17 & 0.012879 & 0.1093 & 0.456643 \tabularnewline
18 & 0.051301 & 0.4353 & 0.332321 \tabularnewline
19 & 0.062451 & 0.5299 & 0.298901 \tabularnewline
20 & -0.023269 & -0.1974 & 0.422018 \tabularnewline
21 & 0.01045 & 0.0887 & 0.464793 \tabularnewline
22 & 0.059372 & 0.5038 & 0.307974 \tabularnewline
23 & 0.050836 & 0.4314 & 0.333748 \tabularnewline
24 & 0.094226 & 0.7995 & 0.213305 \tabularnewline
25 & -0.26577 & -2.2551 & 0.013583 \tabularnewline
26 & -0.164336 & -1.3944 & 0.083737 \tabularnewline
27 & 0.044924 & 0.3812 & 0.35209 \tabularnewline
28 & -0.01121 & -0.0951 & 0.462243 \tabularnewline
29 & -0.032088 & -0.2723 & 0.393095 \tabularnewline
30 & 5.2e-05 & 4e-04 & 0.499823 \tabularnewline
31 & 0.091098 & 0.773 & 0.221029 \tabularnewline
32 & -0.005325 & -0.0452 & 0.482041 \tabularnewline
33 & -0.093845 & -0.7963 & 0.214238 \tabularnewline
34 & 0.046291 & 0.3928 & 0.347817 \tabularnewline
35 & 0.022042 & 0.187 & 0.426081 \tabularnewline
36 & -0.015644 & -0.1327 & 0.447384 \tabularnewline
37 & 0.015789 & 0.134 & 0.446898 \tabularnewline
38 & -0.067396 & -0.5719 & 0.284594 \tabularnewline
39 & -0.035325 & -0.2997 & 0.38262 \tabularnewline
40 & -0.009782 & -0.083 & 0.467039 \tabularnewline
41 & -0.001354 & -0.0115 & 0.495434 \tabularnewline
42 & -0.03223 & -0.2735 & 0.392635 \tabularnewline
43 & -0.037103 & -0.3148 & 0.3769 \tabularnewline
44 & 0.019624 & 0.1665 & 0.43411 \tabularnewline
45 & 0.00638 & 0.0541 & 0.478488 \tabularnewline
46 & -0.046524 & -0.3948 & 0.347089 \tabularnewline
47 & -0.036721 & -0.3116 & 0.378127 \tabularnewline
48 & -0.071595 & -0.6075 & 0.272714 \tabularnewline
\hline
\end{tabular}
%Source: https://freestatistics.org/blog/index.php?pk=39778&T=2

[TABLE]
[ROW][C]Partial Autocorrelation Function[/C][/ROW]
[ROW][C]Time lag k[/C][C]PACF(k)[/C][C]T-STAT[/C][C]P-value[/C][/ROW]
[ROW][C]1[/C][C]0.661509[/C][C]5.6131[/C][C]0[/C][/ROW]
[ROW][C]2[/C][C]0.335594[/C][C]2.8476[/C][C]0.002868[/C][/ROW]
[ROW][C]3[/C][C]0.112374[/C][C]0.9535[/C][C]0.171758[/C][/ROW]
[ROW][C]4[/C][C]-0.050813[/C][C]-0.4312[/C][C]0.333818[/C][/ROW]
[ROW][C]5[/C][C]0.070631[/C][C]0.5993[/C][C]0.275419[/C][/ROW]
[ROW][C]6[/C][C]0.098259[/C][C]0.8338[/C][C]0.203588[/C][/ROW]
[ROW][C]7[/C][C]-0.128565[/C][C]-1.0909[/C][C]0.139474[/C][/ROW]
[ROW][C]8[/C][C]-0.122717[/C][C]-1.0413[/C][C]0.150613[/C][/ROW]
[ROW][C]9[/C][C]0.051127[/C][C]0.4338[/C][C]0.332856[/C][/ROW]
[ROW][C]10[/C][C]0.008371[/C][C]0.071[/C][C]0.471785[/C][/ROW]
[ROW][C]11[/C][C]-0.073835[/C][C]-0.6265[/C][C]0.26648[/C][/ROW]
[ROW][C]12[/C][C]0.387783[/C][C]3.2904[/C][C]0.000775[/C][/ROW]
[ROW][C]13[/C][C]-0.443225[/C][C]-3.7609[/C][C]0.000171[/C][/ROW]
[ROW][C]14[/C][C]-0.01548[/C][C]-0.1314[/C][C]0.447932[/C][/ROW]
[ROW][C]15[/C][C]-0.036951[/C][C]-0.3135[/C][C]0.377389[/C][/ROW]
[ROW][C]16[/C][C]0.072032[/C][C]0.6112[/C][C]0.271491[/C][/ROW]
[ROW][C]17[/C][C]0.012879[/C][C]0.1093[/C][C]0.456643[/C][/ROW]
[ROW][C]18[/C][C]0.051301[/C][C]0.4353[/C][C]0.332321[/C][/ROW]
[ROW][C]19[/C][C]0.062451[/C][C]0.5299[/C][C]0.298901[/C][/ROW]
[ROW][C]20[/C][C]-0.023269[/C][C]-0.1974[/C][C]0.422018[/C][/ROW]
[ROW][C]21[/C][C]0.01045[/C][C]0.0887[/C][C]0.464793[/C][/ROW]
[ROW][C]22[/C][C]0.059372[/C][C]0.5038[/C][C]0.307974[/C][/ROW]
[ROW][C]23[/C][C]0.050836[/C][C]0.4314[/C][C]0.333748[/C][/ROW]
[ROW][C]24[/C][C]0.094226[/C][C]0.7995[/C][C]0.213305[/C][/ROW]
[ROW][C]25[/C][C]-0.26577[/C][C]-2.2551[/C][C]0.013583[/C][/ROW]
[ROW][C]26[/C][C]-0.164336[/C][C]-1.3944[/C][C]0.083737[/C][/ROW]
[ROW][C]27[/C][C]0.044924[/C][C]0.3812[/C][C]0.35209[/C][/ROW]
[ROW][C]28[/C][C]-0.01121[/C][C]-0.0951[/C][C]0.462243[/C][/ROW]
[ROW][C]29[/C][C]-0.032088[/C][C]-0.2723[/C][C]0.393095[/C][/ROW]
[ROW][C]30[/C][C]5.2e-05[/C][C]4e-04[/C][C]0.499823[/C][/ROW]
[ROW][C]31[/C][C]0.091098[/C][C]0.773[/C][C]0.221029[/C][/ROW]
[ROW][C]32[/C][C]-0.005325[/C][C]-0.0452[/C][C]0.482041[/C][/ROW]
[ROW][C]33[/C][C]-0.093845[/C][C]-0.7963[/C][C]0.214238[/C][/ROW]
[ROW][C]34[/C][C]0.046291[/C][C]0.3928[/C][C]0.347817[/C][/ROW]
[ROW][C]35[/C][C]0.022042[/C][C]0.187[/C][C]0.426081[/C][/ROW]
[ROW][C]36[/C][C]-0.015644[/C][C]-0.1327[/C][C]0.447384[/C][/ROW]
[ROW][C]37[/C][C]0.015789[/C][C]0.134[/C][C]0.446898[/C][/ROW]
[ROW][C]38[/C][C]-0.067396[/C][C]-0.5719[/C][C]0.284594[/C][/ROW]
[ROW][C]39[/C][C]-0.035325[/C][C]-0.2997[/C][C]0.38262[/C][/ROW]
[ROW][C]40[/C][C]-0.009782[/C][C]-0.083[/C][C]0.467039[/C][/ROW]
[ROW][C]41[/C][C]-0.001354[/C][C]-0.0115[/C][C]0.495434[/C][/ROW]
[ROW][C]42[/C][C]-0.03223[/C][C]-0.2735[/C][C]0.392635[/C][/ROW]
[ROW][C]43[/C][C]-0.037103[/C][C]-0.3148[/C][C]0.3769[/C][/ROW]
[ROW][C]44[/C][C]0.019624[/C][C]0.1665[/C][C]0.43411[/C][/ROW]
[ROW][C]45[/C][C]0.00638[/C][C]0.0541[/C][C]0.478488[/C][/ROW]
[ROW][C]46[/C][C]-0.046524[/C][C]-0.3948[/C][C]0.347089[/C][/ROW]
[ROW][C]47[/C][C]-0.036721[/C][C]-0.3116[/C][C]0.378127[/C][/ROW]
[ROW][C]48[/C][C]-0.071595[/C][C]-0.6075[/C][C]0.272714[/C][/ROW]
[/TABLE]
Source: https://freestatistics.org/blog/index.php?pk=39778&T=2

Globally Unique Identifier (entire table): ba.freestatistics.org/blog/index.php?pk=39778&T=2

As an alternative you can also use a QR Code:  

The GUIDs for individual cells are displayed in the table below:

Partial Autocorrelation Function
Time lag kPACF(k)T-STATP-value
10.6615095.61310
20.3355942.84760.002868
30.1123740.95350.171758
4-0.050813-0.43120.333818
50.0706310.59930.275419
60.0982590.83380.203588
7-0.128565-1.09090.139474
8-0.122717-1.04130.150613
90.0511270.43380.332856
100.0083710.0710.471785
11-0.073835-0.62650.26648
120.3877833.29040.000775
13-0.443225-3.76090.000171
14-0.01548-0.13140.447932
15-0.036951-0.31350.377389
160.0720320.61120.271491
170.0128790.10930.456643
180.0513010.43530.332321
190.0624510.52990.298901
20-0.023269-0.19740.422018
210.010450.08870.464793
220.0593720.50380.307974
230.0508360.43140.333748
240.0942260.79950.213305
25-0.26577-2.25510.013583
26-0.164336-1.39440.083737
270.0449240.38120.35209
28-0.01121-0.09510.462243
29-0.032088-0.27230.393095
305.2e-054e-040.499823
310.0910980.7730.221029
32-0.005325-0.04520.482041
33-0.093845-0.79630.214238
340.0462910.39280.347817
350.0220420.1870.426081
36-0.015644-0.13270.447384
370.0157890.1340.446898
38-0.067396-0.57190.284594
39-0.035325-0.29970.38262
40-0.009782-0.0830.467039
41-0.001354-0.01150.495434
42-0.03223-0.27350.392635
43-0.037103-0.31480.3769
440.0196240.16650.43411
450.006380.05410.478488
46-0.046524-0.39480.347089
47-0.036721-0.31160.378127
48-0.071595-0.60750.272714


Parameters (Session):
par1 = 48 ; par2 = 1 ; par3 = 0 ; par4 = 0 ; par5 = 12 ;
Parameters (R input):
par1 = 48 ; par2 = 1 ; par3 = 0 ; par4 = 0 ; par5 = 12 ;
R code (references can be found in the software module):
if (par1 == 'Default') {
par1 = 10*log10(length(x))
} else {
par1 <- as.numeric(par1)
}
par2 <- as.numeric(par2)
par3 <- as.numeric(par3)
par4 <- as.numeric(par4)
par5 <- as.numeric(par5)
if (par2 == 0) {
x <- log(x)
} else {
x <- (x ^ par2 - 1) / par2
}
if (par3 > 0) x <- diff(x,lag=1,difference=par3)
if (par4 > 0) x <- diff(x,lag=par5,difference=par4)
bitmap(file='pic1.png')
racf <- acf(x,par1,main='Autocorrelation',xlab='lags',ylab='ACF')
dev.off()
bitmap(file='pic2.png')
rpacf <- pacf(x,par1,main='Partial Autocorrelation',xlab='lags',ylab='PACF')
dev.off()
(myacf <- c(racf$acf))
(mypacf <- c(rpacf$acf))
lengthx <- length(x)
sqrtn <- sqrt(lengthx)
load(file='createtable')
a<-table.start()
a<-table.row.start(a)
a<-table.element(a,'Autocorrelation Function',4,TRUE)
a<-table.row.end(a)
a<-table.row.start(a)
a<-table.element(a,'Time lag k',header=TRUE)
a<-table.element(a,hyperlink('basics.htm','ACF(k)','click here for more information about the Autocorrelation Function'),header=TRUE)
a<-table.element(a,'T-STAT',header=TRUE)
a<-table.element(a,'P-value',header=TRUE)
a<-table.row.end(a)
for (i in 2:(par1+1)) {
a<-table.row.start(a)
a<-table.element(a,i-1,header=TRUE)
a<-table.element(a,round(myacf[i],6))
mytstat <- myacf[i]*sqrtn
a<-table.element(a,round(mytstat,4))
a<-table.element(a,round(1-pt(abs(mytstat),lengthx),6))
a<-table.row.end(a)
}
a<-table.end(a)
table.save(a,file='mytable.tab')
a<-table.start()
a<-table.row.start(a)
a<-table.element(a,'Partial Autocorrelation Function',4,TRUE)
a<-table.row.end(a)
a<-table.row.start(a)
a<-table.element(a,'Time lag k',header=TRUE)
a<-table.element(a,hyperlink('basics.htm','PACF(k)','click here for more information about the Partial Autocorrelation Function'),header=TRUE)
a<-table.element(a,'T-STAT',header=TRUE)
a<-table.element(a,'P-value',header=TRUE)
a<-table.row.end(a)
for (i in 1:par1) {
a<-table.row.start(a)
a<-table.element(a,i,header=TRUE)
a<-table.element(a,round(mypacf[i],6))
mytstat <- mypacf[i]*sqrtn
a<-table.element(a,round(mytstat,4))
a<-table.element(a,round(1-pt(abs(mytstat),lengthx),6))
a<-table.row.end(a)
}
a<-table.end(a)
table.save(a,file='mytable1.tab')