Free Statistics

of Irreproducible Research!

Author's title

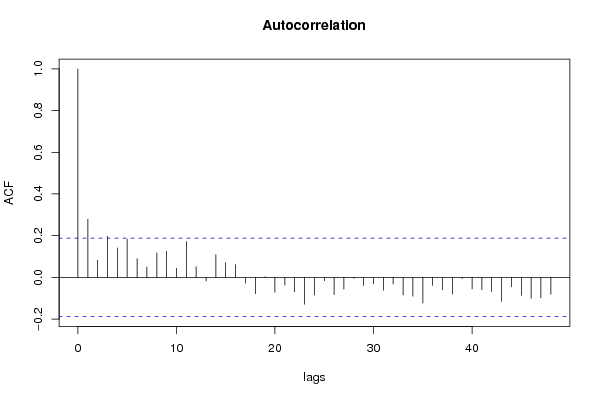
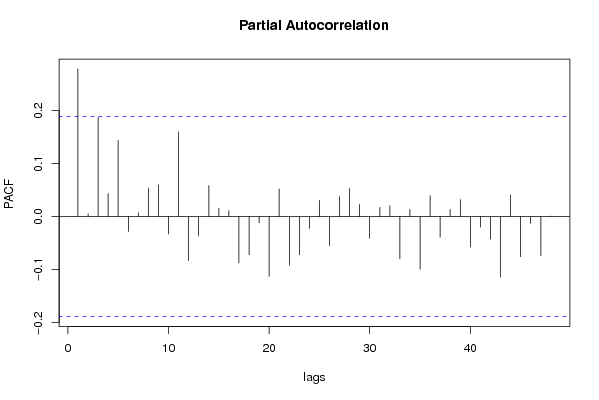
Autocorrelation Trends - Koers BEL 20 van Januari 2000 tot Januari 2009 - C...

Author*Unverified author*
R Software Modulerwasp_autocorrelation.wasp
Title produced by software(Partial) Autocorrelation Function
Date of computationTue, 12 May 2009 07:48:37 -0600
Cite this page as followsStatistical Computations at FreeStatistics.org, Office for Research Development and Education, URL https://freestatistics.org/blog/index.php?v=date/2009/May/12/t1242136168vhjace331v93rvo.htm/, Retrieved Sun, 28 Apr 2024 22:46:57 +0000
Statistical Computations at FreeStatistics.org, Office for Research Development and Education, URL https://freestatistics.org/blog/index.php?pk=39749, Retrieved Sun, 28 Apr 2024 22:46:57 +0000
QR Codes:

Original text written by user:
IsPrivate?No (this computation is public)
User-defined keywords
Estimated Impact172
Family? (F = Feedback message, R = changed R code, M = changed R Module, P = changed Parameters, D = changed Data)
-       [(Partial) Autocorrelation Function] [Autocorrelation T...] [2009-05-12 13:48:37] [fbcf875f1b36dfb87c2c6a55976f6e7b] [Current]
Feedback Forum

Post a new message
Dataseries X:
3030.29
2803.47
2767.63
2882.6
2863.36
2897.06
3012.61
3142.95
3032.93
3045.78
3110.52
3013.24
2987.1
2995.55
2833.18
2848.96
2794.83
2845.26
2915.02
2892.63
2604.42
2641.65
2659.81
2638.53
2720.25
2745.88
2735.7
2811.7
2799.43
2555.28
2304.98
2214.95
2065.81
1940.49
2042
1995.37
1946.81
1765.9
1635.25
1833.42
1910.43
1959.67
1969.6
2061.41
2091.48
2120.88
2174.56
2196.72
2350.44
2440.25
2408.64
2472.81
2407.6
2452.62
2448.05
2497.84
2645.64
2756.76
2849.27
2921.44
2981.85
3080.58
3106.22
3119.31
3061.26
3097.31
3161.69
3257.16
3277.01
3295.32
3363.99
3494.17
3667.03
3813.06
3917.96
3895.51
3801.06
3570.12
3701.61
3862.27
3970.1
4138.52
4199.75
4290.89
4443.91
4502.64
4356.98
4591.27
4696.96
4621.4
4562.84
4202.52
4296.49
4435.23
4105.18
4116.68
3844.49
3720.98
3674.4
3857.62
3801.06
3504.37
3032.6
3047.03
2962.34
2197.82
2014.45
1862.83
1905.41


Summary of computational transaction
Raw Inputview raw input (R code)
Raw Outputview raw output of R engine
Computing time1 seconds
R Server'Gwilym Jenkins' @ 72.249.127.135

\begin{tabular}{lllllllll}
\hline
Summary of computational transaction \tabularnewline
Raw Input & view raw input (R code)  \tabularnewline
Raw Output & view raw output of R engine  \tabularnewline
Computing time & 1 seconds \tabularnewline
R Server & 'Gwilym Jenkins' @ 72.249.127.135 \tabularnewline
\hline
\end{tabular}
%Source: https://freestatistics.org/blog/index.php?pk=39749&T=0

[TABLE]
[ROW][C]Summary of computational transaction[/C][/ROW]
[ROW][C]Raw Input[/C][C]view raw input (R code) [/C][/ROW]
[ROW][C]Raw Output[/C][C]view raw output of R engine [/C][/ROW]
[ROW][C]Computing time[/C][C]1 seconds[/C][/ROW]
[ROW][C]R Server[/C][C]'Gwilym Jenkins' @ 72.249.127.135[/C][/ROW]
[/TABLE]
Source: https://freestatistics.org/blog/index.php?pk=39749&T=0

Globally Unique Identifier (entire table): ba.freestatistics.org/blog/index.php?pk=39749&T=0

As an alternative you can also use a QR Code:  

The GUIDs for individual cells are displayed in the table below:

Summary of computational transaction
Raw Inputview raw input (R code)
Raw Outputview raw output of R engine
Computing time1 seconds
R Server'Gwilym Jenkins' @ 72.249.127.135


Autocorrelation Function
Time lag kACF(k)T-STATP-value
10.2782312.89150.002319
20.082320.85550.197087
30.1970282.04760.021514
40.1410991.46630.07273
50.1831.90180.029931
60.0898410.93370.176282
70.0490740.510.305548
80.1172491.21850.112847
90.1248671.29770.098586
100.0441840.45920.323514
110.1718561.7860.038454
120.0514150.53430.29711
13-0.017218-0.17890.429163
140.1089351.13210.130052
150.0701620.72910.233744
160.0605620.62940.265217
17-0.027942-0.29040.386042
18-0.078489-0.81570.208238
190.0033580.03490.486113
20-0.071501-0.74310.229529
21-0.037349-0.38810.349338
22-0.068528-0.71220.23895
23-0.128992-1.34050.091443
24-0.084278-0.87580.191531
25-0.015883-0.16510.434601
26-0.082644-0.85890.19616
27-0.056191-0.5840.280233
28-0.003985-0.04140.483519
29-0.037988-0.39480.346891
30-0.030741-0.31950.374993
31-0.061715-0.64140.261324
32-0.032275-0.33540.368984
33-0.08422-0.87520.191692
34-0.090428-0.93980.174719
35-0.123664-1.28520.100744
36-0.038607-0.40120.344528
37-0.059197-0.61520.269862
38-0.080254-0.8340.203055
39-0.005211-0.05420.478455
40-0.055795-0.57980.281615
41-0.05939-0.61720.269201
42-0.068475-0.71160.239119
43-0.115249-1.19770.116828
44-0.044638-0.46390.321831
45-0.085926-0.8930.18693
46-0.100751-1.0470.148711
47-0.098598-1.02470.153906
48-0.080827-0.840.201388

\begin{tabular}{lllllllll}
\hline
Autocorrelation Function \tabularnewline
Time lag k & ACF(k) & T-STAT & P-value \tabularnewline
1 & 0.278231 & 2.8915 & 0.002319 \tabularnewline
2 & 0.08232 & 0.8555 & 0.197087 \tabularnewline
3 & 0.197028 & 2.0476 & 0.021514 \tabularnewline
4 & 0.141099 & 1.4663 & 0.07273 \tabularnewline
5 & 0.183 & 1.9018 & 0.029931 \tabularnewline
6 & 0.089841 & 0.9337 & 0.176282 \tabularnewline
7 & 0.049074 & 0.51 & 0.305548 \tabularnewline
8 & 0.117249 & 1.2185 & 0.112847 \tabularnewline
9 & 0.124867 & 1.2977 & 0.098586 \tabularnewline
10 & 0.044184 & 0.4592 & 0.323514 \tabularnewline
11 & 0.171856 & 1.786 & 0.038454 \tabularnewline
12 & 0.051415 & 0.5343 & 0.29711 \tabularnewline
13 & -0.017218 & -0.1789 & 0.429163 \tabularnewline
14 & 0.108935 & 1.1321 & 0.130052 \tabularnewline
15 & 0.070162 & 0.7291 & 0.233744 \tabularnewline
16 & 0.060562 & 0.6294 & 0.265217 \tabularnewline
17 & -0.027942 & -0.2904 & 0.386042 \tabularnewline
18 & -0.078489 & -0.8157 & 0.208238 \tabularnewline
19 & 0.003358 & 0.0349 & 0.486113 \tabularnewline
20 & -0.071501 & -0.7431 & 0.229529 \tabularnewline
21 & -0.037349 & -0.3881 & 0.349338 \tabularnewline
22 & -0.068528 & -0.7122 & 0.23895 \tabularnewline
23 & -0.128992 & -1.3405 & 0.091443 \tabularnewline
24 & -0.084278 & -0.8758 & 0.191531 \tabularnewline
25 & -0.015883 & -0.1651 & 0.434601 \tabularnewline
26 & -0.082644 & -0.8589 & 0.19616 \tabularnewline
27 & -0.056191 & -0.584 & 0.280233 \tabularnewline
28 & -0.003985 & -0.0414 & 0.483519 \tabularnewline
29 & -0.037988 & -0.3948 & 0.346891 \tabularnewline
30 & -0.030741 & -0.3195 & 0.374993 \tabularnewline
31 & -0.061715 & -0.6414 & 0.261324 \tabularnewline
32 & -0.032275 & -0.3354 & 0.368984 \tabularnewline
33 & -0.08422 & -0.8752 & 0.191692 \tabularnewline
34 & -0.090428 & -0.9398 & 0.174719 \tabularnewline
35 & -0.123664 & -1.2852 & 0.100744 \tabularnewline
36 & -0.038607 & -0.4012 & 0.344528 \tabularnewline
37 & -0.059197 & -0.6152 & 0.269862 \tabularnewline
38 & -0.080254 & -0.834 & 0.203055 \tabularnewline
39 & -0.005211 & -0.0542 & 0.478455 \tabularnewline
40 & -0.055795 & -0.5798 & 0.281615 \tabularnewline
41 & -0.05939 & -0.6172 & 0.269201 \tabularnewline
42 & -0.068475 & -0.7116 & 0.239119 \tabularnewline
43 & -0.115249 & -1.1977 & 0.116828 \tabularnewline
44 & -0.044638 & -0.4639 & 0.321831 \tabularnewline
45 & -0.085926 & -0.893 & 0.18693 \tabularnewline
46 & -0.100751 & -1.047 & 0.148711 \tabularnewline
47 & -0.098598 & -1.0247 & 0.153906 \tabularnewline
48 & -0.080827 & -0.84 & 0.201388 \tabularnewline
\hline
\end{tabular}
%Source: https://freestatistics.org/blog/index.php?pk=39749&T=1

[TABLE]
[ROW][C]Autocorrelation Function[/C][/ROW]
[ROW][C]Time lag k[/C][C]ACF(k)[/C][C]T-STAT[/C][C]P-value[/C][/ROW]
[ROW][C]1[/C][C]0.278231[/C][C]2.8915[/C][C]0.002319[/C][/ROW]
[ROW][C]2[/C][C]0.08232[/C][C]0.8555[/C][C]0.197087[/C][/ROW]
[ROW][C]3[/C][C]0.197028[/C][C]2.0476[/C][C]0.021514[/C][/ROW]
[ROW][C]4[/C][C]0.141099[/C][C]1.4663[/C][C]0.07273[/C][/ROW]
[ROW][C]5[/C][C]0.183[/C][C]1.9018[/C][C]0.029931[/C][/ROW]
[ROW][C]6[/C][C]0.089841[/C][C]0.9337[/C][C]0.176282[/C][/ROW]
[ROW][C]7[/C][C]0.049074[/C][C]0.51[/C][C]0.305548[/C][/ROW]
[ROW][C]8[/C][C]0.117249[/C][C]1.2185[/C][C]0.112847[/C][/ROW]
[ROW][C]9[/C][C]0.124867[/C][C]1.2977[/C][C]0.098586[/C][/ROW]
[ROW][C]10[/C][C]0.044184[/C][C]0.4592[/C][C]0.323514[/C][/ROW]
[ROW][C]11[/C][C]0.171856[/C][C]1.786[/C][C]0.038454[/C][/ROW]
[ROW][C]12[/C][C]0.051415[/C][C]0.5343[/C][C]0.29711[/C][/ROW]
[ROW][C]13[/C][C]-0.017218[/C][C]-0.1789[/C][C]0.429163[/C][/ROW]
[ROW][C]14[/C][C]0.108935[/C][C]1.1321[/C][C]0.130052[/C][/ROW]
[ROW][C]15[/C][C]0.070162[/C][C]0.7291[/C][C]0.233744[/C][/ROW]
[ROW][C]16[/C][C]0.060562[/C][C]0.6294[/C][C]0.265217[/C][/ROW]
[ROW][C]17[/C][C]-0.027942[/C][C]-0.2904[/C][C]0.386042[/C][/ROW]
[ROW][C]18[/C][C]-0.078489[/C][C]-0.8157[/C][C]0.208238[/C][/ROW]
[ROW][C]19[/C][C]0.003358[/C][C]0.0349[/C][C]0.486113[/C][/ROW]
[ROW][C]20[/C][C]-0.071501[/C][C]-0.7431[/C][C]0.229529[/C][/ROW]
[ROW][C]21[/C][C]-0.037349[/C][C]-0.3881[/C][C]0.349338[/C][/ROW]
[ROW][C]22[/C][C]-0.068528[/C][C]-0.7122[/C][C]0.23895[/C][/ROW]
[ROW][C]23[/C][C]-0.128992[/C][C]-1.3405[/C][C]0.091443[/C][/ROW]
[ROW][C]24[/C][C]-0.084278[/C][C]-0.8758[/C][C]0.191531[/C][/ROW]
[ROW][C]25[/C][C]-0.015883[/C][C]-0.1651[/C][C]0.434601[/C][/ROW]
[ROW][C]26[/C][C]-0.082644[/C][C]-0.8589[/C][C]0.19616[/C][/ROW]
[ROW][C]27[/C][C]-0.056191[/C][C]-0.584[/C][C]0.280233[/C][/ROW]
[ROW][C]28[/C][C]-0.003985[/C][C]-0.0414[/C][C]0.483519[/C][/ROW]
[ROW][C]29[/C][C]-0.037988[/C][C]-0.3948[/C][C]0.346891[/C][/ROW]
[ROW][C]30[/C][C]-0.030741[/C][C]-0.3195[/C][C]0.374993[/C][/ROW]
[ROW][C]31[/C][C]-0.061715[/C][C]-0.6414[/C][C]0.261324[/C][/ROW]
[ROW][C]32[/C][C]-0.032275[/C][C]-0.3354[/C][C]0.368984[/C][/ROW]
[ROW][C]33[/C][C]-0.08422[/C][C]-0.8752[/C][C]0.191692[/C][/ROW]
[ROW][C]34[/C][C]-0.090428[/C][C]-0.9398[/C][C]0.174719[/C][/ROW]
[ROW][C]35[/C][C]-0.123664[/C][C]-1.2852[/C][C]0.100744[/C][/ROW]
[ROW][C]36[/C][C]-0.038607[/C][C]-0.4012[/C][C]0.344528[/C][/ROW]
[ROW][C]37[/C][C]-0.059197[/C][C]-0.6152[/C][C]0.269862[/C][/ROW]
[ROW][C]38[/C][C]-0.080254[/C][C]-0.834[/C][C]0.203055[/C][/ROW]
[ROW][C]39[/C][C]-0.005211[/C][C]-0.0542[/C][C]0.478455[/C][/ROW]
[ROW][C]40[/C][C]-0.055795[/C][C]-0.5798[/C][C]0.281615[/C][/ROW]
[ROW][C]41[/C][C]-0.05939[/C][C]-0.6172[/C][C]0.269201[/C][/ROW]
[ROW][C]42[/C][C]-0.068475[/C][C]-0.7116[/C][C]0.239119[/C][/ROW]
[ROW][C]43[/C][C]-0.115249[/C][C]-1.1977[/C][C]0.116828[/C][/ROW]
[ROW][C]44[/C][C]-0.044638[/C][C]-0.4639[/C][C]0.321831[/C][/ROW]
[ROW][C]45[/C][C]-0.085926[/C][C]-0.893[/C][C]0.18693[/C][/ROW]
[ROW][C]46[/C][C]-0.100751[/C][C]-1.047[/C][C]0.148711[/C][/ROW]
[ROW][C]47[/C][C]-0.098598[/C][C]-1.0247[/C][C]0.153906[/C][/ROW]
[ROW][C]48[/C][C]-0.080827[/C][C]-0.84[/C][C]0.201388[/C][/ROW]
[/TABLE]
Source: https://freestatistics.org/blog/index.php?pk=39749&T=1

Globally Unique Identifier (entire table): ba.freestatistics.org/blog/index.php?pk=39749&T=1

As an alternative you can also use a QR Code:  

The GUIDs for individual cells are displayed in the table below:

Autocorrelation Function
Time lag kACF(k)T-STATP-value
10.2782312.89150.002319
20.082320.85550.197087
30.1970282.04760.021514
40.1410991.46630.07273
50.1831.90180.029931
60.0898410.93370.176282
70.0490740.510.305548
80.1172491.21850.112847
90.1248671.29770.098586
100.0441840.45920.323514
110.1718561.7860.038454
120.0514150.53430.29711
13-0.017218-0.17890.429163
140.1089351.13210.130052
150.0701620.72910.233744
160.0605620.62940.265217
17-0.027942-0.29040.386042
18-0.078489-0.81570.208238
190.0033580.03490.486113
20-0.071501-0.74310.229529
21-0.037349-0.38810.349338
22-0.068528-0.71220.23895
23-0.128992-1.34050.091443
24-0.084278-0.87580.191531
25-0.015883-0.16510.434601
26-0.082644-0.85890.19616
27-0.056191-0.5840.280233
28-0.003985-0.04140.483519
29-0.037988-0.39480.346891
30-0.030741-0.31950.374993
31-0.061715-0.64140.261324
32-0.032275-0.33540.368984
33-0.08422-0.87520.191692
34-0.090428-0.93980.174719
35-0.123664-1.28520.100744
36-0.038607-0.40120.344528
37-0.059197-0.61520.269862
38-0.080254-0.8340.203055
39-0.005211-0.05420.478455
40-0.055795-0.57980.281615
41-0.05939-0.61720.269201
42-0.068475-0.71160.239119
43-0.115249-1.19770.116828
44-0.044638-0.46390.321831
45-0.085926-0.8930.18693
46-0.100751-1.0470.148711
47-0.098598-1.02470.153906
48-0.080827-0.840.201388


Partial Autocorrelation Function
Time lag kPACF(k)T-STATP-value
10.2782312.89150.002319
20.0053190.05530.47801
30.1872681.94610.027118
40.0432390.44940.327037
50.1435341.49170.069353
6-0.027939-0.29040.386051
70.0073380.07630.469678
80.053780.55890.288696
90.0595760.61910.268567
10-0.033003-0.3430.36614
110.1594891.65750.050164
12-0.082933-0.86190.195337
13-0.036538-0.37970.352451
140.0582680.60550.273045
150.0154410.16050.436405
160.0110540.11490.45438
17-0.087289-0.90710.183178
18-0.071721-0.74540.228839
19-0.011815-0.12280.451255
20-0.112844-1.17270.121745
210.0518910.53930.295406
22-0.091616-0.95210.171585
23-0.072003-0.74830.227959
24-0.022288-0.23160.408634
250.0304210.31610.376251
26-0.055132-0.57290.283936
270.0377760.39260.3477
280.0531530.55240.290916
290.0228750.23770.406275
30-0.040816-0.42420.336142
310.0172690.17950.428954
320.0205670.21370.415577
33-0.079444-0.82560.205423
340.0132550.13780.445347
35-0.099198-1.03090.152446
360.039150.40690.342458
37-0.038895-0.40420.34343
380.0133710.1390.444871
390.0321760.33440.369369
40-0.057269-0.59520.276491
41-0.019757-0.20530.418852
42-0.042273-0.43930.330654
43-0.114066-1.18540.119229
440.0407330.42330.336456
45-0.075632-0.7860.216797
46-0.012992-0.1350.446425
47-0.073376-0.76250.223698
480.0010320.01070.495729

\begin{tabular}{lllllllll}
\hline
Partial Autocorrelation Function \tabularnewline
Time lag k & PACF(k) & T-STAT & P-value \tabularnewline
1 & 0.278231 & 2.8915 & 0.002319 \tabularnewline
2 & 0.005319 & 0.0553 & 0.47801 \tabularnewline
3 & 0.187268 & 1.9461 & 0.027118 \tabularnewline
4 & 0.043239 & 0.4494 & 0.327037 \tabularnewline
5 & 0.143534 & 1.4917 & 0.069353 \tabularnewline
6 & -0.027939 & -0.2904 & 0.386051 \tabularnewline
7 & 0.007338 & 0.0763 & 0.469678 \tabularnewline
8 & 0.05378 & 0.5589 & 0.288696 \tabularnewline
9 & 0.059576 & 0.6191 & 0.268567 \tabularnewline
10 & -0.033003 & -0.343 & 0.36614 \tabularnewline
11 & 0.159489 & 1.6575 & 0.050164 \tabularnewline
12 & -0.082933 & -0.8619 & 0.195337 \tabularnewline
13 & -0.036538 & -0.3797 & 0.352451 \tabularnewline
14 & 0.058268 & 0.6055 & 0.273045 \tabularnewline
15 & 0.015441 & 0.1605 & 0.436405 \tabularnewline
16 & 0.011054 & 0.1149 & 0.45438 \tabularnewline
17 & -0.087289 & -0.9071 & 0.183178 \tabularnewline
18 & -0.071721 & -0.7454 & 0.228839 \tabularnewline
19 & -0.011815 & -0.1228 & 0.451255 \tabularnewline
20 & -0.112844 & -1.1727 & 0.121745 \tabularnewline
21 & 0.051891 & 0.5393 & 0.295406 \tabularnewline
22 & -0.091616 & -0.9521 & 0.171585 \tabularnewline
23 & -0.072003 & -0.7483 & 0.227959 \tabularnewline
24 & -0.022288 & -0.2316 & 0.408634 \tabularnewline
25 & 0.030421 & 0.3161 & 0.376251 \tabularnewline
26 & -0.055132 & -0.5729 & 0.283936 \tabularnewline
27 & 0.037776 & 0.3926 & 0.3477 \tabularnewline
28 & 0.053153 & 0.5524 & 0.290916 \tabularnewline
29 & 0.022875 & 0.2377 & 0.406275 \tabularnewline
30 & -0.040816 & -0.4242 & 0.336142 \tabularnewline
31 & 0.017269 & 0.1795 & 0.428954 \tabularnewline
32 & 0.020567 & 0.2137 & 0.415577 \tabularnewline
33 & -0.079444 & -0.8256 & 0.205423 \tabularnewline
34 & 0.013255 & 0.1378 & 0.445347 \tabularnewline
35 & -0.099198 & -1.0309 & 0.152446 \tabularnewline
36 & 0.03915 & 0.4069 & 0.342458 \tabularnewline
37 & -0.038895 & -0.4042 & 0.34343 \tabularnewline
38 & 0.013371 & 0.139 & 0.444871 \tabularnewline
39 & 0.032176 & 0.3344 & 0.369369 \tabularnewline
40 & -0.057269 & -0.5952 & 0.276491 \tabularnewline
41 & -0.019757 & -0.2053 & 0.418852 \tabularnewline
42 & -0.042273 & -0.4393 & 0.330654 \tabularnewline
43 & -0.114066 & -1.1854 & 0.119229 \tabularnewline
44 & 0.040733 & 0.4233 & 0.336456 \tabularnewline
45 & -0.075632 & -0.786 & 0.216797 \tabularnewline
46 & -0.012992 & -0.135 & 0.446425 \tabularnewline
47 & -0.073376 & -0.7625 & 0.223698 \tabularnewline
48 & 0.001032 & 0.0107 & 0.495729 \tabularnewline
\hline
\end{tabular}
%Source: https://freestatistics.org/blog/index.php?pk=39749&T=2

[TABLE]
[ROW][C]Partial Autocorrelation Function[/C][/ROW]
[ROW][C]Time lag k[/C][C]PACF(k)[/C][C]T-STAT[/C][C]P-value[/C][/ROW]
[ROW][C]1[/C][C]0.278231[/C][C]2.8915[/C][C]0.002319[/C][/ROW]
[ROW][C]2[/C][C]0.005319[/C][C]0.0553[/C][C]0.47801[/C][/ROW]
[ROW][C]3[/C][C]0.187268[/C][C]1.9461[/C][C]0.027118[/C][/ROW]
[ROW][C]4[/C][C]0.043239[/C][C]0.4494[/C][C]0.327037[/C][/ROW]
[ROW][C]5[/C][C]0.143534[/C][C]1.4917[/C][C]0.069353[/C][/ROW]
[ROW][C]6[/C][C]-0.027939[/C][C]-0.2904[/C][C]0.386051[/C][/ROW]
[ROW][C]7[/C][C]0.007338[/C][C]0.0763[/C][C]0.469678[/C][/ROW]
[ROW][C]8[/C][C]0.05378[/C][C]0.5589[/C][C]0.288696[/C][/ROW]
[ROW][C]9[/C][C]0.059576[/C][C]0.6191[/C][C]0.268567[/C][/ROW]
[ROW][C]10[/C][C]-0.033003[/C][C]-0.343[/C][C]0.36614[/C][/ROW]
[ROW][C]11[/C][C]0.159489[/C][C]1.6575[/C][C]0.050164[/C][/ROW]
[ROW][C]12[/C][C]-0.082933[/C][C]-0.8619[/C][C]0.195337[/C][/ROW]
[ROW][C]13[/C][C]-0.036538[/C][C]-0.3797[/C][C]0.352451[/C][/ROW]
[ROW][C]14[/C][C]0.058268[/C][C]0.6055[/C][C]0.273045[/C][/ROW]
[ROW][C]15[/C][C]0.015441[/C][C]0.1605[/C][C]0.436405[/C][/ROW]
[ROW][C]16[/C][C]0.011054[/C][C]0.1149[/C][C]0.45438[/C][/ROW]
[ROW][C]17[/C][C]-0.087289[/C][C]-0.9071[/C][C]0.183178[/C][/ROW]
[ROW][C]18[/C][C]-0.071721[/C][C]-0.7454[/C][C]0.228839[/C][/ROW]
[ROW][C]19[/C][C]-0.011815[/C][C]-0.1228[/C][C]0.451255[/C][/ROW]
[ROW][C]20[/C][C]-0.112844[/C][C]-1.1727[/C][C]0.121745[/C][/ROW]
[ROW][C]21[/C][C]0.051891[/C][C]0.5393[/C][C]0.295406[/C][/ROW]
[ROW][C]22[/C][C]-0.091616[/C][C]-0.9521[/C][C]0.171585[/C][/ROW]
[ROW][C]23[/C][C]-0.072003[/C][C]-0.7483[/C][C]0.227959[/C][/ROW]
[ROW][C]24[/C][C]-0.022288[/C][C]-0.2316[/C][C]0.408634[/C][/ROW]
[ROW][C]25[/C][C]0.030421[/C][C]0.3161[/C][C]0.376251[/C][/ROW]
[ROW][C]26[/C][C]-0.055132[/C][C]-0.5729[/C][C]0.283936[/C][/ROW]
[ROW][C]27[/C][C]0.037776[/C][C]0.3926[/C][C]0.3477[/C][/ROW]
[ROW][C]28[/C][C]0.053153[/C][C]0.5524[/C][C]0.290916[/C][/ROW]
[ROW][C]29[/C][C]0.022875[/C][C]0.2377[/C][C]0.406275[/C][/ROW]
[ROW][C]30[/C][C]-0.040816[/C][C]-0.4242[/C][C]0.336142[/C][/ROW]
[ROW][C]31[/C][C]0.017269[/C][C]0.1795[/C][C]0.428954[/C][/ROW]
[ROW][C]32[/C][C]0.020567[/C][C]0.2137[/C][C]0.415577[/C][/ROW]
[ROW][C]33[/C][C]-0.079444[/C][C]-0.8256[/C][C]0.205423[/C][/ROW]
[ROW][C]34[/C][C]0.013255[/C][C]0.1378[/C][C]0.445347[/C][/ROW]
[ROW][C]35[/C][C]-0.099198[/C][C]-1.0309[/C][C]0.152446[/C][/ROW]
[ROW][C]36[/C][C]0.03915[/C][C]0.4069[/C][C]0.342458[/C][/ROW]
[ROW][C]37[/C][C]-0.038895[/C][C]-0.4042[/C][C]0.34343[/C][/ROW]
[ROW][C]38[/C][C]0.013371[/C][C]0.139[/C][C]0.444871[/C][/ROW]
[ROW][C]39[/C][C]0.032176[/C][C]0.3344[/C][C]0.369369[/C][/ROW]
[ROW][C]40[/C][C]-0.057269[/C][C]-0.5952[/C][C]0.276491[/C][/ROW]
[ROW][C]41[/C][C]-0.019757[/C][C]-0.2053[/C][C]0.418852[/C][/ROW]
[ROW][C]42[/C][C]-0.042273[/C][C]-0.4393[/C][C]0.330654[/C][/ROW]
[ROW][C]43[/C][C]-0.114066[/C][C]-1.1854[/C][C]0.119229[/C][/ROW]
[ROW][C]44[/C][C]0.040733[/C][C]0.4233[/C][C]0.336456[/C][/ROW]
[ROW][C]45[/C][C]-0.075632[/C][C]-0.786[/C][C]0.216797[/C][/ROW]
[ROW][C]46[/C][C]-0.012992[/C][C]-0.135[/C][C]0.446425[/C][/ROW]
[ROW][C]47[/C][C]-0.073376[/C][C]-0.7625[/C][C]0.223698[/C][/ROW]
[ROW][C]48[/C][C]0.001032[/C][C]0.0107[/C][C]0.495729[/C][/ROW]
[/TABLE]
Source: https://freestatistics.org/blog/index.php?pk=39749&T=2

Globally Unique Identifier (entire table): ba.freestatistics.org/blog/index.php?pk=39749&T=2

As an alternative you can also use a QR Code:  

The GUIDs for individual cells are displayed in the table below:

Partial Autocorrelation Function
Time lag kPACF(k)T-STATP-value
10.2782312.89150.002319
20.0053190.05530.47801
30.1872681.94610.027118
40.0432390.44940.327037
50.1435341.49170.069353
6-0.027939-0.29040.386051
70.0073380.07630.469678
80.053780.55890.288696
90.0595760.61910.268567
10-0.033003-0.3430.36614
110.1594891.65750.050164
12-0.082933-0.86190.195337
13-0.036538-0.37970.352451
140.0582680.60550.273045
150.0154410.16050.436405
160.0110540.11490.45438
17-0.087289-0.90710.183178
18-0.071721-0.74540.228839
19-0.011815-0.12280.451255
20-0.112844-1.17270.121745
210.0518910.53930.295406
22-0.091616-0.95210.171585
23-0.072003-0.74830.227959
24-0.022288-0.23160.408634
250.0304210.31610.376251
26-0.055132-0.57290.283936
270.0377760.39260.3477
280.0531530.55240.290916
290.0228750.23770.406275
30-0.040816-0.42420.336142
310.0172690.17950.428954
320.0205670.21370.415577
33-0.079444-0.82560.205423
340.0132550.13780.445347
35-0.099198-1.03090.152446
360.039150.40690.342458
37-0.038895-0.40420.34343
380.0133710.1390.444871
390.0321760.33440.369369
40-0.057269-0.59520.276491
41-0.019757-0.20530.418852
42-0.042273-0.43930.330654
43-0.114066-1.18540.119229
440.0407330.42330.336456
45-0.075632-0.7860.216797
46-0.012992-0.1350.446425
47-0.073376-0.76250.223698
480.0010320.01070.495729


Parameters (Session):
par1 = 48 ; par2 = 1 ; par3 = 1 ; par4 = 0 ; par5 = 12 ;
Parameters (R input):
par1 = 48 ; par2 = 1 ; par3 = 1 ; par4 = 0 ; par5 = 12 ;
R code (references can be found in the software module):
if (par1 == 'Default') {
par1 = 10*log10(length(x))
} else {
par1 <- as.numeric(par1)
}
par2 <- as.numeric(par2)
par3 <- as.numeric(par3)
par4 <- as.numeric(par4)
par5 <- as.numeric(par5)
if (par2 == 0) {
x <- log(x)
} else {
x <- (x ^ par2 - 1) / par2
}
if (par3 > 0) x <- diff(x,lag=1,difference=par3)
if (par4 > 0) x <- diff(x,lag=par5,difference=par4)
bitmap(file='pic1.png')
racf <- acf(x,par1,main='Autocorrelation',xlab='lags',ylab='ACF')
dev.off()
bitmap(file='pic2.png')
rpacf <- pacf(x,par1,main='Partial Autocorrelation',xlab='lags',ylab='PACF')
dev.off()
(myacf <- c(racf$acf))
(mypacf <- c(rpacf$acf))
lengthx <- length(x)
sqrtn <- sqrt(lengthx)
load(file='createtable')
a<-table.start()
a<-table.row.start(a)
a<-table.element(a,'Autocorrelation Function',4,TRUE)
a<-table.row.end(a)
a<-table.row.start(a)
a<-table.element(a,'Time lag k',header=TRUE)
a<-table.element(a,hyperlink('basics.htm','ACF(k)','click here for more information about the Autocorrelation Function'),header=TRUE)
a<-table.element(a,'T-STAT',header=TRUE)
a<-table.element(a,'P-value',header=TRUE)
a<-table.row.end(a)
for (i in 2:(par1+1)) {
a<-table.row.start(a)
a<-table.element(a,i-1,header=TRUE)
a<-table.element(a,round(myacf[i],6))
mytstat <- myacf[i]*sqrtn
a<-table.element(a,round(mytstat,4))
a<-table.element(a,round(1-pt(abs(mytstat),lengthx),6))
a<-table.row.end(a)
}
a<-table.end(a)
table.save(a,file='mytable.tab')
a<-table.start()
a<-table.row.start(a)
a<-table.element(a,'Partial Autocorrelation Function',4,TRUE)
a<-table.row.end(a)
a<-table.row.start(a)
a<-table.element(a,'Time lag k',header=TRUE)
a<-table.element(a,hyperlink('basics.htm','PACF(k)','click here for more information about the Partial Autocorrelation Function'),header=TRUE)
a<-table.element(a,'T-STAT',header=TRUE)
a<-table.element(a,'P-value',header=TRUE)
a<-table.row.end(a)
for (i in 1:par1) {
a<-table.row.start(a)
a<-table.element(a,i,header=TRUE)
a<-table.element(a,round(mypacf[i],6))
mytstat <- mypacf[i]*sqrtn
a<-table.element(a,round(mytstat,4))
a<-table.element(a,round(1-pt(abs(mytstat),lengthx),6))
a<-table.row.end(a)
}
a<-table.end(a)
table.save(a,file='mytable1.tab')