Free Statistics

of Irreproducible Research!

Author's title

Author*Unverified author*
R Software Modulerwasp_centraltendency.wasp
Title produced by softwareCentral Tendency
Date of computationTue, 12 May 2009 05:42:06 -0600
Cite this page as followsStatistical Computations at FreeStatistics.org, Office for Research Development and Education, URL https://freestatistics.org/blog/index.php?v=date/2009/May/12/t12421286451hbzjtyhnqlo77s.htm/, Retrieved Mon, 29 Apr 2024 00:55:01 +0000
Statistical Computations at FreeStatistics.org, Office for Research Development and Education, URL https://freestatistics.org/blog/index.php?pk=39736, Retrieved Mon, 29 Apr 2024 00:55:01 +0000
QR Codes:

Original text written by user:
IsPrivate?No (this computation is public)
User-defined keywords
Estimated Impact162
Family? (F = Feedback message, R = changed R code, M = changed R Module, P = changed Parameters, D = changed Data)
-       [Central Tendency] [Robuustheid- omze...] [2009-05-12 11:42:06] [5e28000efa8060aa7512f63d330b190a] [Current]
Feedback Forum

Post a new message
Dataseries X:
831581
808744
899237
929532
883165
908232
955613
937590
849396
978630
868513
1156102
1505713
1415151
1545021
1681193
1457973
1638575
1688972
1563924
1596359
1722061
1549332
2264959
1420268
1415099
1597279
1605693
1575400
1654752
1553966
1570959
1642414
1664774
1551560
2304365
1644081
1425600
1569344
1456489
1610786
1601519
1496600
1486452
1637939
1605759
1504221
1993384
1507620
1477037
1679184
1504731
1570141
1734191
1657498
1652164
1610941
1813765
1711573
2165466
1492778
1385488
1470589
1514657
1641395
1606185
1581162
1517847
1630080
1604623
1548973
2125558


Summary of computational transaction
Raw Inputview raw input (R code)
Raw Outputview raw output of R engine
Computing time2 seconds
R Server'Gwilym Jenkins' @ 72.249.127.135

\begin{tabular}{lllllllll}
\hline
Summary of computational transaction \tabularnewline
Raw Input & view raw input (R code)  \tabularnewline
Raw Output & view raw output of R engine  \tabularnewline
Computing time & 2 seconds \tabularnewline
R Server & 'Gwilym Jenkins' @ 72.249.127.135 \tabularnewline
\hline
\end{tabular}
%Source: https://freestatistics.org/blog/index.php?pk=39736&T=0

[TABLE]
[ROW][C]Summary of computational transaction[/C][/ROW]
[ROW][C]Raw Input[/C][C]view raw input (R code) [/C][/ROW]
[ROW][C]Raw Output[/C][C]view raw output of R engine [/C][/ROW]
[ROW][C]Computing time[/C][C]2 seconds[/C][/ROW]
[ROW][C]R Server[/C][C]'Gwilym Jenkins' @ 72.249.127.135[/C][/ROW]
[/TABLE]
Source: https://freestatistics.org/blog/index.php?pk=39736&T=0

Globally Unique Identifier (entire table): ba.freestatistics.org/blog/index.php?pk=39736&T=0

As an alternative you can also use a QR Code:  

The GUIDs for individual cells are displayed in the table below:

Summary of computational transaction
Raw Inputview raw input (R code)
Raw Outputview raw output of R engine
Computing time2 seconds
R Server'Gwilym Jenkins' @ 72.249.127.135


Central Tendency - Ungrouped Data
MeasureValueS.E.Value/S.E.
Arithmetic Mean1505943.2916666737592.030340687240.0601744044862
Geometric Mean1467952.80173725
Harmonic Mean1424111.76858946
Quadratic Mean1538895.58145458
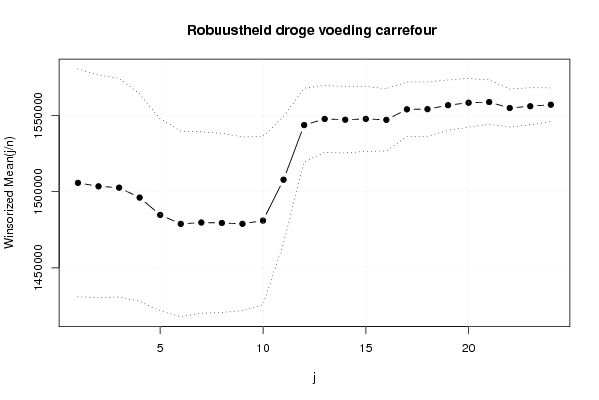
Winsorized Mean ( 1 / 24 )1505713.1666666737350.063282471440.3135372296225
Winsorized Mean ( 2 / 24 )1503444.3333333336475.289563326041.2181603307946
Winsorized Mean ( 3 / 24 )1502578.0416666735859.455635112141.9018642378777
Winsorized Mean ( 4 / 24 )1496049.0416666733996.157749508044.0064154511201
Winsorized Mean ( 5 / 24 )1484691.6111111131491.499551643647.1457895701769
Winsorized Mean ( 6 / 24 )1478810.0277777830412.556605321748.6249823376904
Winsorized Mean ( 7 / 24 )1479701.5555555629731.594153828549.7686584816044
Winsorized Mean ( 8 / 24 )1479431.5555555629366.801320399550.3776880367245
Winsorized Mean ( 9 / 24 )1478859.3055555628478.335567657151.9292745196492
Winsorized Mean ( 10 / 24 )1480975.6944444427542.582087630253.7704014000043
Winsorized Mean ( 11 / 24 )1507782.5416666720756.883486071772.6401216578788
Winsorized Mean ( 12 / 24 )1543611.87512101.2455396093127.558098870692
Winsorized Mean ( 13 / 24 )1547644.5833333310967.1185065699141.116792200815
Winsorized Mean ( 14 / 24 )1547120.7510890.5674385546142.060618854709
Winsorized Mean ( 15 / 24 )1547647.62510634.8195258773145.526458745649
Winsorized Mean ( 16 / 24 )1547036.2916666710190.570564581151.81056662751
Winsorized Mean ( 17 / 24 )1553935.930555568962.99155308775173.372464020701
Winsorized Mean ( 18 / 24 )1554052.180555568870.91456418872175.185114151494
Winsorized Mean ( 19 / 24 )1556637.236111118269.14873702797188.246370408205
Winsorized Mean ( 20 / 24 )1558251.680555567984.80603453617195.152101856419
Winsorized Mean ( 21 / 24 )1558705.513888897276.29845152804214.216819756968
Winsorized Mean ( 22 / 24 )1554790.430555566227.79116836672249.653591220739
Winsorized Mean ( 23 / 24 )1555961.833333336051.51538345797257.119371717473
Winsorized Mean ( 24 / 24 )1556968.55510.1963745116282.561345218482
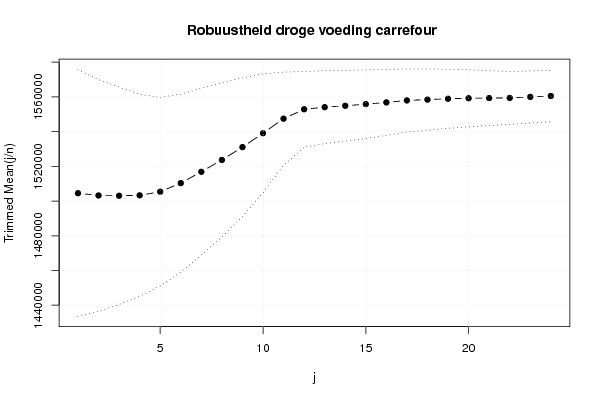
Trimmed Mean ( 1 / 24 )1504497.2571428635538.936397793542.3337727472414
Trimmed Mean ( 2 / 24 )1503209.8235294133356.088950665345.065529887293
Trimmed Mean ( 3 / 24 )1503081.9090909131300.779281970248.0205906552848
Trimmed Mean ( 4 / 24 )1503270.85937529093.96940532351.6695002470156
Trimmed Mean ( 5 / 24 )1505367.5161290327150.540016325255.4452145417321
Trimmed Mean ( 6 / 24 )1510329.7333333325621.801542946658.9470545543708
Trimmed Mean ( 7 / 24 )1516851.0517241424028.77774706463.1264339656009
Trimmed Mean ( 8 / 24 )1523674.4285714322208.891363389068.6065055495376
Trimmed Mean ( 9 / 24 )1531048.2407407419935.486244122976.8001453283892
Trimmed Mean ( 10 / 24 )1539077.3076923117127.951180561489.8576421352144
Trimmed Mean ( 11 / 24 )1547443.9413404.3921795199115.443051745702
Trimmed Mean ( 12 / 24 )1552852.312510905.4295615996142.392585613310
Trimmed Mean ( 13 / 24 )1554057.5869565210488.0506167124148.174112020415
Trimmed Mean ( 14 / 24 )1554864.8181818210221.1352083530152.122517361000
Trimmed Mean ( 15 / 24 )1555813.071428579880.97312671024157.455450134046
Trimmed Mean ( 16 / 24 )1556792.9259487.87142088333164.082422277921
Trimmed Mean ( 17 / 24 )1557948.315789479065.48091321781171.85501030816
Trimmed Mean ( 18 / 24 )1558420.361111118824.24299529002176.606691581694
Trimmed Mean ( 19 / 24 )1558934.264705888503.39718453233183.330759562964
Trimmed Mean ( 20 / 24 )1559206.281258217.02909166169189.753043813879
Trimmed Mean ( 21 / 24 )1559320.833333337880.45633693586197.871895568378
Trimmed Mean ( 22 / 24 )1559396.178571437603.90977962322205.078206313055
Trimmed Mean ( 23 / 24 )1559975.923076927504.65605093533207.867744036384
Trimmed Mean ( 24 / 24 )1560499.57372.48604389261211.665304038483
Median1566634
Midrange1556554.5
Midmean - Weighted Average at Xnp1555665.45945946
Midmean - Weighted Average at X(n+1)p1558420.36111111
Midmean - Empirical Distribution Function1555665.45945946
Midmean - Empirical Distribution Function - Averaging1558420.36111111
Midmean - Empirical Distribution Function - Interpolation1558420.36111111
Midmean - Closest Observation1555665.45945946
Midmean - True Basic - Statistics Graphics Toolkit1558420.36111111
Midmean - MS Excel (old versions)1557948.31578947
Number of observations72

\begin{tabular}{lllllllll}
\hline
Central Tendency - Ungrouped Data \tabularnewline
Measure & Value & S.E. & Value/S.E. \tabularnewline
Arithmetic Mean & 1505943.29166667 & 37592.0303406872 & 40.0601744044862 \tabularnewline
Geometric Mean & 1467952.80173725 &  &  \tabularnewline
Harmonic Mean & 1424111.76858946 &  &  \tabularnewline
Quadratic Mean & 1538895.58145458 &  &  \tabularnewline
Winsorized Mean ( 1 / 24 ) & 1505713.16666667 & 37350.0632824714 & 40.3135372296225 \tabularnewline
Winsorized Mean ( 2 / 24 ) & 1503444.33333333 & 36475.2895633260 & 41.2181603307946 \tabularnewline
Winsorized Mean ( 3 / 24 ) & 1502578.04166667 & 35859.4556351121 & 41.9018642378777 \tabularnewline
Winsorized Mean ( 4 / 24 ) & 1496049.04166667 & 33996.1577495080 & 44.0064154511201 \tabularnewline
Winsorized Mean ( 5 / 24 ) & 1484691.61111111 & 31491.4995516436 & 47.1457895701769 \tabularnewline
Winsorized Mean ( 6 / 24 ) & 1478810.02777778 & 30412.5566053217 & 48.6249823376904 \tabularnewline
Winsorized Mean ( 7 / 24 ) & 1479701.55555556 & 29731.5941538285 & 49.7686584816044 \tabularnewline
Winsorized Mean ( 8 / 24 ) & 1479431.55555556 & 29366.8013203995 & 50.3776880367245 \tabularnewline
Winsorized Mean ( 9 / 24 ) & 1478859.30555556 & 28478.3355676571 & 51.9292745196492 \tabularnewline
Winsorized Mean ( 10 / 24 ) & 1480975.69444444 & 27542.5820876302 & 53.7704014000043 \tabularnewline
Winsorized Mean ( 11 / 24 ) & 1507782.54166667 & 20756.8834860717 & 72.6401216578788 \tabularnewline
Winsorized Mean ( 12 / 24 ) & 1543611.875 & 12101.2455396093 & 127.558098870692 \tabularnewline
Winsorized Mean ( 13 / 24 ) & 1547644.58333333 & 10967.1185065699 & 141.116792200815 \tabularnewline
Winsorized Mean ( 14 / 24 ) & 1547120.75 & 10890.5674385546 & 142.060618854709 \tabularnewline
Winsorized Mean ( 15 / 24 ) & 1547647.625 & 10634.8195258773 & 145.526458745649 \tabularnewline
Winsorized Mean ( 16 / 24 ) & 1547036.29166667 & 10190.570564581 & 151.81056662751 \tabularnewline
Winsorized Mean ( 17 / 24 ) & 1553935.93055556 & 8962.99155308775 & 173.372464020701 \tabularnewline
Winsorized Mean ( 18 / 24 ) & 1554052.18055556 & 8870.91456418872 & 175.185114151494 \tabularnewline
Winsorized Mean ( 19 / 24 ) & 1556637.23611111 & 8269.14873702797 & 188.246370408205 \tabularnewline
Winsorized Mean ( 20 / 24 ) & 1558251.68055556 & 7984.80603453617 & 195.152101856419 \tabularnewline
Winsorized Mean ( 21 / 24 ) & 1558705.51388889 & 7276.29845152804 & 214.216819756968 \tabularnewline
Winsorized Mean ( 22 / 24 ) & 1554790.43055556 & 6227.79116836672 & 249.653591220739 \tabularnewline
Winsorized Mean ( 23 / 24 ) & 1555961.83333333 & 6051.51538345797 & 257.119371717473 \tabularnewline
Winsorized Mean ( 24 / 24 ) & 1556968.5 & 5510.1963745116 & 282.561345218482 \tabularnewline
Trimmed Mean ( 1 / 24 ) & 1504497.25714286 & 35538.9363977935 & 42.3337727472414 \tabularnewline
Trimmed Mean ( 2 / 24 ) & 1503209.82352941 & 33356.0889506653 & 45.065529887293 \tabularnewline
Trimmed Mean ( 3 / 24 ) & 1503081.90909091 & 31300.7792819702 & 48.0205906552848 \tabularnewline
Trimmed Mean ( 4 / 24 ) & 1503270.859375 & 29093.969405323 & 51.6695002470156 \tabularnewline
Trimmed Mean ( 5 / 24 ) & 1505367.51612903 & 27150.5400163252 & 55.4452145417321 \tabularnewline
Trimmed Mean ( 6 / 24 ) & 1510329.73333333 & 25621.8015429466 & 58.9470545543708 \tabularnewline
Trimmed Mean ( 7 / 24 ) & 1516851.05172414 & 24028.777747064 & 63.1264339656009 \tabularnewline
Trimmed Mean ( 8 / 24 ) & 1523674.42857143 & 22208.8913633890 & 68.6065055495376 \tabularnewline
Trimmed Mean ( 9 / 24 ) & 1531048.24074074 & 19935.4862441229 & 76.8001453283892 \tabularnewline
Trimmed Mean ( 10 / 24 ) & 1539077.30769231 & 17127.9511805614 & 89.8576421352144 \tabularnewline
Trimmed Mean ( 11 / 24 ) & 1547443.94 & 13404.3921795199 & 115.443051745702 \tabularnewline
Trimmed Mean ( 12 / 24 ) & 1552852.3125 & 10905.4295615996 & 142.392585613310 \tabularnewline
Trimmed Mean ( 13 / 24 ) & 1554057.58695652 & 10488.0506167124 & 148.174112020415 \tabularnewline
Trimmed Mean ( 14 / 24 ) & 1554864.81818182 & 10221.1352083530 & 152.122517361000 \tabularnewline
Trimmed Mean ( 15 / 24 ) & 1555813.07142857 & 9880.97312671024 & 157.455450134046 \tabularnewline
Trimmed Mean ( 16 / 24 ) & 1556792.925 & 9487.87142088333 & 164.082422277921 \tabularnewline
Trimmed Mean ( 17 / 24 ) & 1557948.31578947 & 9065.48091321781 & 171.85501030816 \tabularnewline
Trimmed Mean ( 18 / 24 ) & 1558420.36111111 & 8824.24299529002 & 176.606691581694 \tabularnewline
Trimmed Mean ( 19 / 24 ) & 1558934.26470588 & 8503.39718453233 & 183.330759562964 \tabularnewline
Trimmed Mean ( 20 / 24 ) & 1559206.28125 & 8217.02909166169 & 189.753043813879 \tabularnewline
Trimmed Mean ( 21 / 24 ) & 1559320.83333333 & 7880.45633693586 & 197.871895568378 \tabularnewline
Trimmed Mean ( 22 / 24 ) & 1559396.17857143 & 7603.90977962322 & 205.078206313055 \tabularnewline
Trimmed Mean ( 23 / 24 ) & 1559975.92307692 & 7504.65605093533 & 207.867744036384 \tabularnewline
Trimmed Mean ( 24 / 24 ) & 1560499.5 & 7372.48604389261 & 211.665304038483 \tabularnewline
Median & 1566634 &  &  \tabularnewline
Midrange & 1556554.5 &  &  \tabularnewline
Midmean - Weighted Average at Xnp & 1555665.45945946 &  &  \tabularnewline
Midmean - Weighted Average at X(n+1)p & 1558420.36111111 &  &  \tabularnewline
Midmean - Empirical Distribution Function & 1555665.45945946 &  &  \tabularnewline
Midmean - Empirical Distribution Function - Averaging & 1558420.36111111 &  &  \tabularnewline
Midmean - Empirical Distribution Function - Interpolation & 1558420.36111111 &  &  \tabularnewline
Midmean - Closest Observation & 1555665.45945946 &  &  \tabularnewline
Midmean - True Basic - Statistics Graphics Toolkit & 1558420.36111111 &  &  \tabularnewline
Midmean - MS Excel (old versions) & 1557948.31578947 &  &  \tabularnewline
Number of observations & 72 &  &  \tabularnewline
\hline
\end{tabular}
%Source: https://freestatistics.org/blog/index.php?pk=39736&T=1

[TABLE]
[ROW][C]Central Tendency - Ungrouped Data[/C][/ROW]
[ROW][C]Measure[/C][C]Value[/C][C]S.E.[/C][C]Value/S.E.[/C][/ROW]
[ROW][C]Arithmetic Mean[/C][C]1505943.29166667[/C][C]37592.0303406872[/C][C]40.0601744044862[/C][/ROW]
[ROW][C]Geometric Mean[/C][C]1467952.80173725[/C][C][/C][C][/C][/ROW]
[ROW][C]Harmonic Mean[/C][C]1424111.76858946[/C][C][/C][C][/C][/ROW]
[ROW][C]Quadratic Mean[/C][C]1538895.58145458[/C][C][/C][C][/C][/ROW]
[ROW][C]Winsorized Mean ( 1 / 24 )[/C][C]1505713.16666667[/C][C]37350.0632824714[/C][C]40.3135372296225[/C][/ROW]
[ROW][C]Winsorized Mean ( 2 / 24 )[/C][C]1503444.33333333[/C][C]36475.2895633260[/C][C]41.2181603307946[/C][/ROW]
[ROW][C]Winsorized Mean ( 3 / 24 )[/C][C]1502578.04166667[/C][C]35859.4556351121[/C][C]41.9018642378777[/C][/ROW]
[ROW][C]Winsorized Mean ( 4 / 24 )[/C][C]1496049.04166667[/C][C]33996.1577495080[/C][C]44.0064154511201[/C][/ROW]
[ROW][C]Winsorized Mean ( 5 / 24 )[/C][C]1484691.61111111[/C][C]31491.4995516436[/C][C]47.1457895701769[/C][/ROW]
[ROW][C]Winsorized Mean ( 6 / 24 )[/C][C]1478810.02777778[/C][C]30412.5566053217[/C][C]48.6249823376904[/C][/ROW]
[ROW][C]Winsorized Mean ( 7 / 24 )[/C][C]1479701.55555556[/C][C]29731.5941538285[/C][C]49.7686584816044[/C][/ROW]
[ROW][C]Winsorized Mean ( 8 / 24 )[/C][C]1479431.55555556[/C][C]29366.8013203995[/C][C]50.3776880367245[/C][/ROW]
[ROW][C]Winsorized Mean ( 9 / 24 )[/C][C]1478859.30555556[/C][C]28478.3355676571[/C][C]51.9292745196492[/C][/ROW]
[ROW][C]Winsorized Mean ( 10 / 24 )[/C][C]1480975.69444444[/C][C]27542.5820876302[/C][C]53.7704014000043[/C][/ROW]
[ROW][C]Winsorized Mean ( 11 / 24 )[/C][C]1507782.54166667[/C][C]20756.8834860717[/C][C]72.6401216578788[/C][/ROW]
[ROW][C]Winsorized Mean ( 12 / 24 )[/C][C]1543611.875[/C][C]12101.2455396093[/C][C]127.558098870692[/C][/ROW]
[ROW][C]Winsorized Mean ( 13 / 24 )[/C][C]1547644.58333333[/C][C]10967.1185065699[/C][C]141.116792200815[/C][/ROW]
[ROW][C]Winsorized Mean ( 14 / 24 )[/C][C]1547120.75[/C][C]10890.5674385546[/C][C]142.060618854709[/C][/ROW]
[ROW][C]Winsorized Mean ( 15 / 24 )[/C][C]1547647.625[/C][C]10634.8195258773[/C][C]145.526458745649[/C][/ROW]
[ROW][C]Winsorized Mean ( 16 / 24 )[/C][C]1547036.29166667[/C][C]10190.570564581[/C][C]151.81056662751[/C][/ROW]
[ROW][C]Winsorized Mean ( 17 / 24 )[/C][C]1553935.93055556[/C][C]8962.99155308775[/C][C]173.372464020701[/C][/ROW]
[ROW][C]Winsorized Mean ( 18 / 24 )[/C][C]1554052.18055556[/C][C]8870.91456418872[/C][C]175.185114151494[/C][/ROW]
[ROW][C]Winsorized Mean ( 19 / 24 )[/C][C]1556637.23611111[/C][C]8269.14873702797[/C][C]188.246370408205[/C][/ROW]
[ROW][C]Winsorized Mean ( 20 / 24 )[/C][C]1558251.68055556[/C][C]7984.80603453617[/C][C]195.152101856419[/C][/ROW]
[ROW][C]Winsorized Mean ( 21 / 24 )[/C][C]1558705.51388889[/C][C]7276.29845152804[/C][C]214.216819756968[/C][/ROW]
[ROW][C]Winsorized Mean ( 22 / 24 )[/C][C]1554790.43055556[/C][C]6227.79116836672[/C][C]249.653591220739[/C][/ROW]
[ROW][C]Winsorized Mean ( 23 / 24 )[/C][C]1555961.83333333[/C][C]6051.51538345797[/C][C]257.119371717473[/C][/ROW]
[ROW][C]Winsorized Mean ( 24 / 24 )[/C][C]1556968.5[/C][C]5510.1963745116[/C][C]282.561345218482[/C][/ROW]
[ROW][C]Trimmed Mean ( 1 / 24 )[/C][C]1504497.25714286[/C][C]35538.9363977935[/C][C]42.3337727472414[/C][/ROW]
[ROW][C]Trimmed Mean ( 2 / 24 )[/C][C]1503209.82352941[/C][C]33356.0889506653[/C][C]45.065529887293[/C][/ROW]
[ROW][C]Trimmed Mean ( 3 / 24 )[/C][C]1503081.90909091[/C][C]31300.7792819702[/C][C]48.0205906552848[/C][/ROW]
[ROW][C]Trimmed Mean ( 4 / 24 )[/C][C]1503270.859375[/C][C]29093.969405323[/C][C]51.6695002470156[/C][/ROW]
[ROW][C]Trimmed Mean ( 5 / 24 )[/C][C]1505367.51612903[/C][C]27150.5400163252[/C][C]55.4452145417321[/C][/ROW]
[ROW][C]Trimmed Mean ( 6 / 24 )[/C][C]1510329.73333333[/C][C]25621.8015429466[/C][C]58.9470545543708[/C][/ROW]
[ROW][C]Trimmed Mean ( 7 / 24 )[/C][C]1516851.05172414[/C][C]24028.777747064[/C][C]63.1264339656009[/C][/ROW]
[ROW][C]Trimmed Mean ( 8 / 24 )[/C][C]1523674.42857143[/C][C]22208.8913633890[/C][C]68.6065055495376[/C][/ROW]
[ROW][C]Trimmed Mean ( 9 / 24 )[/C][C]1531048.24074074[/C][C]19935.4862441229[/C][C]76.8001453283892[/C][/ROW]
[ROW][C]Trimmed Mean ( 10 / 24 )[/C][C]1539077.30769231[/C][C]17127.9511805614[/C][C]89.8576421352144[/C][/ROW]
[ROW][C]Trimmed Mean ( 11 / 24 )[/C][C]1547443.94[/C][C]13404.3921795199[/C][C]115.443051745702[/C][/ROW]
[ROW][C]Trimmed Mean ( 12 / 24 )[/C][C]1552852.3125[/C][C]10905.4295615996[/C][C]142.392585613310[/C][/ROW]
[ROW][C]Trimmed Mean ( 13 / 24 )[/C][C]1554057.58695652[/C][C]10488.0506167124[/C][C]148.174112020415[/C][/ROW]
[ROW][C]Trimmed Mean ( 14 / 24 )[/C][C]1554864.81818182[/C][C]10221.1352083530[/C][C]152.122517361000[/C][/ROW]
[ROW][C]Trimmed Mean ( 15 / 24 )[/C][C]1555813.07142857[/C][C]9880.97312671024[/C][C]157.455450134046[/C][/ROW]
[ROW][C]Trimmed Mean ( 16 / 24 )[/C][C]1556792.925[/C][C]9487.87142088333[/C][C]164.082422277921[/C][/ROW]
[ROW][C]Trimmed Mean ( 17 / 24 )[/C][C]1557948.31578947[/C][C]9065.48091321781[/C][C]171.85501030816[/C][/ROW]
[ROW][C]Trimmed Mean ( 18 / 24 )[/C][C]1558420.36111111[/C][C]8824.24299529002[/C][C]176.606691581694[/C][/ROW]
[ROW][C]Trimmed Mean ( 19 / 24 )[/C][C]1558934.26470588[/C][C]8503.39718453233[/C][C]183.330759562964[/C][/ROW]
[ROW][C]Trimmed Mean ( 20 / 24 )[/C][C]1559206.28125[/C][C]8217.02909166169[/C][C]189.753043813879[/C][/ROW]
[ROW][C]Trimmed Mean ( 21 / 24 )[/C][C]1559320.83333333[/C][C]7880.45633693586[/C][C]197.871895568378[/C][/ROW]
[ROW][C]Trimmed Mean ( 22 / 24 )[/C][C]1559396.17857143[/C][C]7603.90977962322[/C][C]205.078206313055[/C][/ROW]
[ROW][C]Trimmed Mean ( 23 / 24 )[/C][C]1559975.92307692[/C][C]7504.65605093533[/C][C]207.867744036384[/C][/ROW]
[ROW][C]Trimmed Mean ( 24 / 24 )[/C][C]1560499.5[/C][C]7372.48604389261[/C][C]211.665304038483[/C][/ROW]
[ROW][C]Median[/C][C]1566634[/C][C][/C][C][/C][/ROW]
[ROW][C]Midrange[/C][C]1556554.5[/C][C][/C][C][/C][/ROW]
[ROW][C]Midmean - Weighted Average at Xnp[/C][C]1555665.45945946[/C][C][/C][C][/C][/ROW]
[ROW][C]Midmean - Weighted Average at X(n+1)p[/C][C]1558420.36111111[/C][C][/C][C][/C][/ROW]
[ROW][C]Midmean - Empirical Distribution Function[/C][C]1555665.45945946[/C][C][/C][C][/C][/ROW]
[ROW][C]Midmean - Empirical Distribution Function - Averaging[/C][C]1558420.36111111[/C][C][/C][C][/C][/ROW]
[ROW][C]Midmean - Empirical Distribution Function - Interpolation[/C][C]1558420.36111111[/C][C][/C][C][/C][/ROW]
[ROW][C]Midmean - Closest Observation[/C][C]1555665.45945946[/C][C][/C][C][/C][/ROW]
[ROW][C]Midmean - True Basic - Statistics Graphics Toolkit[/C][C]1558420.36111111[/C][C][/C][C][/C][/ROW]
[ROW][C]Midmean - MS Excel (old versions)[/C][C]1557948.31578947[/C][C][/C][C][/C][/ROW]
[ROW][C]Number of observations[/C][C]72[/C][C][/C][C][/C][/ROW]
[/TABLE]
Source: https://freestatistics.org/blog/index.php?pk=39736&T=1

Globally Unique Identifier (entire table): ba.freestatistics.org/blog/index.php?pk=39736&T=1

As an alternative you can also use a QR Code:  

The GUIDs for individual cells are displayed in the table below:

Central Tendency - Ungrouped Data
MeasureValueS.E.Value/S.E.
Arithmetic Mean1505943.2916666737592.030340687240.0601744044862
Geometric Mean1467952.80173725
Harmonic Mean1424111.76858946
Quadratic Mean1538895.58145458
Winsorized Mean ( 1 / 24 )1505713.1666666737350.063282471440.3135372296225
Winsorized Mean ( 2 / 24 )1503444.3333333336475.289563326041.2181603307946
Winsorized Mean ( 3 / 24 )1502578.0416666735859.455635112141.9018642378777
Winsorized Mean ( 4 / 24 )1496049.0416666733996.157749508044.0064154511201
Winsorized Mean ( 5 / 24 )1484691.6111111131491.499551643647.1457895701769
Winsorized Mean ( 6 / 24 )1478810.0277777830412.556605321748.6249823376904
Winsorized Mean ( 7 / 24 )1479701.5555555629731.594153828549.7686584816044
Winsorized Mean ( 8 / 24 )1479431.5555555629366.801320399550.3776880367245
Winsorized Mean ( 9 / 24 )1478859.3055555628478.335567657151.9292745196492
Winsorized Mean ( 10 / 24 )1480975.6944444427542.582087630253.7704014000043
Winsorized Mean ( 11 / 24 )1507782.5416666720756.883486071772.6401216578788
Winsorized Mean ( 12 / 24 )1543611.87512101.2455396093127.558098870692
Winsorized Mean ( 13 / 24 )1547644.5833333310967.1185065699141.116792200815
Winsorized Mean ( 14 / 24 )1547120.7510890.5674385546142.060618854709
Winsorized Mean ( 15 / 24 )1547647.62510634.8195258773145.526458745649
Winsorized Mean ( 16 / 24 )1547036.2916666710190.570564581151.81056662751
Winsorized Mean ( 17 / 24 )1553935.930555568962.99155308775173.372464020701
Winsorized Mean ( 18 / 24 )1554052.180555568870.91456418872175.185114151494
Winsorized Mean ( 19 / 24 )1556637.236111118269.14873702797188.246370408205
Winsorized Mean ( 20 / 24 )1558251.680555567984.80603453617195.152101856419
Winsorized Mean ( 21 / 24 )1558705.513888897276.29845152804214.216819756968
Winsorized Mean ( 22 / 24 )1554790.430555566227.79116836672249.653591220739
Winsorized Mean ( 23 / 24 )1555961.833333336051.51538345797257.119371717473
Winsorized Mean ( 24 / 24 )1556968.55510.1963745116282.561345218482
Trimmed Mean ( 1 / 24 )1504497.2571428635538.936397793542.3337727472414
Trimmed Mean ( 2 / 24 )1503209.8235294133356.088950665345.065529887293
Trimmed Mean ( 3 / 24 )1503081.9090909131300.779281970248.0205906552848
Trimmed Mean ( 4 / 24 )1503270.85937529093.96940532351.6695002470156
Trimmed Mean ( 5 / 24 )1505367.5161290327150.540016325255.4452145417321
Trimmed Mean ( 6 / 24 )1510329.7333333325621.801542946658.9470545543708
Trimmed Mean ( 7 / 24 )1516851.0517241424028.77774706463.1264339656009
Trimmed Mean ( 8 / 24 )1523674.4285714322208.891363389068.6065055495376
Trimmed Mean ( 9 / 24 )1531048.2407407419935.486244122976.8001453283892
Trimmed Mean ( 10 / 24 )1539077.3076923117127.951180561489.8576421352144
Trimmed Mean ( 11 / 24 )1547443.9413404.3921795199115.443051745702
Trimmed Mean ( 12 / 24 )1552852.312510905.4295615996142.392585613310
Trimmed Mean ( 13 / 24 )1554057.5869565210488.0506167124148.174112020415
Trimmed Mean ( 14 / 24 )1554864.8181818210221.1352083530152.122517361000
Trimmed Mean ( 15 / 24 )1555813.071428579880.97312671024157.455450134046
Trimmed Mean ( 16 / 24 )1556792.9259487.87142088333164.082422277921
Trimmed Mean ( 17 / 24 )1557948.315789479065.48091321781171.85501030816
Trimmed Mean ( 18 / 24 )1558420.361111118824.24299529002176.606691581694
Trimmed Mean ( 19 / 24 )1558934.264705888503.39718453233183.330759562964
Trimmed Mean ( 20 / 24 )1559206.281258217.02909166169189.753043813879
Trimmed Mean ( 21 / 24 )1559320.833333337880.45633693586197.871895568378
Trimmed Mean ( 22 / 24 )1559396.178571437603.90977962322205.078206313055
Trimmed Mean ( 23 / 24 )1559975.923076927504.65605093533207.867744036384
Trimmed Mean ( 24 / 24 )1560499.57372.48604389261211.665304038483
Median1566634
Midrange1556554.5
Midmean - Weighted Average at Xnp1555665.45945946
Midmean - Weighted Average at X(n+1)p1558420.36111111
Midmean - Empirical Distribution Function1555665.45945946
Midmean - Empirical Distribution Function - Averaging1558420.36111111
Midmean - Empirical Distribution Function - Interpolation1558420.36111111
Midmean - Closest Observation1555665.45945946
Midmean - True Basic - Statistics Graphics Toolkit1558420.36111111
Midmean - MS Excel (old versions)1557948.31578947
Number of observations72


Parameters (Session):
Parameters (R input):
R code (references can be found in the software module):
geomean <- function(x) {
return(exp(mean(log(x))))
}
harmean <- function(x) {
return(1/mean(1/x))
}
quamean <- function(x) {
return(sqrt(mean(x*x)))
}
winmean <- function(x) {
x <-sort(x[!is.na(x)])
n<-length(x)
denom <- 3
nodenom <- n/denom
if (nodenom>40) denom <- n/40
sqrtn = sqrt(n)
roundnodenom = floor(nodenom)
win <- array(NA,dim=c(roundnodenom,2))
for (j in 1:roundnodenom) {
win[j,1] <- (j*x[j+1]+sum(x[(j+1):(n-j)])+j*x[n-j])/n
win[j,2] <- sd(c(rep(x[j+1],j),x[(j+1):(n-j)],rep(x[n-j],j)))/sqrtn
}
return(win)
}
trimean <- function(x) {
x <-sort(x[!is.na(x)])
n<-length(x)
denom <- 3
nodenom <- n/denom
if (nodenom>40) denom <- n/40
sqrtn = sqrt(n)
roundnodenom = floor(nodenom)
tri <- array(NA,dim=c(roundnodenom,2))
for (j in 1:roundnodenom) {
tri[j,1] <- mean(x,trim=j/n)
tri[j,2] <- sd(x[(j+1):(n-j)]) / sqrt(n-j*2)
}
return(tri)
}
midrange <- function(x) {
return((max(x)+min(x))/2)
}
q1 <- function(data,n,p,i,f) {
np <- n*p;
i <<- floor(np)
f <<- np - i
qvalue <- (1-f)*data[i] + f*data[i+1]
}
q2 <- function(data,n,p,i,f) {
np <- (n+1)*p
i <<- floor(np)
f <<- np - i
qvalue <- (1-f)*data[i] + f*data[i+1]
}
q3 <- function(data,n,p,i,f) {
np <- n*p
i <<- floor(np)
f <<- np - i
if (f==0) {
qvalue <- data[i]
} else {
qvalue <- data[i+1]
}
}
q4 <- function(data,n,p,i,f) {
np <- n*p
i <<- floor(np)
f <<- np - i
if (f==0) {
qvalue <- (data[i]+data[i+1])/2
} else {
qvalue <- data[i+1]
}
}
q5 <- function(data,n,p,i,f) {
np <- (n-1)*p
i <<- floor(np)
f <<- np - i
if (f==0) {
qvalue <- data[i+1]
} else {
qvalue <- data[i+1] + f*(data[i+2]-data[i+1])
}
}
q6 <- function(data,n,p,i,f) {
np <- n*p+0.5
i <<- floor(np)
f <<- np - i
qvalue <- data[i]
}
q7 <- function(data,n,p,i,f) {
np <- (n+1)*p
i <<- floor(np)
f <<- np - i
if (f==0) {
qvalue <- data[i]
} else {
qvalue <- f*data[i] + (1-f)*data[i+1]
}
}
q8 <- function(data,n,p,i,f) {
np <- (n+1)*p
i <<- floor(np)
f <<- np - i
if (f==0) {
qvalue <- data[i]
} else {
if (f == 0.5) {
qvalue <- (data[i]+data[i+1])/2
} else {
if (f < 0.5) {
qvalue <- data[i]
} else {
qvalue <- data[i+1]
}
}
}
}
midmean <- function(x,def) {
x <-sort(x[!is.na(x)])
n<-length(x)
if (def==1) {
qvalue1 <- q1(x,n,0.25,i,f)
qvalue3 <- q1(x,n,0.75,i,f)
}
if (def==2) {
qvalue1 <- q2(x,n,0.25,i,f)
qvalue3 <- q2(x,n,0.75,i,f)
}
if (def==3) {
qvalue1 <- q3(x,n,0.25,i,f)
qvalue3 <- q3(x,n,0.75,i,f)
}
if (def==4) {
qvalue1 <- q4(x,n,0.25,i,f)
qvalue3 <- q4(x,n,0.75,i,f)
}
if (def==5) {
qvalue1 <- q5(x,n,0.25,i,f)
qvalue3 <- q5(x,n,0.75,i,f)
}
if (def==6) {
qvalue1 <- q6(x,n,0.25,i,f)
qvalue3 <- q6(x,n,0.75,i,f)
}
if (def==7) {
qvalue1 <- q7(x,n,0.25,i,f)
qvalue3 <- q7(x,n,0.75,i,f)
}
if (def==8) {
qvalue1 <- q8(x,n,0.25,i,f)
qvalue3 <- q8(x,n,0.75,i,f)
}
midm <- 0
myn <- 0
roundno4 <- round(n/4)
round3no4 <- round(3*n/4)
for (i in 1:n) {
if ((x[i]>=qvalue1) & (x[i]<=qvalue3)){
midm = midm + x[i]
myn = myn + 1
}
}
midm = midm / myn
return(midm)
}
(arm <- mean(x))
sqrtn <- sqrt(length(x))
(armse <- sd(x) / sqrtn)
(armose <- arm / armse)
(geo <- geomean(x))
(har <- harmean(x))
(qua <- quamean(x))
(win <- winmean(x))
(tri <- trimean(x))
(midr <- midrange(x))
midm <- array(NA,dim=8)
for (j in 1:8) midm[j] <- midmean(x,j)
midm
bitmap(file='test1.png')
lb <- win[,1] - 2*win[,2]
ub <- win[,1] + 2*win[,2]
if ((ylimmin == '') | (ylimmax == '')) plot(win[,1],type='b',main=main, xlab='j', pch=19, ylab='Winsorized Mean(j/n)', ylim=c(min(lb),max(ub))) else plot(win[,1],type='l',main=main, xlab='j', pch=19, ylab='Winsorized Mean(j/n)', ylim=c(ylimmin,ylimmax))
lines(ub,lty=3)
lines(lb,lty=3)
grid()
dev.off()
bitmap(file='test2.png')
lb <- tri[,1] - 2*tri[,2]
ub <- tri[,1] + 2*tri[,2]
if ((ylimmin == '') | (ylimmax == '')) plot(tri[,1],type='b',main=main, xlab='j', pch=19, ylab='Trimmed Mean(j/n)', ylim=c(min(lb),max(ub))) else plot(tri[,1],type='l',main=main, xlab='j', pch=19, ylab='Trimmed Mean(j/n)', ylim=c(ylimmin,ylimmax))
lines(ub,lty=3)
lines(lb,lty=3)
grid()
dev.off()
load(file='createtable')
a<-table.start()
a<-table.row.start(a)
a<-table.element(a,'Central Tendency - Ungrouped Data',4,TRUE)
a<-table.row.end(a)
a<-table.row.start(a)
a<-table.element(a,'Measure',header=TRUE)
a<-table.element(a,'Value',header=TRUE)
a<-table.element(a,'S.E.',header=TRUE)
a<-table.element(a,'Value/S.E.',header=TRUE)
a<-table.row.end(a)
a<-table.row.start(a)
a<-table.element(a,hyperlink('arithmetic_mean.htm', 'Arithmetic Mean', 'click to view the definition of the Arithmetic Mean'),header=TRUE)
a<-table.element(a,arm)
a<-table.element(a,hyperlink('arithmetic_mean_standard_error.htm', armse, 'click to view the definition of the Standard Error of the Arithmetic Mean'))
a<-table.element(a,armose)
a<-table.row.end(a)
a<-table.row.start(a)
a<-table.element(a,hyperlink('geometric_mean.htm', 'Geometric Mean', 'click to view the definition of the Geometric Mean'),header=TRUE)
a<-table.element(a,geo)
a<-table.element(a,'')
a<-table.row.end(a)
a<-table.row.start(a)
a<-table.element(a,hyperlink('harmonic_mean.htm', 'Harmonic Mean', 'click to view the definition of the Harmonic Mean'),header=TRUE)
a<-table.element(a,har)
a<-table.element(a,'')
a<-table.row.end(a)
a<-table.row.start(a)
a<-table.element(a,hyperlink('quadratic_mean.htm', 'Quadratic Mean', 'click to view the definition of the Quadratic Mean'),header=TRUE)
a<-table.element(a,qua)
a<-table.element(a,'')
a<-table.row.end(a)
for (j in 1:length(win[,1])) {
a<-table.row.start(a)
mylabel <- paste('Winsorized Mean (',j)
mylabel <- paste(mylabel,'/')
mylabel <- paste(mylabel,length(win[,1]))
mylabel <- paste(mylabel,')')
a<-table.element(a,hyperlink('winsorized_mean.htm', mylabel, 'click to view the definition of the Winsorized Mean'),header=TRUE)
a<-table.element(a,win[j,1])
a<-table.element(a,win[j,2])
a<-table.element(a,win[j,1]/win[j,2])
a<-table.row.end(a)
}
for (j in 1:length(tri[,1])) {
a<-table.row.start(a)
mylabel <- paste('Trimmed Mean (',j)
mylabel <- paste(mylabel,'/')
mylabel <- paste(mylabel,length(tri[,1]))
mylabel <- paste(mylabel,')')
a<-table.element(a,hyperlink('arithmetic_mean.htm', mylabel, 'click to view the definition of the Trimmed Mean'),header=TRUE)
a<-table.element(a,tri[j,1])
a<-table.element(a,tri[j,2])
a<-table.element(a,tri[j,1]/tri[j,2])
a<-table.row.end(a)
}
a<-table.row.start(a)
a<-table.element(a,hyperlink('median_1.htm', 'Median', 'click to view the definition of the Median'),header=TRUE)
a<-table.element(a,median(x))
a<-table.element(a,'')
a<-table.row.end(a)
a<-table.row.start(a)
a<-table.element(a,hyperlink('midrange.htm', 'Midrange', 'click to view the definition of the Midrange'),header=TRUE)
a<-table.element(a,midr)
a<-table.element(a,'')
a<-table.row.end(a)
a<-table.row.start(a)
mymid <- hyperlink('midmean.htm', 'Midmean', 'click to view the definition of the Midmean')
mylabel <- paste(mymid,hyperlink('method_1.htm','Weighted Average at Xnp',''),sep=' - ')
a<-table.element(a,mylabel,header=TRUE)
a<-table.element(a,midm[1])
a<-table.element(a,'')
a<-table.row.end(a)
a<-table.row.start(a)
mymid <- hyperlink('midmean.htm', 'Midmean', 'click to view the definition of the Midmean')
mylabel <- paste(mymid,hyperlink('method_2.htm','Weighted Average at X(n+1)p',''),sep=' - ')
a<-table.element(a,mylabel,header=TRUE)
a<-table.element(a,midm[2])
a<-table.element(a,'')
a<-table.row.end(a)
a<-table.row.start(a)
mymid <- hyperlink('midmean.htm', 'Midmean', 'click to view the definition of the Midmean')
mylabel <- paste(mymid,hyperlink('method_3.htm','Empirical Distribution Function',''),sep=' - ')
a<-table.element(a,mylabel,header=TRUE)
a<-table.element(a,midm[3])
a<-table.element(a,'')
a<-table.row.end(a)
a<-table.row.start(a)
mymid <- hyperlink('midmean.htm', 'Midmean', 'click to view the definition of the Midmean')
mylabel <- paste(mymid,hyperlink('method_4.htm','Empirical Distribution Function - Averaging',''),sep=' - ')
a<-table.element(a,mylabel,header=TRUE)
a<-table.element(a,midm[4])
a<-table.element(a,'')
a<-table.row.end(a)
a<-table.row.start(a)
mymid <- hyperlink('midmean.htm', 'Midmean', 'click to view the definition of the Midmean')
mylabel <- paste(mymid,hyperlink('method_5.htm','Empirical Distribution Function - Interpolation',''),sep=' - ')
a<-table.element(a,mylabel,header=TRUE)
a<-table.element(a,midm[5])
a<-table.element(a,'')
a<-table.row.end(a)
a<-table.row.start(a)
mymid <- hyperlink('midmean.htm', 'Midmean', 'click to view the definition of the Midmean')
mylabel <- paste(mymid,hyperlink('method_6.htm','Closest Observation',''),sep=' - ')
a<-table.element(a,mylabel,header=TRUE)
a<-table.element(a,midm[6])
a<-table.element(a,'')
a<-table.row.end(a)
a<-table.row.start(a)
mymid <- hyperlink('midmean.htm', 'Midmean', 'click to view the definition of the Midmean')
mylabel <- paste(mymid,hyperlink('method_7.htm','True Basic - Statistics Graphics Toolkit',''),sep=' - ')
a<-table.element(a,mylabel,header=TRUE)
a<-table.element(a,midm[7])
a<-table.element(a,'')
a<-table.row.end(a)
a<-table.row.start(a)
mymid <- hyperlink('midmean.htm', 'Midmean', 'click to view the definition of the Midmean')
mylabel <- paste(mymid,hyperlink('method_8.htm','MS Excel (old versions)',''),sep=' - ')
a<-table.element(a,mylabel,header=TRUE)
a<-table.element(a,midm[8])
a<-table.element(a,'')
a<-table.row.end(a)
a<-table.row.start(a)
a<-table.element(a,'Number of observations',header=TRUE)
a<-table.element(a,length(x))
a<-table.element(a,'')
a<-table.row.end(a)
a<-table.end(a)
table.save(a,file='mytable.tab')