Free Statistics

of Irreproducible Research!

Author's title

Author*Unverified author*
R Software Modulerwasp_autocorrelation.wasp
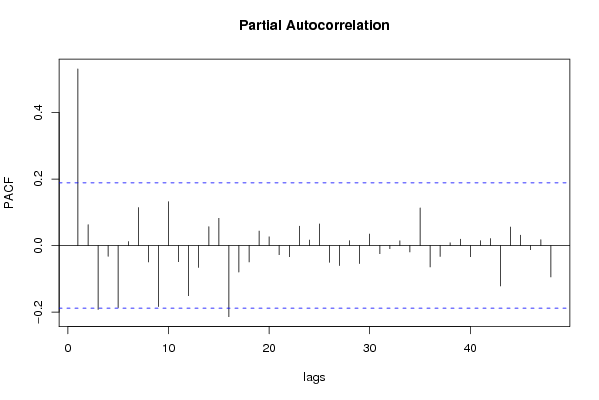
Title produced by software(Partial) Autocorrelation Function
Date of computationThu, 07 May 2009 08:35:08 -0600
Cite this page as followsStatistical Computations at FreeStatistics.org, Office for Research Development and Education, URL https://freestatistics.org/blog/index.php?v=date/2009/May/07/t1241706969pcdoz3nv9wqlr4l.htm/, Retrieved Tue, 07 May 2024 00:05:04 +0000
Statistical Computations at FreeStatistics.org, Office for Research Development and Education, URL https://freestatistics.org/blog/index.php?pk=39594, Retrieved Tue, 07 May 2024 00:05:04 +0000
QR Codes:

Original text written by user:
IsPrivate?No (this computation is public)
User-defined keywords
Estimated Impact152
Family? (F = Feedback message, R = changed R code, M = changed R Module, P = changed Parameters, D = changed Data)
-       [(Partial) Autocorrelation Function] [Autocorrelation z...] [2009-05-07 14:35:08] [e49ca66754ae41ce7288e597b92c4c3a] [Current]
Feedback Forum

Post a new message
Dataseries X:
88.6
95
96.3
83.3
96.9
103.4
99.3
103.8
113.4
111.5
114.2
90.6
90.8
96.4
90
92.1
97.2
95.1
88.5
91
90.5
75
66.3
66
68.4
70.6
83.9
90.1
90.6
87.1
90.8
94.1
99.8
96.8
87
96.3
107.1
115.2
106.1
89.5
91.3
97.6
100.7
104.6
94.7
101.8
102.5
105.3
110.3
109.8
117.3
118.8
131.3
125.9
133.1
147
145.8
164.4
149.8
137.7
151.7
156.8
180
180.4
170.4
191.6
199.5
218.2
217.5
205
194
199.3
219.3
211.1
215.2
240.2
242.2
240.7
255.4
253
218.2
203.7
205.6
215.6
188.5
202.9
214
230.3
230
241
259.6
247.8
270.3
289.7
322.7
315
320.2
329.5
360.6
382.2
435.4
464
468.8
403
351.6
252
188
146.5
152.9


Summary of computational transaction
Raw Inputview raw input (R code)
Raw Outputview raw output of R engine
Computing time1 seconds
R Server'Gwilym Jenkins' @ 72.249.127.135

\begin{tabular}{lllllllll}
\hline
Summary of computational transaction \tabularnewline
Raw Input & view raw input (R code)  \tabularnewline
Raw Output & view raw output of R engine  \tabularnewline
Computing time & 1 seconds \tabularnewline
R Server & 'Gwilym Jenkins' @ 72.249.127.135 \tabularnewline
\hline
\end{tabular}
%Source: https://freestatistics.org/blog/index.php?pk=39594&T=0

[TABLE]
[ROW][C]Summary of computational transaction[/C][/ROW]
[ROW][C]Raw Input[/C][C]view raw input (R code) [/C][/ROW]
[ROW][C]Raw Output[/C][C]view raw output of R engine [/C][/ROW]
[ROW][C]Computing time[/C][C]1 seconds[/C][/ROW]
[ROW][C]R Server[/C][C]'Gwilym Jenkins' @ 72.249.127.135[/C][/ROW]
[/TABLE]
Source: https://freestatistics.org/blog/index.php?pk=39594&T=0

Globally Unique Identifier (entire table): ba.freestatistics.org/blog/index.php?pk=39594&T=0

As an alternative you can also use a QR Code:  

The GUIDs for individual cells are displayed in the table below:

Summary of computational transaction
Raw Inputview raw input (R code)
Raw Outputview raw output of R engine
Computing time1 seconds
R Server'Gwilym Jenkins' @ 72.249.127.135


Autocorrelation Function
Time lag kACF(k)T-STATP-value
10.5316025.52460
20.327773.40630.000463
30.0592460.61570.269692
4-0.042307-0.43970.330529
5-0.214831-2.23260.01382
6-0.192218-1.99760.024138
7-0.095324-0.99060.16204
8-0.046321-0.48140.31561
9-0.117779-1.2240.111809
10-0.002683-0.02790.488904
11-0.01676-0.17420.431027
12-0.080774-0.83940.201541
13-0.159437-1.65690.050219
14-0.075054-0.780.218553
150.0024250.02520.489969
16-0.100168-1.0410.150105
17-0.099056-1.02940.152791
18-0.094303-0.980.164632
19-0.06374-0.66240.254563
20-0.058713-0.61020.271518
210.0184920.19220.423985
220.0795760.8270.205037
230.0960250.99790.160274
240.0680550.70720.240468
250.1608111.67120.048789
260.1052961.09430.138135
270.0314240.32660.372313
28-0.046217-0.48030.315991
29-0.053815-0.55930.288572
30-0.03593-0.37340.354793
31-0.058655-0.60960.271717
32-0.020487-0.21290.415902
330.0115760.12030.452232
34-0.002169-0.02250.491027
350.0708380.73620.231612
360.0472530.49110.312187
370.0377970.39280.347621
38-0.031049-0.32270.373783
39-0.043283-0.44980.326874
40-0.040664-0.42260.336718
41-0.039405-0.40950.341488
42-0.017286-0.17960.428887
43-0.068869-0.71570.237858
44-0.045487-0.47270.318686
45-0.005016-0.05210.479263
460.0229960.2390.405785
470.0532730.55360.290489
48-0.007403-0.07690.469408

\begin{tabular}{lllllllll}
\hline
Autocorrelation Function \tabularnewline
Time lag k & ACF(k) & T-STAT & P-value \tabularnewline
1 & 0.531602 & 5.5246 & 0 \tabularnewline
2 & 0.32777 & 3.4063 & 0.000463 \tabularnewline
3 & 0.059246 & 0.6157 & 0.269692 \tabularnewline
4 & -0.042307 & -0.4397 & 0.330529 \tabularnewline
5 & -0.214831 & -2.2326 & 0.01382 \tabularnewline
6 & -0.192218 & -1.9976 & 0.024138 \tabularnewline
7 & -0.095324 & -0.9906 & 0.16204 \tabularnewline
8 & -0.046321 & -0.4814 & 0.31561 \tabularnewline
9 & -0.117779 & -1.224 & 0.111809 \tabularnewline
10 & -0.002683 & -0.0279 & 0.488904 \tabularnewline
11 & -0.01676 & -0.1742 & 0.431027 \tabularnewline
12 & -0.080774 & -0.8394 & 0.201541 \tabularnewline
13 & -0.159437 & -1.6569 & 0.050219 \tabularnewline
14 & -0.075054 & -0.78 & 0.218553 \tabularnewline
15 & 0.002425 & 0.0252 & 0.489969 \tabularnewline
16 & -0.100168 & -1.041 & 0.150105 \tabularnewline
17 & -0.099056 & -1.0294 & 0.152791 \tabularnewline
18 & -0.094303 & -0.98 & 0.164632 \tabularnewline
19 & -0.06374 & -0.6624 & 0.254563 \tabularnewline
20 & -0.058713 & -0.6102 & 0.271518 \tabularnewline
21 & 0.018492 & 0.1922 & 0.423985 \tabularnewline
22 & 0.079576 & 0.827 & 0.205037 \tabularnewline
23 & 0.096025 & 0.9979 & 0.160274 \tabularnewline
24 & 0.068055 & 0.7072 & 0.240468 \tabularnewline
25 & 0.160811 & 1.6712 & 0.048789 \tabularnewline
26 & 0.105296 & 1.0943 & 0.138135 \tabularnewline
27 & 0.031424 & 0.3266 & 0.372313 \tabularnewline
28 & -0.046217 & -0.4803 & 0.315991 \tabularnewline
29 & -0.053815 & -0.5593 & 0.288572 \tabularnewline
30 & -0.03593 & -0.3734 & 0.354793 \tabularnewline
31 & -0.058655 & -0.6096 & 0.271717 \tabularnewline
32 & -0.020487 & -0.2129 & 0.415902 \tabularnewline
33 & 0.011576 & 0.1203 & 0.452232 \tabularnewline
34 & -0.002169 & -0.0225 & 0.491027 \tabularnewline
35 & 0.070838 & 0.7362 & 0.231612 \tabularnewline
36 & 0.047253 & 0.4911 & 0.312187 \tabularnewline
37 & 0.037797 & 0.3928 & 0.347621 \tabularnewline
38 & -0.031049 & -0.3227 & 0.373783 \tabularnewline
39 & -0.043283 & -0.4498 & 0.326874 \tabularnewline
40 & -0.040664 & -0.4226 & 0.336718 \tabularnewline
41 & -0.039405 & -0.4095 & 0.341488 \tabularnewline
42 & -0.017286 & -0.1796 & 0.428887 \tabularnewline
43 & -0.068869 & -0.7157 & 0.237858 \tabularnewline
44 & -0.045487 & -0.4727 & 0.318686 \tabularnewline
45 & -0.005016 & -0.0521 & 0.479263 \tabularnewline
46 & 0.022996 & 0.239 & 0.405785 \tabularnewline
47 & 0.053273 & 0.5536 & 0.290489 \tabularnewline
48 & -0.007403 & -0.0769 & 0.469408 \tabularnewline
\hline
\end{tabular}
%Source: https://freestatistics.org/blog/index.php?pk=39594&T=1

[TABLE]
[ROW][C]Autocorrelation Function[/C][/ROW]
[ROW][C]Time lag k[/C][C]ACF(k)[/C][C]T-STAT[/C][C]P-value[/C][/ROW]
[ROW][C]1[/C][C]0.531602[/C][C]5.5246[/C][C]0[/C][/ROW]
[ROW][C]2[/C][C]0.32777[/C][C]3.4063[/C][C]0.000463[/C][/ROW]
[ROW][C]3[/C][C]0.059246[/C][C]0.6157[/C][C]0.269692[/C][/ROW]
[ROW][C]4[/C][C]-0.042307[/C][C]-0.4397[/C][C]0.330529[/C][/ROW]
[ROW][C]5[/C][C]-0.214831[/C][C]-2.2326[/C][C]0.01382[/C][/ROW]
[ROW][C]6[/C][C]-0.192218[/C][C]-1.9976[/C][C]0.024138[/C][/ROW]
[ROW][C]7[/C][C]-0.095324[/C][C]-0.9906[/C][C]0.16204[/C][/ROW]
[ROW][C]8[/C][C]-0.046321[/C][C]-0.4814[/C][C]0.31561[/C][/ROW]
[ROW][C]9[/C][C]-0.117779[/C][C]-1.224[/C][C]0.111809[/C][/ROW]
[ROW][C]10[/C][C]-0.002683[/C][C]-0.0279[/C][C]0.488904[/C][/ROW]
[ROW][C]11[/C][C]-0.01676[/C][C]-0.1742[/C][C]0.431027[/C][/ROW]
[ROW][C]12[/C][C]-0.080774[/C][C]-0.8394[/C][C]0.201541[/C][/ROW]
[ROW][C]13[/C][C]-0.159437[/C][C]-1.6569[/C][C]0.050219[/C][/ROW]
[ROW][C]14[/C][C]-0.075054[/C][C]-0.78[/C][C]0.218553[/C][/ROW]
[ROW][C]15[/C][C]0.002425[/C][C]0.0252[/C][C]0.489969[/C][/ROW]
[ROW][C]16[/C][C]-0.100168[/C][C]-1.041[/C][C]0.150105[/C][/ROW]
[ROW][C]17[/C][C]-0.099056[/C][C]-1.0294[/C][C]0.152791[/C][/ROW]
[ROW][C]18[/C][C]-0.094303[/C][C]-0.98[/C][C]0.164632[/C][/ROW]
[ROW][C]19[/C][C]-0.06374[/C][C]-0.6624[/C][C]0.254563[/C][/ROW]
[ROW][C]20[/C][C]-0.058713[/C][C]-0.6102[/C][C]0.271518[/C][/ROW]
[ROW][C]21[/C][C]0.018492[/C][C]0.1922[/C][C]0.423985[/C][/ROW]
[ROW][C]22[/C][C]0.079576[/C][C]0.827[/C][C]0.205037[/C][/ROW]
[ROW][C]23[/C][C]0.096025[/C][C]0.9979[/C][C]0.160274[/C][/ROW]
[ROW][C]24[/C][C]0.068055[/C][C]0.7072[/C][C]0.240468[/C][/ROW]
[ROW][C]25[/C][C]0.160811[/C][C]1.6712[/C][C]0.048789[/C][/ROW]
[ROW][C]26[/C][C]0.105296[/C][C]1.0943[/C][C]0.138135[/C][/ROW]
[ROW][C]27[/C][C]0.031424[/C][C]0.3266[/C][C]0.372313[/C][/ROW]
[ROW][C]28[/C][C]-0.046217[/C][C]-0.4803[/C][C]0.315991[/C][/ROW]
[ROW][C]29[/C][C]-0.053815[/C][C]-0.5593[/C][C]0.288572[/C][/ROW]
[ROW][C]30[/C][C]-0.03593[/C][C]-0.3734[/C][C]0.354793[/C][/ROW]
[ROW][C]31[/C][C]-0.058655[/C][C]-0.6096[/C][C]0.271717[/C][/ROW]
[ROW][C]32[/C][C]-0.020487[/C][C]-0.2129[/C][C]0.415902[/C][/ROW]
[ROW][C]33[/C][C]0.011576[/C][C]0.1203[/C][C]0.452232[/C][/ROW]
[ROW][C]34[/C][C]-0.002169[/C][C]-0.0225[/C][C]0.491027[/C][/ROW]
[ROW][C]35[/C][C]0.070838[/C][C]0.7362[/C][C]0.231612[/C][/ROW]
[ROW][C]36[/C][C]0.047253[/C][C]0.4911[/C][C]0.312187[/C][/ROW]
[ROW][C]37[/C][C]0.037797[/C][C]0.3928[/C][C]0.347621[/C][/ROW]
[ROW][C]38[/C][C]-0.031049[/C][C]-0.3227[/C][C]0.373783[/C][/ROW]
[ROW][C]39[/C][C]-0.043283[/C][C]-0.4498[/C][C]0.326874[/C][/ROW]
[ROW][C]40[/C][C]-0.040664[/C][C]-0.4226[/C][C]0.336718[/C][/ROW]
[ROW][C]41[/C][C]-0.039405[/C][C]-0.4095[/C][C]0.341488[/C][/ROW]
[ROW][C]42[/C][C]-0.017286[/C][C]-0.1796[/C][C]0.428887[/C][/ROW]
[ROW][C]43[/C][C]-0.068869[/C][C]-0.7157[/C][C]0.237858[/C][/ROW]
[ROW][C]44[/C][C]-0.045487[/C][C]-0.4727[/C][C]0.318686[/C][/ROW]
[ROW][C]45[/C][C]-0.005016[/C][C]-0.0521[/C][C]0.479263[/C][/ROW]
[ROW][C]46[/C][C]0.022996[/C][C]0.239[/C][C]0.405785[/C][/ROW]
[ROW][C]47[/C][C]0.053273[/C][C]0.5536[/C][C]0.290489[/C][/ROW]
[ROW][C]48[/C][C]-0.007403[/C][C]-0.0769[/C][C]0.469408[/C][/ROW]
[/TABLE]
Source: https://freestatistics.org/blog/index.php?pk=39594&T=1

Globally Unique Identifier (entire table): ba.freestatistics.org/blog/index.php?pk=39594&T=1

As an alternative you can also use a QR Code:  

The GUIDs for individual cells are displayed in the table below:

Autocorrelation Function
Time lag kACF(k)T-STATP-value
10.5316025.52460
20.327773.40630.000463
30.0592460.61570.269692
4-0.042307-0.43970.330529
5-0.214831-2.23260.01382
6-0.192218-1.99760.024138
7-0.095324-0.99060.16204
8-0.046321-0.48140.31561
9-0.117779-1.2240.111809
10-0.002683-0.02790.488904
11-0.01676-0.17420.431027
12-0.080774-0.83940.201541
13-0.159437-1.65690.050219
14-0.075054-0.780.218553
150.0024250.02520.489969
16-0.100168-1.0410.150105
17-0.099056-1.02940.152791
18-0.094303-0.980.164632
19-0.06374-0.66240.254563
20-0.058713-0.61020.271518
210.0184920.19220.423985
220.0795760.8270.205037
230.0960250.99790.160274
240.0680550.70720.240468
250.1608111.67120.048789
260.1052961.09430.138135
270.0314240.32660.372313
28-0.046217-0.48030.315991
29-0.053815-0.55930.288572
30-0.03593-0.37340.354793
31-0.058655-0.60960.271717
32-0.020487-0.21290.415902
330.0115760.12030.452232
34-0.002169-0.02250.491027
350.0708380.73620.231612
360.0472530.49110.312187
370.0377970.39280.347621
38-0.031049-0.32270.373783
39-0.043283-0.44980.326874
40-0.040664-0.42260.336718
41-0.039405-0.40950.341488
42-0.017286-0.17960.428887
43-0.068869-0.71570.237858
44-0.045487-0.47270.318686
45-0.005016-0.05210.479263
460.0229960.2390.405785
470.0532730.55360.290489
48-0.007403-0.07690.469408


Partial Autocorrelation Function
Time lag kPACF(k)T-STATP-value
10.5316025.52460
20.0629630.65430.257143
3-0.192424-1.99970.02402
4-0.032407-0.33680.368467
5-0.186716-1.94040.027469
60.0119810.12450.450572
70.1145531.19050.118236
8-0.049319-0.51250.304662
9-0.183705-1.90910.02945
100.132141.37320.086262
11-0.048691-0.5060.306941
12-0.151042-1.56970.059708
13-0.06584-0.68420.247649
140.0567160.58940.278408
150.0819430.85160.198168
16-0.213949-2.22340.014135
17-0.079918-0.83050.204036
18-0.04935-0.51290.304548
190.0436290.45340.325584
200.0262460.27280.39278
21-0.027584-0.28670.387462
22-0.033416-0.34730.364533
230.0585140.60810.2722
240.0166860.17340.431328
250.0652690.67830.249516
26-0.050322-0.5230.301035
27-0.060127-0.62490.266691
280.0148720.15460.438729
29-0.054276-0.56410.286944
300.0347180.36080.359477
31-0.024323-0.25280.400464
32-0.009573-0.09950.46047
330.0144910.15060.440289
34-0.019302-0.20060.420699
350.1131011.17540.121214
36-0.064223-0.66740.252962
37-0.032866-0.34160.366674
380.0082180.08540.46605
390.019230.19980.420991
40-0.033593-0.34910.363842
410.0145520.15120.44004
420.0211820.22010.413094
43-0.121507-1.26270.104702
440.0556740.57860.282039
450.0312780.3250.372886
46-0.012589-0.13080.448078
470.0175410.18230.427848
48-0.094288-0.97990.164669

\begin{tabular}{lllllllll}
\hline
Partial Autocorrelation Function \tabularnewline
Time lag k & PACF(k) & T-STAT & P-value \tabularnewline
1 & 0.531602 & 5.5246 & 0 \tabularnewline
2 & 0.062963 & 0.6543 & 0.257143 \tabularnewline
3 & -0.192424 & -1.9997 & 0.02402 \tabularnewline
4 & -0.032407 & -0.3368 & 0.368467 \tabularnewline
5 & -0.186716 & -1.9404 & 0.027469 \tabularnewline
6 & 0.011981 & 0.1245 & 0.450572 \tabularnewline
7 & 0.114553 & 1.1905 & 0.118236 \tabularnewline
8 & -0.049319 & -0.5125 & 0.304662 \tabularnewline
9 & -0.183705 & -1.9091 & 0.02945 \tabularnewline
10 & 0.13214 & 1.3732 & 0.086262 \tabularnewline
11 & -0.048691 & -0.506 & 0.306941 \tabularnewline
12 & -0.151042 & -1.5697 & 0.059708 \tabularnewline
13 & -0.06584 & -0.6842 & 0.247649 \tabularnewline
14 & 0.056716 & 0.5894 & 0.278408 \tabularnewline
15 & 0.081943 & 0.8516 & 0.198168 \tabularnewline
16 & -0.213949 & -2.2234 & 0.014135 \tabularnewline
17 & -0.079918 & -0.8305 & 0.204036 \tabularnewline
18 & -0.04935 & -0.5129 & 0.304548 \tabularnewline
19 & 0.043629 & 0.4534 & 0.325584 \tabularnewline
20 & 0.026246 & 0.2728 & 0.39278 \tabularnewline
21 & -0.027584 & -0.2867 & 0.387462 \tabularnewline
22 & -0.033416 & -0.3473 & 0.364533 \tabularnewline
23 & 0.058514 & 0.6081 & 0.2722 \tabularnewline
24 & 0.016686 & 0.1734 & 0.431328 \tabularnewline
25 & 0.065269 & 0.6783 & 0.249516 \tabularnewline
26 & -0.050322 & -0.523 & 0.301035 \tabularnewline
27 & -0.060127 & -0.6249 & 0.266691 \tabularnewline
28 & 0.014872 & 0.1546 & 0.438729 \tabularnewline
29 & -0.054276 & -0.5641 & 0.286944 \tabularnewline
30 & 0.034718 & 0.3608 & 0.359477 \tabularnewline
31 & -0.024323 & -0.2528 & 0.400464 \tabularnewline
32 & -0.009573 & -0.0995 & 0.46047 \tabularnewline
33 & 0.014491 & 0.1506 & 0.440289 \tabularnewline
34 & -0.019302 & -0.2006 & 0.420699 \tabularnewline
35 & 0.113101 & 1.1754 & 0.121214 \tabularnewline
36 & -0.064223 & -0.6674 & 0.252962 \tabularnewline
37 & -0.032866 & -0.3416 & 0.366674 \tabularnewline
38 & 0.008218 & 0.0854 & 0.46605 \tabularnewline
39 & 0.01923 & 0.1998 & 0.420991 \tabularnewline
40 & -0.033593 & -0.3491 & 0.363842 \tabularnewline
41 & 0.014552 & 0.1512 & 0.44004 \tabularnewline
42 & 0.021182 & 0.2201 & 0.413094 \tabularnewline
43 & -0.121507 & -1.2627 & 0.104702 \tabularnewline
44 & 0.055674 & 0.5786 & 0.282039 \tabularnewline
45 & 0.031278 & 0.325 & 0.372886 \tabularnewline
46 & -0.012589 & -0.1308 & 0.448078 \tabularnewline
47 & 0.017541 & 0.1823 & 0.427848 \tabularnewline
48 & -0.094288 & -0.9799 & 0.164669 \tabularnewline
\hline
\end{tabular}
%Source: https://freestatistics.org/blog/index.php?pk=39594&T=2

[TABLE]
[ROW][C]Partial Autocorrelation Function[/C][/ROW]
[ROW][C]Time lag k[/C][C]PACF(k)[/C][C]T-STAT[/C][C]P-value[/C][/ROW]
[ROW][C]1[/C][C]0.531602[/C][C]5.5246[/C][C]0[/C][/ROW]
[ROW][C]2[/C][C]0.062963[/C][C]0.6543[/C][C]0.257143[/C][/ROW]
[ROW][C]3[/C][C]-0.192424[/C][C]-1.9997[/C][C]0.02402[/C][/ROW]
[ROW][C]4[/C][C]-0.032407[/C][C]-0.3368[/C][C]0.368467[/C][/ROW]
[ROW][C]5[/C][C]-0.186716[/C][C]-1.9404[/C][C]0.027469[/C][/ROW]
[ROW][C]6[/C][C]0.011981[/C][C]0.1245[/C][C]0.450572[/C][/ROW]
[ROW][C]7[/C][C]0.114553[/C][C]1.1905[/C][C]0.118236[/C][/ROW]
[ROW][C]8[/C][C]-0.049319[/C][C]-0.5125[/C][C]0.304662[/C][/ROW]
[ROW][C]9[/C][C]-0.183705[/C][C]-1.9091[/C][C]0.02945[/C][/ROW]
[ROW][C]10[/C][C]0.13214[/C][C]1.3732[/C][C]0.086262[/C][/ROW]
[ROW][C]11[/C][C]-0.048691[/C][C]-0.506[/C][C]0.306941[/C][/ROW]
[ROW][C]12[/C][C]-0.151042[/C][C]-1.5697[/C][C]0.059708[/C][/ROW]
[ROW][C]13[/C][C]-0.06584[/C][C]-0.6842[/C][C]0.247649[/C][/ROW]
[ROW][C]14[/C][C]0.056716[/C][C]0.5894[/C][C]0.278408[/C][/ROW]
[ROW][C]15[/C][C]0.081943[/C][C]0.8516[/C][C]0.198168[/C][/ROW]
[ROW][C]16[/C][C]-0.213949[/C][C]-2.2234[/C][C]0.014135[/C][/ROW]
[ROW][C]17[/C][C]-0.079918[/C][C]-0.8305[/C][C]0.204036[/C][/ROW]
[ROW][C]18[/C][C]-0.04935[/C][C]-0.5129[/C][C]0.304548[/C][/ROW]
[ROW][C]19[/C][C]0.043629[/C][C]0.4534[/C][C]0.325584[/C][/ROW]
[ROW][C]20[/C][C]0.026246[/C][C]0.2728[/C][C]0.39278[/C][/ROW]
[ROW][C]21[/C][C]-0.027584[/C][C]-0.2867[/C][C]0.387462[/C][/ROW]
[ROW][C]22[/C][C]-0.033416[/C][C]-0.3473[/C][C]0.364533[/C][/ROW]
[ROW][C]23[/C][C]0.058514[/C][C]0.6081[/C][C]0.2722[/C][/ROW]
[ROW][C]24[/C][C]0.016686[/C][C]0.1734[/C][C]0.431328[/C][/ROW]
[ROW][C]25[/C][C]0.065269[/C][C]0.6783[/C][C]0.249516[/C][/ROW]
[ROW][C]26[/C][C]-0.050322[/C][C]-0.523[/C][C]0.301035[/C][/ROW]
[ROW][C]27[/C][C]-0.060127[/C][C]-0.6249[/C][C]0.266691[/C][/ROW]
[ROW][C]28[/C][C]0.014872[/C][C]0.1546[/C][C]0.438729[/C][/ROW]
[ROW][C]29[/C][C]-0.054276[/C][C]-0.5641[/C][C]0.286944[/C][/ROW]
[ROW][C]30[/C][C]0.034718[/C][C]0.3608[/C][C]0.359477[/C][/ROW]
[ROW][C]31[/C][C]-0.024323[/C][C]-0.2528[/C][C]0.400464[/C][/ROW]
[ROW][C]32[/C][C]-0.009573[/C][C]-0.0995[/C][C]0.46047[/C][/ROW]
[ROW][C]33[/C][C]0.014491[/C][C]0.1506[/C][C]0.440289[/C][/ROW]
[ROW][C]34[/C][C]-0.019302[/C][C]-0.2006[/C][C]0.420699[/C][/ROW]
[ROW][C]35[/C][C]0.113101[/C][C]1.1754[/C][C]0.121214[/C][/ROW]
[ROW][C]36[/C][C]-0.064223[/C][C]-0.6674[/C][C]0.252962[/C][/ROW]
[ROW][C]37[/C][C]-0.032866[/C][C]-0.3416[/C][C]0.366674[/C][/ROW]
[ROW][C]38[/C][C]0.008218[/C][C]0.0854[/C][C]0.46605[/C][/ROW]
[ROW][C]39[/C][C]0.01923[/C][C]0.1998[/C][C]0.420991[/C][/ROW]
[ROW][C]40[/C][C]-0.033593[/C][C]-0.3491[/C][C]0.363842[/C][/ROW]
[ROW][C]41[/C][C]0.014552[/C][C]0.1512[/C][C]0.44004[/C][/ROW]
[ROW][C]42[/C][C]0.021182[/C][C]0.2201[/C][C]0.413094[/C][/ROW]
[ROW][C]43[/C][C]-0.121507[/C][C]-1.2627[/C][C]0.104702[/C][/ROW]
[ROW][C]44[/C][C]0.055674[/C][C]0.5786[/C][C]0.282039[/C][/ROW]
[ROW][C]45[/C][C]0.031278[/C][C]0.325[/C][C]0.372886[/C][/ROW]
[ROW][C]46[/C][C]-0.012589[/C][C]-0.1308[/C][C]0.448078[/C][/ROW]
[ROW][C]47[/C][C]0.017541[/C][C]0.1823[/C][C]0.427848[/C][/ROW]
[ROW][C]48[/C][C]-0.094288[/C][C]-0.9799[/C][C]0.164669[/C][/ROW]
[/TABLE]
Source: https://freestatistics.org/blog/index.php?pk=39594&T=2

Globally Unique Identifier (entire table): ba.freestatistics.org/blog/index.php?pk=39594&T=2

As an alternative you can also use a QR Code:  

The GUIDs for individual cells are displayed in the table below:

Partial Autocorrelation Function
Time lag kPACF(k)T-STATP-value
10.5316025.52460
20.0629630.65430.257143
3-0.192424-1.99970.02402
4-0.032407-0.33680.368467
5-0.186716-1.94040.027469
60.0119810.12450.450572
70.1145531.19050.118236
8-0.049319-0.51250.304662
9-0.183705-1.90910.02945
100.132141.37320.086262
11-0.048691-0.5060.306941
12-0.151042-1.56970.059708
13-0.06584-0.68420.247649
140.0567160.58940.278408
150.0819430.85160.198168
16-0.213949-2.22340.014135
17-0.079918-0.83050.204036
18-0.04935-0.51290.304548
190.0436290.45340.325584
200.0262460.27280.39278
21-0.027584-0.28670.387462
22-0.033416-0.34730.364533
230.0585140.60810.2722
240.0166860.17340.431328
250.0652690.67830.249516
26-0.050322-0.5230.301035
27-0.060127-0.62490.266691
280.0148720.15460.438729
29-0.054276-0.56410.286944
300.0347180.36080.359477
31-0.024323-0.25280.400464
32-0.009573-0.09950.46047
330.0144910.15060.440289
34-0.019302-0.20060.420699
350.1131011.17540.121214
36-0.064223-0.66740.252962
37-0.032866-0.34160.366674
380.0082180.08540.46605
390.019230.19980.420991
40-0.033593-0.34910.363842
410.0145520.15120.44004
420.0211820.22010.413094
43-0.121507-1.26270.104702
440.0556740.57860.282039
450.0312780.3250.372886
46-0.012589-0.13080.448078
470.0175410.18230.427848
48-0.094288-0.97990.164669


Parameters (Session):
par1 = 48 ; par2 = 1 ; par3 = 1 ; par4 = 0 ; par5 = 12 ;
Parameters (R input):
par1 = 48 ; par2 = 1 ; par3 = 1 ; par4 = 0 ; par5 = 12 ;
R code (references can be found in the software module):
if (par1 == 'Default') {
par1 = 10*log10(length(x))
} else {
par1 <- as.numeric(par1)
}
par2 <- as.numeric(par2)
par3 <- as.numeric(par3)
par4 <- as.numeric(par4)
par5 <- as.numeric(par5)
if (par2 == 0) {
x <- log(x)
} else {
x <- (x ^ par2 - 1) / par2
}
if (par3 > 0) x <- diff(x,lag=1,difference=par3)
if (par4 > 0) x <- diff(x,lag=par5,difference=par4)
bitmap(file='pic1.png')
racf <- acf(x,par1,main='Autocorrelation',xlab='lags',ylab='ACF')
dev.off()
bitmap(file='pic2.png')
rpacf <- pacf(x,par1,main='Partial Autocorrelation',xlab='lags',ylab='PACF')
dev.off()
(myacf <- c(racf$acf))
(mypacf <- c(rpacf$acf))
lengthx <- length(x)
sqrtn <- sqrt(lengthx)
load(file='createtable')
a<-table.start()
a<-table.row.start(a)
a<-table.element(a,'Autocorrelation Function',4,TRUE)
a<-table.row.end(a)
a<-table.row.start(a)
a<-table.element(a,'Time lag k',header=TRUE)
a<-table.element(a,hyperlink('basics.htm','ACF(k)','click here for more information about the Autocorrelation Function'),header=TRUE)
a<-table.element(a,'T-STAT',header=TRUE)
a<-table.element(a,'P-value',header=TRUE)
a<-table.row.end(a)
for (i in 2:(par1+1)) {
a<-table.row.start(a)
a<-table.element(a,i-1,header=TRUE)
a<-table.element(a,round(myacf[i],6))
mytstat <- myacf[i]*sqrtn
a<-table.element(a,round(mytstat,4))
a<-table.element(a,round(1-pt(abs(mytstat),lengthx),6))
a<-table.row.end(a)
}
a<-table.end(a)
table.save(a,file='mytable.tab')
a<-table.start()
a<-table.row.start(a)
a<-table.element(a,'Partial Autocorrelation Function',4,TRUE)
a<-table.row.end(a)
a<-table.row.start(a)
a<-table.element(a,'Time lag k',header=TRUE)
a<-table.element(a,hyperlink('basics.htm','PACF(k)','click here for more information about the Partial Autocorrelation Function'),header=TRUE)
a<-table.element(a,'T-STAT',header=TRUE)
a<-table.element(a,'P-value',header=TRUE)
a<-table.row.end(a)
for (i in 1:par1) {
a<-table.row.start(a)
a<-table.element(a,i,header=TRUE)
a<-table.element(a,round(mypacf[i],6))
mytstat <- mypacf[i]*sqrtn
a<-table.element(a,round(mytstat,4))
a<-table.element(a,round(1-pt(abs(mytstat),lengthx),6))
a<-table.row.end(a)
}
a<-table.end(a)
table.save(a,file='mytable1.tab')