Free Statistics
of Irreproducible Research!
Description of Statistical Computation | |||||||||||||||||||||||||||||||||||||||||
|---|---|---|---|---|---|---|---|---|---|---|---|---|---|---|---|---|---|---|---|---|---|---|---|---|---|---|---|---|---|---|---|---|---|---|---|---|---|---|---|---|---|
| Author's title | |||||||||||||||||||||||||||||||||||||||||
| Author | *Unverified author* | ||||||||||||||||||||||||||||||||||||||||
| R Software Module | rwasp_univariatedataseries.wasp | ||||||||||||||||||||||||||||||||||||||||
| Title produced by software | Univariate Data Series | ||||||||||||||||||||||||||||||||||||||||
| Date of computation | Thu, 05 Mar 2009 06:39:50 -0700 | ||||||||||||||||||||||||||||||||||||||||
| Cite this page as follows | Statistical Computations at FreeStatistics.org, Office for Research Development and Education, URL https://freestatistics.org/blog/index.php?v=date/2009/Mar/05/t1236260523ohg559awju276z2.htm/, Retrieved Sat, 20 Apr 2024 06:56:55 +0000 | ||||||||||||||||||||||||||||||||||||||||
| Statistical Computations at FreeStatistics.org, Office for Research Development and Education, URL https://freestatistics.org/blog/index.php?pk=38547, Retrieved Sat, 20 Apr 2024 06:56:55 +0000 | |||||||||||||||||||||||||||||||||||||||||
| QR Codes: | |||||||||||||||||||||||||||||||||||||||||
|
| |||||||||||||||||||||||||||||||||||||||||
| Original text written by user: | |||||||||||||||||||||||||||||||||||||||||
| IsPrivate? | No (this computation is public) | ||||||||||||||||||||||||||||||||||||||||
| User-defined keywords | |||||||||||||||||||||||||||||||||||||||||
| Estimated Impact | 168 | ||||||||||||||||||||||||||||||||||||||||
Tree of Dependent Computations | |||||||||||||||||||||||||||||||||||||||||
| Family? (F = Feedback message, R = changed R code, M = changed R Module, P = changed Parameters, D = changed Data) | |||||||||||||||||||||||||||||||||||||||||
| - [Univariate Data Series] [datareeks-geboort...] [2009-02-12 12:25:53] [9d28f09f32c25d40ff96a2d3c1b5406e] - P [Univariate Data Series] [datareeks-aantal ...] [2009-03-05 13:39:50] [d41d8cd98f00b204e9800998ecf8427e] [Current] | |||||||||||||||||||||||||||||||||||||||||
| Feedback Forum | |||||||||||||||||||||||||||||||||||||||||
Post a new message | |||||||||||||||||||||||||||||||||||||||||
Dataset | |||||||||||||||||||||||||||||||||||||||||
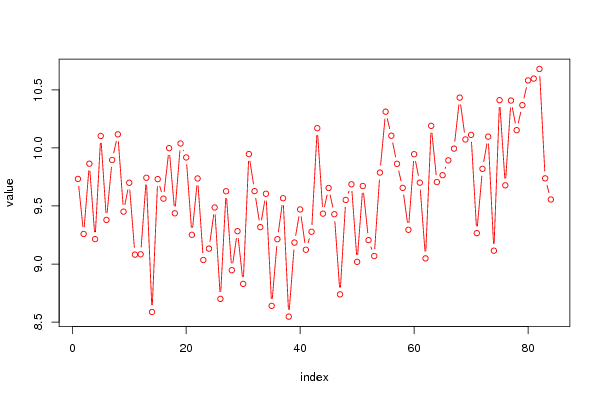
| Dataseries X: | |||||||||||||||||||||||||||||||||||||||||
9.733 9.259 9.864 9.215 10.103 9.380 9.896 10.117 9.451 9.700 9.081 9.084 9.743 8.587 9.731 9.563 9.998 9.437 10.038 9.918 9.252 9.737 9.035 9.133 9.487 8.700 9.627 8.947 9.283 8.829 9.947 9.628 9.318 9.605 8.640 9.214 9.567 8.547 9.185 9.470 9.123 9.278 10.170 9.434 9.655 9.429 8.739 9.552 9.687 9.019 9.672 9.206 9.069 9.788 10.312 10.105 9.863 9.656 9.295 9.946 9.701 9.049 10.190 9.706 9.765 9.893 9.994 10.433 10.073 10.112 9.266 9.820 10.097 9.115 10.411 9.678 10.408 10.153 10.368 10.581 10.597 10.680 9.738 9.556 | |||||||||||||||||||||||||||||||||||||||||
Tables (Output of Computation) | |||||||||||||||||||||||||||||||||||||||||
| |||||||||||||||||||||||||||||||||||||||||
Figures (Output of Computation) | |||||||||||||||||||||||||||||||||||||||||
Input Parameters & R Code | |||||||||||||||||||||||||||||||||||||||||
| Parameters (Session): | |||||||||||||||||||||||||||||||||||||||||
| par1 = GEBOORTEN PER MAAND EN PER DAG (2000 - 2006) ; par2 = Bron: Algemene Directie Statistiek en Economische Informatie - FOD Economie ; | |||||||||||||||||||||||||||||||||||||||||
| Parameters (R input): | |||||||||||||||||||||||||||||||||||||||||
| par1 = GEBOORTEN PER MAAND EN PER DAG (2000 - 2006) ; par2 = Bron: Algemene Directie Statistiek en Economische Informatie - FOD Economie ; par3 = ; | |||||||||||||||||||||||||||||||||||||||||
| R code (references can be found in the software module): | |||||||||||||||||||||||||||||||||||||||||
bitmap(file='test1.png') | |||||||||||||||||||||||||||||||||||||||||