Free Statistics
of Irreproducible Research!
Description of Statistical Computation | |||||||||||||||||||||||||||||||||||||||||
|---|---|---|---|---|---|---|---|---|---|---|---|---|---|---|---|---|---|---|---|---|---|---|---|---|---|---|---|---|---|---|---|---|---|---|---|---|---|---|---|---|---|
| Author's title | |||||||||||||||||||||||||||||||||||||||||
| Author | *Unverified author* | ||||||||||||||||||||||||||||||||||||||||
| R Software Module | rwasp_univariatedataseries.wasp | ||||||||||||||||||||||||||||||||||||||||
| Title produced by software | Univariate Data Series | ||||||||||||||||||||||||||||||||||||||||
| Date of computation | Mon, 02 Mar 2009 10:44:54 -0700 | ||||||||||||||||||||||||||||||||||||||||
| Cite this page as follows | Statistical Computations at FreeStatistics.org, Office for Research Development and Education, URL https://freestatistics.org/blog/index.php?v=date/2009/Mar/02/t1236016160cug5q2syso0v607.htm/, Retrieved Thu, 25 Apr 2024 16:53:31 +0000 | ||||||||||||||||||||||||||||||||||||||||
| Statistical Computations at FreeStatistics.org, Office for Research Development and Education, URL https://freestatistics.org/blog/index.php?pk=38366, Retrieved Thu, 25 Apr 2024 16:53:31 +0000 | |||||||||||||||||||||||||||||||||||||||||
| QR Codes: | |||||||||||||||||||||||||||||||||||||||||
|
| |||||||||||||||||||||||||||||||||||||||||
| Original text written by user: | |||||||||||||||||||||||||||||||||||||||||
| IsPrivate? | No (this computation is public) | ||||||||||||||||||||||||||||||||||||||||
| User-defined keywords | |||||||||||||||||||||||||||||||||||||||||
| Estimated Impact | 160 | ||||||||||||||||||||||||||||||||||||||||
Tree of Dependent Computations | |||||||||||||||||||||||||||||||||||||||||
| Family? (F = Feedback message, R = changed R code, M = changed R Module, P = changed Parameters, D = changed Data) | |||||||||||||||||||||||||||||||||||||||||
| - [Univariate Data Series] [opgave 1 verbeter...] [2009-03-02 17:44:54] [d41d8cd98f00b204e9800998ecf8427e] [Current] - RMP [Histogram] [opgave 2 - oef 2/...] [2009-03-02 18:47:52] [74be16979710d4c4e7c6647856088456] - RMP [Kernel Density Estimation] [opgave 2 - oef 2/...] [2009-03-02 19:03:54] [74be16979710d4c4e7c6647856088456] | |||||||||||||||||||||||||||||||||||||||||
| Feedback Forum | |||||||||||||||||||||||||||||||||||||||||
Post a new message | |||||||||||||||||||||||||||||||||||||||||
Dataset | |||||||||||||||||||||||||||||||||||||||||
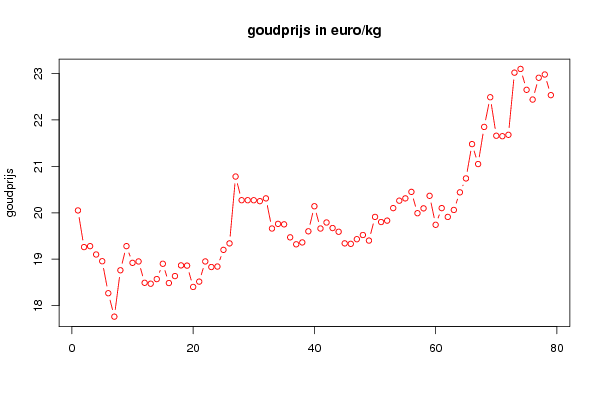
| Dataseries X: | |||||||||||||||||||||||||||||||||||||||||
20.050 19.260 19.280 19.100 18.955 18.265 17.760 18.760 19.280 18.920 18.950 18.490 18.470 18.570 18.900 18.485 18.635 18.865 18.860 18.400 18.515 18.950 18.830 18.840 19.200 19.340 20.780 20.270 20.270 20.270 20.250 20.310 19.660 19.760 19.750 19.470 19.320 19.360 19.600 20.140 19.660 19.790 19.670 19.590 19.340 19.330 19.430 19.520 19.400 19.910 19.800 19.830 20.100 20.260 20.310 20.450 19.990 20.095 20.365 19.740 20.100 19.910 20.060 20.440 20.740 21.480 21.050 21.850 22.490 21.660 21.650 21.680 23.020 23.100 22.650 22.440 22.910 22.980 22.535 | |||||||||||||||||||||||||||||||||||||||||
Tables (Output of Computation) | |||||||||||||||||||||||||||||||||||||||||
| |||||||||||||||||||||||||||||||||||||||||
Figures (Output of Computation) | |||||||||||||||||||||||||||||||||||||||||
Input Parameters & R Code | |||||||||||||||||||||||||||||||||||||||||
| Parameters (Session): | |||||||||||||||||||||||||||||||||||||||||
| par1 = goudprijs in euro/kg ; | |||||||||||||||||||||||||||||||||||||||||
| Parameters (R input): | |||||||||||||||||||||||||||||||||||||||||
| par1 = goudprijs in euro/kg ; par2 = ; par3 = ; | |||||||||||||||||||||||||||||||||||||||||
| R code (references can be found in the software module): | |||||||||||||||||||||||||||||||||||||||||
bitmap(file='test1.png') | |||||||||||||||||||||||||||||||||||||||||