Free Statistics

of Irreproducible Research!

Author's title

Author*Unverified author*
R Software Modulerwasp_autocorrelation.wasp
Title produced by software(Partial) Autocorrelation Function
Date of computationSat, 06 Jun 2009 12:16:16 -0600
Cite this page as followsStatistical Computations at FreeStatistics.org, Office for Research Development and Education, URL https://freestatistics.org/blog/index.php?v=date/2009/Jun/06/t1244312199jesedh0js5ncvnw.htm/, Retrieved Sun, 28 Apr 2024 22:09:35 +0000
Statistical Computations at FreeStatistics.org, Office for Research Development and Education, URL https://freestatistics.org/blog/index.php?pk=42046, Retrieved Sun, 28 Apr 2024 22:09:35 +0000
QR Codes:

Original text written by user:
IsPrivate?No (this computation is public)
User-defined keywords
Estimated Impact155
Family? (F = Feedback message, R = changed R code, M = changed R Module, P = changed Parameters, D = changed Data)
-     [(Partial) Autocorrelation Function] [inschrijving nieu...] [2009-06-04 10:51:18] [ef653b42671acc8de32235b938c43afe]
-    D  [(Partial) Autocorrelation Function] [Bruto schuld van ...] [2009-06-06 18:14:07] [ef653b42671acc8de32235b938c43afe]
-           [(Partial) Autocorrelation Function] [Bruto schuld van ...] [2009-06-06 18:16:16] [2eea656d1ea82c4ced0e8e79cdac0617] [Current]
Feedback Forum

Post a new message
Dataseries X:
266433
267722
266003
262971
265521
264676
270223
269508
268457
265814
266680
263018
269285
269829
270911
266844
271244
269907
271296
270157
271322
267179
264101
265518
269419
268714
272482
268351
268175
270674
272764
272599
270333
270846
270491
269160
274027
273784
276663
274525
271344
271115
270798
273911
273985
271917
273338
270601
273547
275363
281229
277793
279913
282500
280041
282166
290304
283519
287816
285226
287595
289741
289148
288301
290155
289648
288225
289351
294735
305333
309030
310215


Summary of computational transaction
Raw Inputview raw input (R code)
Raw Outputview raw output of R engine
Computing time1 seconds
R Server'George Udny Yule' @ 72.249.76.132

\begin{tabular}{lllllllll}
\hline
Summary of computational transaction \tabularnewline
Raw Input & view raw input (R code)  \tabularnewline
Raw Output & view raw output of R engine  \tabularnewline
Computing time & 1 seconds \tabularnewline
R Server & 'George Udny Yule' @ 72.249.76.132 \tabularnewline
\hline
\end{tabular}
%Source: https://freestatistics.org/blog/index.php?pk=42046&T=0

[TABLE]
[ROW][C]Summary of computational transaction[/C][/ROW]
[ROW][C]Raw Input[/C][C]view raw input (R code) [/C][/ROW]
[ROW][C]Raw Output[/C][C]view raw output of R engine [/C][/ROW]
[ROW][C]Computing time[/C][C]1 seconds[/C][/ROW]
[ROW][C]R Server[/C][C]'George Udny Yule' @ 72.249.76.132[/C][/ROW]
[/TABLE]
Source: https://freestatistics.org/blog/index.php?pk=42046&T=0

Globally Unique Identifier (entire table): ba.freestatistics.org/blog/index.php?pk=42046&T=0

As an alternative you can also use a QR Code:  

The GUIDs for individual cells are displayed in the table below:

Summary of computational transaction
Raw Inputview raw input (R code)
Raw Outputview raw output of R engine
Computing time1 seconds
R Server'George Udny Yule' @ 72.249.76.132


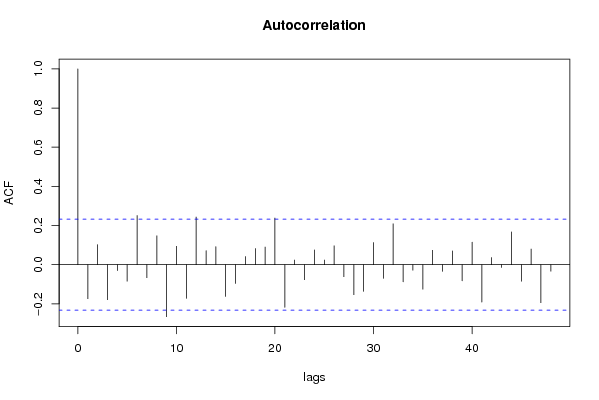
Autocorrelation Function
Time lag kACF(k)T-STATP-value
1-0.173952-1.46570.073566
20.1022580.86160.195893
3-0.178831-1.50690.068142
4-0.030032-0.25310.400479
5-0.084543-0.71240.239284
60.2510322.11520.01896
7-0.066467-0.56010.2886
80.1472451.24070.109399
9-0.265662-2.23850.014162
100.0938160.79050.215932
11-0.172059-1.44980.075759
120.2432412.04960.02205
130.0714010.60160.274667
140.0921390.77640.220052
15-0.16219-1.36660.088026
16-0.09585-0.80760.210996
170.0410850.34620.365114
180.0820870.69170.245697
190.0902070.76010.224856
200.2384032.00880.02418
21-0.217885-1.83590.035277
220.0235020.1980.421793
23-0.07691-0.64810.25952
240.0754830.6360.263401
250.0232080.19560.42276
260.0961240.810.210335
27-0.061543-0.51860.302836
28-0.153278-1.29150.100351
29-0.136461-1.14980.127035
300.1131530.95340.1718
31-0.06952-0.58580.27994
320.2089111.76030.041331
33-0.087692-0.73890.231199
34-0.028432-0.23960.405678
35-0.125076-1.05390.14775
360.0733490.61810.26926
37-0.033857-0.28530.388129
380.0703810.5930.277518
39-0.082528-0.69540.24454
400.1146240.96580.168702
41-0.19118-1.61090.055818
420.0360440.30370.381118
43-0.014366-0.1210.451998
440.1673871.41040.08139
45-0.084396-0.71110.239666
460.079580.67060.252339
47-0.194163-1.6360.053128
48-0.033387-0.28130.38964

\begin{tabular}{lllllllll}
\hline
Autocorrelation Function \tabularnewline
Time lag k & ACF(k) & T-STAT & P-value \tabularnewline
1 & -0.173952 & -1.4657 & 0.073566 \tabularnewline
2 & 0.102258 & 0.8616 & 0.195893 \tabularnewline
3 & -0.178831 & -1.5069 & 0.068142 \tabularnewline
4 & -0.030032 & -0.2531 & 0.400479 \tabularnewline
5 & -0.084543 & -0.7124 & 0.239284 \tabularnewline
6 & 0.251032 & 2.1152 & 0.01896 \tabularnewline
7 & -0.066467 & -0.5601 & 0.2886 \tabularnewline
8 & 0.147245 & 1.2407 & 0.109399 \tabularnewline
9 & -0.265662 & -2.2385 & 0.014162 \tabularnewline
10 & 0.093816 & 0.7905 & 0.215932 \tabularnewline
11 & -0.172059 & -1.4498 & 0.075759 \tabularnewline
12 & 0.243241 & 2.0496 & 0.02205 \tabularnewline
13 & 0.071401 & 0.6016 & 0.274667 \tabularnewline
14 & 0.092139 & 0.7764 & 0.220052 \tabularnewline
15 & -0.16219 & -1.3666 & 0.088026 \tabularnewline
16 & -0.09585 & -0.8076 & 0.210996 \tabularnewline
17 & 0.041085 & 0.3462 & 0.365114 \tabularnewline
18 & 0.082087 & 0.6917 & 0.245697 \tabularnewline
19 & 0.090207 & 0.7601 & 0.224856 \tabularnewline
20 & 0.238403 & 2.0088 & 0.02418 \tabularnewline
21 & -0.217885 & -1.8359 & 0.035277 \tabularnewline
22 & 0.023502 & 0.198 & 0.421793 \tabularnewline
23 & -0.07691 & -0.6481 & 0.25952 \tabularnewline
24 & 0.075483 & 0.636 & 0.263401 \tabularnewline
25 & 0.023208 & 0.1956 & 0.42276 \tabularnewline
26 & 0.096124 & 0.81 & 0.210335 \tabularnewline
27 & -0.061543 & -0.5186 & 0.302836 \tabularnewline
28 & -0.153278 & -1.2915 & 0.100351 \tabularnewline
29 & -0.136461 & -1.1498 & 0.127035 \tabularnewline
30 & 0.113153 & 0.9534 & 0.1718 \tabularnewline
31 & -0.06952 & -0.5858 & 0.27994 \tabularnewline
32 & 0.208911 & 1.7603 & 0.041331 \tabularnewline
33 & -0.087692 & -0.7389 & 0.231199 \tabularnewline
34 & -0.028432 & -0.2396 & 0.405678 \tabularnewline
35 & -0.125076 & -1.0539 & 0.14775 \tabularnewline
36 & 0.073349 & 0.6181 & 0.26926 \tabularnewline
37 & -0.033857 & -0.2853 & 0.388129 \tabularnewline
38 & 0.070381 & 0.593 & 0.277518 \tabularnewline
39 & -0.082528 & -0.6954 & 0.24454 \tabularnewline
40 & 0.114624 & 0.9658 & 0.168702 \tabularnewline
41 & -0.19118 & -1.6109 & 0.055818 \tabularnewline
42 & 0.036044 & 0.3037 & 0.381118 \tabularnewline
43 & -0.014366 & -0.121 & 0.451998 \tabularnewline
44 & 0.167387 & 1.4104 & 0.08139 \tabularnewline
45 & -0.084396 & -0.7111 & 0.239666 \tabularnewline
46 & 0.07958 & 0.6706 & 0.252339 \tabularnewline
47 & -0.194163 & -1.636 & 0.053128 \tabularnewline
48 & -0.033387 & -0.2813 & 0.38964 \tabularnewline
\hline
\end{tabular}
%Source: https://freestatistics.org/blog/index.php?pk=42046&T=1

[TABLE]
[ROW][C]Autocorrelation Function[/C][/ROW]
[ROW][C]Time lag k[/C][C]ACF(k)[/C][C]T-STAT[/C][C]P-value[/C][/ROW]
[ROW][C]1[/C][C]-0.173952[/C][C]-1.4657[/C][C]0.073566[/C][/ROW]
[ROW][C]2[/C][C]0.102258[/C][C]0.8616[/C][C]0.195893[/C][/ROW]
[ROW][C]3[/C][C]-0.178831[/C][C]-1.5069[/C][C]0.068142[/C][/ROW]
[ROW][C]4[/C][C]-0.030032[/C][C]-0.2531[/C][C]0.400479[/C][/ROW]
[ROW][C]5[/C][C]-0.084543[/C][C]-0.7124[/C][C]0.239284[/C][/ROW]
[ROW][C]6[/C][C]0.251032[/C][C]2.1152[/C][C]0.01896[/C][/ROW]
[ROW][C]7[/C][C]-0.066467[/C][C]-0.5601[/C][C]0.2886[/C][/ROW]
[ROW][C]8[/C][C]0.147245[/C][C]1.2407[/C][C]0.109399[/C][/ROW]
[ROW][C]9[/C][C]-0.265662[/C][C]-2.2385[/C][C]0.014162[/C][/ROW]
[ROW][C]10[/C][C]0.093816[/C][C]0.7905[/C][C]0.215932[/C][/ROW]
[ROW][C]11[/C][C]-0.172059[/C][C]-1.4498[/C][C]0.075759[/C][/ROW]
[ROW][C]12[/C][C]0.243241[/C][C]2.0496[/C][C]0.02205[/C][/ROW]
[ROW][C]13[/C][C]0.071401[/C][C]0.6016[/C][C]0.274667[/C][/ROW]
[ROW][C]14[/C][C]0.092139[/C][C]0.7764[/C][C]0.220052[/C][/ROW]
[ROW][C]15[/C][C]-0.16219[/C][C]-1.3666[/C][C]0.088026[/C][/ROW]
[ROW][C]16[/C][C]-0.09585[/C][C]-0.8076[/C][C]0.210996[/C][/ROW]
[ROW][C]17[/C][C]0.041085[/C][C]0.3462[/C][C]0.365114[/C][/ROW]
[ROW][C]18[/C][C]0.082087[/C][C]0.6917[/C][C]0.245697[/C][/ROW]
[ROW][C]19[/C][C]0.090207[/C][C]0.7601[/C][C]0.224856[/C][/ROW]
[ROW][C]20[/C][C]0.238403[/C][C]2.0088[/C][C]0.02418[/C][/ROW]
[ROW][C]21[/C][C]-0.217885[/C][C]-1.8359[/C][C]0.035277[/C][/ROW]
[ROW][C]22[/C][C]0.023502[/C][C]0.198[/C][C]0.421793[/C][/ROW]
[ROW][C]23[/C][C]-0.07691[/C][C]-0.6481[/C][C]0.25952[/C][/ROW]
[ROW][C]24[/C][C]0.075483[/C][C]0.636[/C][C]0.263401[/C][/ROW]
[ROW][C]25[/C][C]0.023208[/C][C]0.1956[/C][C]0.42276[/C][/ROW]
[ROW][C]26[/C][C]0.096124[/C][C]0.81[/C][C]0.210335[/C][/ROW]
[ROW][C]27[/C][C]-0.061543[/C][C]-0.5186[/C][C]0.302836[/C][/ROW]
[ROW][C]28[/C][C]-0.153278[/C][C]-1.2915[/C][C]0.100351[/C][/ROW]
[ROW][C]29[/C][C]-0.136461[/C][C]-1.1498[/C][C]0.127035[/C][/ROW]
[ROW][C]30[/C][C]0.113153[/C][C]0.9534[/C][C]0.1718[/C][/ROW]
[ROW][C]31[/C][C]-0.06952[/C][C]-0.5858[/C][C]0.27994[/C][/ROW]
[ROW][C]32[/C][C]0.208911[/C][C]1.7603[/C][C]0.041331[/C][/ROW]
[ROW][C]33[/C][C]-0.087692[/C][C]-0.7389[/C][C]0.231199[/C][/ROW]
[ROW][C]34[/C][C]-0.028432[/C][C]-0.2396[/C][C]0.405678[/C][/ROW]
[ROW][C]35[/C][C]-0.125076[/C][C]-1.0539[/C][C]0.14775[/C][/ROW]
[ROW][C]36[/C][C]0.073349[/C][C]0.6181[/C][C]0.26926[/C][/ROW]
[ROW][C]37[/C][C]-0.033857[/C][C]-0.2853[/C][C]0.388129[/C][/ROW]
[ROW][C]38[/C][C]0.070381[/C][C]0.593[/C][C]0.277518[/C][/ROW]
[ROW][C]39[/C][C]-0.082528[/C][C]-0.6954[/C][C]0.24454[/C][/ROW]
[ROW][C]40[/C][C]0.114624[/C][C]0.9658[/C][C]0.168702[/C][/ROW]
[ROW][C]41[/C][C]-0.19118[/C][C]-1.6109[/C][C]0.055818[/C][/ROW]
[ROW][C]42[/C][C]0.036044[/C][C]0.3037[/C][C]0.381118[/C][/ROW]
[ROW][C]43[/C][C]-0.014366[/C][C]-0.121[/C][C]0.451998[/C][/ROW]
[ROW][C]44[/C][C]0.167387[/C][C]1.4104[/C][C]0.08139[/C][/ROW]
[ROW][C]45[/C][C]-0.084396[/C][C]-0.7111[/C][C]0.239666[/C][/ROW]
[ROW][C]46[/C][C]0.07958[/C][C]0.6706[/C][C]0.252339[/C][/ROW]
[ROW][C]47[/C][C]-0.194163[/C][C]-1.636[/C][C]0.053128[/C][/ROW]
[ROW][C]48[/C][C]-0.033387[/C][C]-0.2813[/C][C]0.38964[/C][/ROW]
[/TABLE]
Source: https://freestatistics.org/blog/index.php?pk=42046&T=1

Globally Unique Identifier (entire table): ba.freestatistics.org/blog/index.php?pk=42046&T=1

As an alternative you can also use a QR Code:  

The GUIDs for individual cells are displayed in the table below:

Autocorrelation Function
Time lag kACF(k)T-STATP-value
1-0.173952-1.46570.073566
20.1022580.86160.195893
3-0.178831-1.50690.068142
4-0.030032-0.25310.400479
5-0.084543-0.71240.239284
60.2510322.11520.01896
7-0.066467-0.56010.2886
80.1472451.24070.109399
9-0.265662-2.23850.014162
100.0938160.79050.215932
11-0.172059-1.44980.075759
120.2432412.04960.02205
130.0714010.60160.274667
140.0921390.77640.220052
15-0.16219-1.36660.088026
16-0.09585-0.80760.210996
170.0410850.34620.365114
180.0820870.69170.245697
190.0902070.76010.224856
200.2384032.00880.02418
21-0.217885-1.83590.035277
220.0235020.1980.421793
23-0.07691-0.64810.25952
240.0754830.6360.263401
250.0232080.19560.42276
260.0961240.810.210335
27-0.061543-0.51860.302836
28-0.153278-1.29150.100351
29-0.136461-1.14980.127035
300.1131530.95340.1718
31-0.06952-0.58580.27994
320.2089111.76030.041331
33-0.087692-0.73890.231199
34-0.028432-0.23960.405678
35-0.125076-1.05390.14775
360.0733490.61810.26926
37-0.033857-0.28530.388129
380.0703810.5930.277518
39-0.082528-0.69540.24454
400.1146240.96580.168702
41-0.19118-1.61090.055818
420.0360440.30370.381118
43-0.014366-0.1210.451998
440.1673871.41040.08139
45-0.084396-0.71110.239666
460.079580.67060.252339
47-0.194163-1.6360.053128
48-0.033387-0.28130.38964


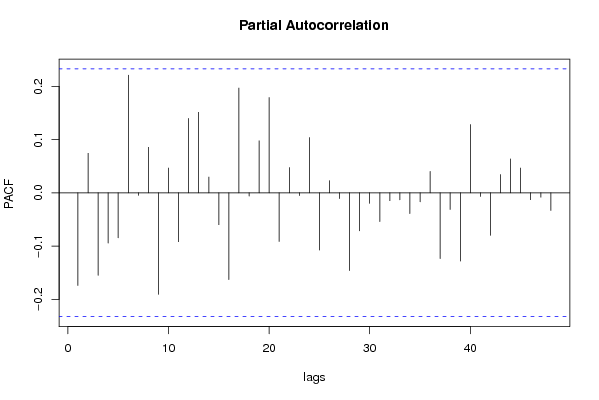
Partial Autocorrelation Function
Time lag kPACF(k)T-STATP-value
1-0.173952-1.46570.073566
20.0742450.62560.266791
3-0.154966-1.30580.097924
4-0.094312-0.79470.214723
5-0.084625-0.71310.239071
60.2209021.86140.033417
7-0.004713-0.03970.484217
80.0853540.71920.237186
9-0.190666-1.60660.056293
100.046480.39170.348244
11-0.09171-0.77280.221114
120.1395671.1760.121759
130.1510551.27280.103619
140.0294990.24860.402207
15-0.059791-0.50380.307978
16-0.162934-1.37290.087052
170.1966221.65680.05099
18-0.006062-0.05110.479701
190.0977070.82330.20655
200.1788421.50690.06813
21-0.091316-0.76940.222093
220.0474940.40020.345107
23-0.005133-0.04330.48281
240.1036530.87340.192697
25-0.107613-0.90680.183799
260.022780.19190.424166
27-0.010773-0.09080.463963
28-0.145979-1.230.111371
29-0.071326-0.6010.274876
30-0.019734-0.16630.434205
31-0.054039-0.45530.325127
32-0.014886-0.12540.450267
33-0.013067-0.11010.456319
34-0.038965-0.32830.371815
35-0.016997-0.14320.443262
360.0401310.33810.368124
37-0.123443-1.04010.1509
38-0.031307-0.26380.396349
39-0.128144-1.07980.141952
400.1281971.08020.141853
41-0.006929-0.05840.476803
42-0.079911-0.67330.251458
430.0342190.28830.386965
440.0636840.53660.296607
450.0465380.39210.348068
46-0.012916-0.10880.45682
47-0.008261-0.06960.472352
48-0.033042-0.27840.39075

\begin{tabular}{lllllllll}
\hline
Partial Autocorrelation Function \tabularnewline
Time lag k & PACF(k) & T-STAT & P-value \tabularnewline
1 & -0.173952 & -1.4657 & 0.073566 \tabularnewline
2 & 0.074245 & 0.6256 & 0.266791 \tabularnewline
3 & -0.154966 & -1.3058 & 0.097924 \tabularnewline
4 & -0.094312 & -0.7947 & 0.214723 \tabularnewline
5 & -0.084625 & -0.7131 & 0.239071 \tabularnewline
6 & 0.220902 & 1.8614 & 0.033417 \tabularnewline
7 & -0.004713 & -0.0397 & 0.484217 \tabularnewline
8 & 0.085354 & 0.7192 & 0.237186 \tabularnewline
9 & -0.190666 & -1.6066 & 0.056293 \tabularnewline
10 & 0.04648 & 0.3917 & 0.348244 \tabularnewline
11 & -0.09171 & -0.7728 & 0.221114 \tabularnewline
12 & 0.139567 & 1.176 & 0.121759 \tabularnewline
13 & 0.151055 & 1.2728 & 0.103619 \tabularnewline
14 & 0.029499 & 0.2486 & 0.402207 \tabularnewline
15 & -0.059791 & -0.5038 & 0.307978 \tabularnewline
16 & -0.162934 & -1.3729 & 0.087052 \tabularnewline
17 & 0.196622 & 1.6568 & 0.05099 \tabularnewline
18 & -0.006062 & -0.0511 & 0.479701 \tabularnewline
19 & 0.097707 & 0.8233 & 0.20655 \tabularnewline
20 & 0.178842 & 1.5069 & 0.06813 \tabularnewline
21 & -0.091316 & -0.7694 & 0.222093 \tabularnewline
22 & 0.047494 & 0.4002 & 0.345107 \tabularnewline
23 & -0.005133 & -0.0433 & 0.48281 \tabularnewline
24 & 0.103653 & 0.8734 & 0.192697 \tabularnewline
25 & -0.107613 & -0.9068 & 0.183799 \tabularnewline
26 & 0.02278 & 0.1919 & 0.424166 \tabularnewline
27 & -0.010773 & -0.0908 & 0.463963 \tabularnewline
28 & -0.145979 & -1.23 & 0.111371 \tabularnewline
29 & -0.071326 & -0.601 & 0.274876 \tabularnewline
30 & -0.019734 & -0.1663 & 0.434205 \tabularnewline
31 & -0.054039 & -0.4553 & 0.325127 \tabularnewline
32 & -0.014886 & -0.1254 & 0.450267 \tabularnewline
33 & -0.013067 & -0.1101 & 0.456319 \tabularnewline
34 & -0.038965 & -0.3283 & 0.371815 \tabularnewline
35 & -0.016997 & -0.1432 & 0.443262 \tabularnewline
36 & 0.040131 & 0.3381 & 0.368124 \tabularnewline
37 & -0.123443 & -1.0401 & 0.1509 \tabularnewline
38 & -0.031307 & -0.2638 & 0.396349 \tabularnewline
39 & -0.128144 & -1.0798 & 0.141952 \tabularnewline
40 & 0.128197 & 1.0802 & 0.141853 \tabularnewline
41 & -0.006929 & -0.0584 & 0.476803 \tabularnewline
42 & -0.079911 & -0.6733 & 0.251458 \tabularnewline
43 & 0.034219 & 0.2883 & 0.386965 \tabularnewline
44 & 0.063684 & 0.5366 & 0.296607 \tabularnewline
45 & 0.046538 & 0.3921 & 0.348068 \tabularnewline
46 & -0.012916 & -0.1088 & 0.45682 \tabularnewline
47 & -0.008261 & -0.0696 & 0.472352 \tabularnewline
48 & -0.033042 & -0.2784 & 0.39075 \tabularnewline
\hline
\end{tabular}
%Source: https://freestatistics.org/blog/index.php?pk=42046&T=2

[TABLE]
[ROW][C]Partial Autocorrelation Function[/C][/ROW]
[ROW][C]Time lag k[/C][C]PACF(k)[/C][C]T-STAT[/C][C]P-value[/C][/ROW]
[ROW][C]1[/C][C]-0.173952[/C][C]-1.4657[/C][C]0.073566[/C][/ROW]
[ROW][C]2[/C][C]0.074245[/C][C]0.6256[/C][C]0.266791[/C][/ROW]
[ROW][C]3[/C][C]-0.154966[/C][C]-1.3058[/C][C]0.097924[/C][/ROW]
[ROW][C]4[/C][C]-0.094312[/C][C]-0.7947[/C][C]0.214723[/C][/ROW]
[ROW][C]5[/C][C]-0.084625[/C][C]-0.7131[/C][C]0.239071[/C][/ROW]
[ROW][C]6[/C][C]0.220902[/C][C]1.8614[/C][C]0.033417[/C][/ROW]
[ROW][C]7[/C][C]-0.004713[/C][C]-0.0397[/C][C]0.484217[/C][/ROW]
[ROW][C]8[/C][C]0.085354[/C][C]0.7192[/C][C]0.237186[/C][/ROW]
[ROW][C]9[/C][C]-0.190666[/C][C]-1.6066[/C][C]0.056293[/C][/ROW]
[ROW][C]10[/C][C]0.04648[/C][C]0.3917[/C][C]0.348244[/C][/ROW]
[ROW][C]11[/C][C]-0.09171[/C][C]-0.7728[/C][C]0.221114[/C][/ROW]
[ROW][C]12[/C][C]0.139567[/C][C]1.176[/C][C]0.121759[/C][/ROW]
[ROW][C]13[/C][C]0.151055[/C][C]1.2728[/C][C]0.103619[/C][/ROW]
[ROW][C]14[/C][C]0.029499[/C][C]0.2486[/C][C]0.402207[/C][/ROW]
[ROW][C]15[/C][C]-0.059791[/C][C]-0.5038[/C][C]0.307978[/C][/ROW]
[ROW][C]16[/C][C]-0.162934[/C][C]-1.3729[/C][C]0.087052[/C][/ROW]
[ROW][C]17[/C][C]0.196622[/C][C]1.6568[/C][C]0.05099[/C][/ROW]
[ROW][C]18[/C][C]-0.006062[/C][C]-0.0511[/C][C]0.479701[/C][/ROW]
[ROW][C]19[/C][C]0.097707[/C][C]0.8233[/C][C]0.20655[/C][/ROW]
[ROW][C]20[/C][C]0.178842[/C][C]1.5069[/C][C]0.06813[/C][/ROW]
[ROW][C]21[/C][C]-0.091316[/C][C]-0.7694[/C][C]0.222093[/C][/ROW]
[ROW][C]22[/C][C]0.047494[/C][C]0.4002[/C][C]0.345107[/C][/ROW]
[ROW][C]23[/C][C]-0.005133[/C][C]-0.0433[/C][C]0.48281[/C][/ROW]
[ROW][C]24[/C][C]0.103653[/C][C]0.8734[/C][C]0.192697[/C][/ROW]
[ROW][C]25[/C][C]-0.107613[/C][C]-0.9068[/C][C]0.183799[/C][/ROW]
[ROW][C]26[/C][C]0.02278[/C][C]0.1919[/C][C]0.424166[/C][/ROW]
[ROW][C]27[/C][C]-0.010773[/C][C]-0.0908[/C][C]0.463963[/C][/ROW]
[ROW][C]28[/C][C]-0.145979[/C][C]-1.23[/C][C]0.111371[/C][/ROW]
[ROW][C]29[/C][C]-0.071326[/C][C]-0.601[/C][C]0.274876[/C][/ROW]
[ROW][C]30[/C][C]-0.019734[/C][C]-0.1663[/C][C]0.434205[/C][/ROW]
[ROW][C]31[/C][C]-0.054039[/C][C]-0.4553[/C][C]0.325127[/C][/ROW]
[ROW][C]32[/C][C]-0.014886[/C][C]-0.1254[/C][C]0.450267[/C][/ROW]
[ROW][C]33[/C][C]-0.013067[/C][C]-0.1101[/C][C]0.456319[/C][/ROW]
[ROW][C]34[/C][C]-0.038965[/C][C]-0.3283[/C][C]0.371815[/C][/ROW]
[ROW][C]35[/C][C]-0.016997[/C][C]-0.1432[/C][C]0.443262[/C][/ROW]
[ROW][C]36[/C][C]0.040131[/C][C]0.3381[/C][C]0.368124[/C][/ROW]
[ROW][C]37[/C][C]-0.123443[/C][C]-1.0401[/C][C]0.1509[/C][/ROW]
[ROW][C]38[/C][C]-0.031307[/C][C]-0.2638[/C][C]0.396349[/C][/ROW]
[ROW][C]39[/C][C]-0.128144[/C][C]-1.0798[/C][C]0.141952[/C][/ROW]
[ROW][C]40[/C][C]0.128197[/C][C]1.0802[/C][C]0.141853[/C][/ROW]
[ROW][C]41[/C][C]-0.006929[/C][C]-0.0584[/C][C]0.476803[/C][/ROW]
[ROW][C]42[/C][C]-0.079911[/C][C]-0.6733[/C][C]0.251458[/C][/ROW]
[ROW][C]43[/C][C]0.034219[/C][C]0.2883[/C][C]0.386965[/C][/ROW]
[ROW][C]44[/C][C]0.063684[/C][C]0.5366[/C][C]0.296607[/C][/ROW]
[ROW][C]45[/C][C]0.046538[/C][C]0.3921[/C][C]0.348068[/C][/ROW]
[ROW][C]46[/C][C]-0.012916[/C][C]-0.1088[/C][C]0.45682[/C][/ROW]
[ROW][C]47[/C][C]-0.008261[/C][C]-0.0696[/C][C]0.472352[/C][/ROW]
[ROW][C]48[/C][C]-0.033042[/C][C]-0.2784[/C][C]0.39075[/C][/ROW]
[/TABLE]
Source: https://freestatistics.org/blog/index.php?pk=42046&T=2

Globally Unique Identifier (entire table): ba.freestatistics.org/blog/index.php?pk=42046&T=2

As an alternative you can also use a QR Code:  

The GUIDs for individual cells are displayed in the table below:

Partial Autocorrelation Function
Time lag kPACF(k)T-STATP-value
1-0.173952-1.46570.073566
20.0742450.62560.266791
3-0.154966-1.30580.097924
4-0.094312-0.79470.214723
5-0.084625-0.71310.239071
60.2209021.86140.033417
7-0.004713-0.03970.484217
80.0853540.71920.237186
9-0.190666-1.60660.056293
100.046480.39170.348244
11-0.09171-0.77280.221114
120.1395671.1760.121759
130.1510551.27280.103619
140.0294990.24860.402207
15-0.059791-0.50380.307978
16-0.162934-1.37290.087052
170.1966221.65680.05099
18-0.006062-0.05110.479701
190.0977070.82330.20655
200.1788421.50690.06813
21-0.091316-0.76940.222093
220.0474940.40020.345107
23-0.005133-0.04330.48281
240.1036530.87340.192697
25-0.107613-0.90680.183799
260.022780.19190.424166
27-0.010773-0.09080.463963
28-0.145979-1.230.111371
29-0.071326-0.6010.274876
30-0.019734-0.16630.434205
31-0.054039-0.45530.325127
32-0.014886-0.12540.450267
33-0.013067-0.11010.456319
34-0.038965-0.32830.371815
35-0.016997-0.14320.443262
360.0401310.33810.368124
37-0.123443-1.04010.1509
38-0.031307-0.26380.396349
39-0.128144-1.07980.141952
400.1281971.08020.141853
41-0.006929-0.05840.476803
42-0.079911-0.67330.251458
430.0342190.28830.386965
440.0636840.53660.296607
450.0465380.39210.348068
46-0.012916-0.10880.45682
47-0.008261-0.06960.472352
48-0.033042-0.27840.39075


Parameters (Session):
par1 = 48 ; par2 = 1 ; par3 = 0 ; par4 = 0 ; par5 = 12 ;
Parameters (R input):
par1 = 48 ; par2 = 1 ; par3 = 1 ; par4 = 0 ; par5 = 12 ;
R code (references can be found in the software module):
if (par1 == 'Default') {
par1 = 10*log10(length(x))
} else {
par1 <- as.numeric(par1)
}
par2 <- as.numeric(par2)
par3 <- as.numeric(par3)
par4 <- as.numeric(par4)
par5 <- as.numeric(par5)
if (par2 == 0) {
x <- log(x)
} else {
x <- (x ^ par2 - 1) / par2
}
if (par3 > 0) x <- diff(x,lag=1,difference=par3)
if (par4 > 0) x <- diff(x,lag=par5,difference=par4)
bitmap(file='pic1.png')
racf <- acf(x,par1,main='Autocorrelation',xlab='lags',ylab='ACF')
dev.off()
bitmap(file='pic2.png')
rpacf <- pacf(x,par1,main='Partial Autocorrelation',xlab='lags',ylab='PACF')
dev.off()
(myacf <- c(racf$acf))
(mypacf <- c(rpacf$acf))
lengthx <- length(x)
sqrtn <- sqrt(lengthx)
load(file='createtable')
a<-table.start()
a<-table.row.start(a)
a<-table.element(a,'Autocorrelation Function',4,TRUE)
a<-table.row.end(a)
a<-table.row.start(a)
a<-table.element(a,'Time lag k',header=TRUE)
a<-table.element(a,hyperlink('basics.htm','ACF(k)','click here for more information about the Autocorrelation Function'),header=TRUE)
a<-table.element(a,'T-STAT',header=TRUE)
a<-table.element(a,'P-value',header=TRUE)
a<-table.row.end(a)
for (i in 2:(par1+1)) {
a<-table.row.start(a)
a<-table.element(a,i-1,header=TRUE)
a<-table.element(a,round(myacf[i],6))
mytstat <- myacf[i]*sqrtn
a<-table.element(a,round(mytstat,4))
a<-table.element(a,round(1-pt(abs(mytstat),lengthx),6))
a<-table.row.end(a)
}
a<-table.end(a)
table.save(a,file='mytable.tab')
a<-table.start()
a<-table.row.start(a)
a<-table.element(a,'Partial Autocorrelation Function',4,TRUE)
a<-table.row.end(a)
a<-table.row.start(a)
a<-table.element(a,'Time lag k',header=TRUE)
a<-table.element(a,hyperlink('basics.htm','PACF(k)','click here for more information about the Partial Autocorrelation Function'),header=TRUE)
a<-table.element(a,'T-STAT',header=TRUE)
a<-table.element(a,'P-value',header=TRUE)
a<-table.row.end(a)
for (i in 1:par1) {
a<-table.row.start(a)
a<-table.element(a,i,header=TRUE)
a<-table.element(a,round(mypacf[i],6))
mytstat <- mypacf[i]*sqrtn
a<-table.element(a,round(mytstat,4))
a<-table.element(a,round(1-pt(abs(mytstat),lengthx),6))
a<-table.row.end(a)
}
a<-table.end(a)
table.save(a,file='mytable1.tab')