Free Statistics

of Irreproducible Research!

Author's title

Author*Unverified author*
R Software Modulerwasp_exponentialsmoothing.wasp
Title produced by softwareExponential Smoothing
Date of computationSat, 06 Jun 2009 09:28:21 -0600
Cite this page as followsStatistical Computations at FreeStatistics.org, Office for Research Development and Education, URL https://freestatistics.org/blog/index.php?v=date/2009/Jun/06/t1244302126n8rgayd8nf6oy7u.htm/, Retrieved Mon, 29 Apr 2024 07:12:17 +0000
Statistical Computations at FreeStatistics.org, Office for Research Development and Education, URL https://freestatistics.org/blog/index.php?pk=42019, Retrieved Mon, 29 Apr 2024 07:12:17 +0000
QR Codes:

Original text written by user:
IsPrivate?No (this computation is public)
User-defined keywords
Estimated Impact163
Family? (F = Feedback message, R = changed R code, M = changed R Module, P = changed Parameters, D = changed Data)
-     [Classical Decomposition] [Opgave 9 ] [2009-06-02 02:28:18] [3ccda03dddd60e52bd63ea4afd424344]
- RMPD  [Exponential Smoothing] [Duncan Huysmans O...] [2009-06-05 20:19:40] [3ccda03dddd60e52bd63ea4afd424344]
-    D      [Exponential Smoothing] [] [2009-06-06 15:28:21] [d41d8cd98f00b204e9800998ecf8427e] [Current]
Feedback Forum

Post a new message
Dataseries X:
3851,3
3851,8
3854,1
3858,4
3861,6
3856,3
3855,8
3860,4
3855,1
3839,5
3833
3833,6
3826,8
3818,2
3811,4
3806,8
3810,3
3818,2
3858,9
3867,8
3872,3
3873,3
3876,7
3882,6
3883,5
3882,2
3888,1
3893,7
3901,9
3914,3
3930,3
3948,3
3971,5
3990,1
3993
3998
4015,8
4041,2
4060,7
4076,7
4103
4125,3
4139,7
4146,7
4158
4155,1
4144,8
4148,2
4142,5
4142,1
4145,4
4146,3
4143,5
4149,2
4158,9
4166,1
4179,1
4194,4
4211,7
4226,3
4235,8
4243,6
4258,7
4278,2
4298
4315,1
4334,3
4356
4374
4395,5
4417,8
4432,8
4446,3


Summary of computational transaction
Raw Inputview raw input (R code)
Raw Outputview raw output of R engine
Computing time1 seconds
R Server'Gwilym Jenkins' @ 72.249.127.135

\begin{tabular}{lllllllll}
\hline
Summary of computational transaction \tabularnewline
Raw Input & view raw input (R code)  \tabularnewline
Raw Output & view raw output of R engine  \tabularnewline
Computing time & 1 seconds \tabularnewline
R Server & 'Gwilym Jenkins' @ 72.249.127.135 \tabularnewline
\hline
\end{tabular}
%Source: https://freestatistics.org/blog/index.php?pk=42019&T=0

[TABLE]
[ROW][C]Summary of computational transaction[/C][/ROW]
[ROW][C]Raw Input[/C][C]view raw input (R code) [/C][/ROW]
[ROW][C]Raw Output[/C][C]view raw output of R engine [/C][/ROW]
[ROW][C]Computing time[/C][C]1 seconds[/C][/ROW]
[ROW][C]R Server[/C][C]'Gwilym Jenkins' @ 72.249.127.135[/C][/ROW]
[/TABLE]
Source: https://freestatistics.org/blog/index.php?pk=42019&T=0

Globally Unique Identifier (entire table): ba.freestatistics.org/blog/index.php?pk=42019&T=0

As an alternative you can also use a QR Code:  

The GUIDs for individual cells are displayed in the table below:

Summary of computational transaction
Raw Inputview raw input (R code)
Raw Outputview raw output of R engine
Computing time1 seconds
R Server'Gwilym Jenkins' @ 72.249.127.135


Estimated Parameters of Exponential Smoothing
ParameterValue
alpha0.94877810070843
beta0.264457573588829
gamma1

\begin{tabular}{lllllllll}
\hline
Estimated Parameters of Exponential Smoothing \tabularnewline
Parameter & Value \tabularnewline
alpha & 0.94877810070843 \tabularnewline
beta & 0.264457573588829 \tabularnewline
gamma & 1 \tabularnewline
\hline
\end{tabular}
%Source: https://freestatistics.org/blog/index.php?pk=42019&T=1

[TABLE]
[ROW][C]Estimated Parameters of Exponential Smoothing[/C][/ROW]
[ROW][C]Parameter[/C][C]Value[/C][/ROW]
[ROW][C]alpha[/C][C]0.94877810070843[/C][/ROW]
[ROW][C]beta[/C][C]0.264457573588829[/C][/ROW]
[ROW][C]gamma[/C][C]1[/C][/ROW]
[/TABLE]
Source: https://freestatistics.org/blog/index.php?pk=42019&T=1

Globally Unique Identifier (entire table): ba.freestatistics.org/blog/index.php?pk=42019&T=1

As an alternative you can also use a QR Code:  

The GUIDs for individual cells are displayed in the table below:

Estimated Parameters of Exponential Smoothing
ParameterValue
alpha0.94877810070843
beta0.264457573588829
gamma1


Interpolation Forecasts of Exponential Smoothing
tObservedFittedResiduals
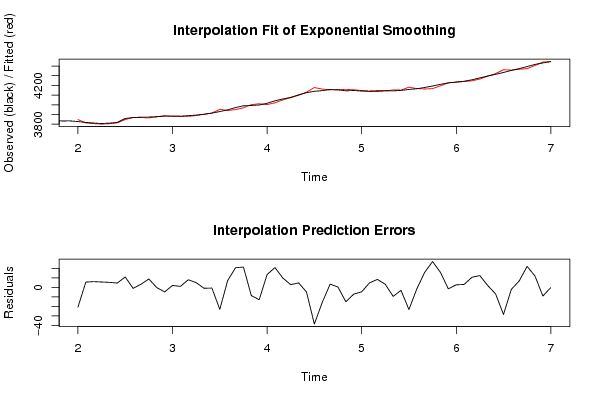
133826.83847.46652333828-20.6665233382782
143818.23812.586128237815.61387176218886
153811.43805.278156759026.12184324098416
163806.83801.103648744575.69635125542572
173810.33804.957561729775.34243827022692
183818.23813.582464895854.61753510415292
193858.93847.8870742731911.0129257268072
203867.83868.79801811904-0.99801811903717
213872.33868.911526897623.38847310238089
223873.33864.417565662218.88243433778916
233876.73876.84934061016-0.149340610159925
243882.63887.29222191269-4.69222191268636
253883.53881.37949053132.12050946870113
263882.23881.129507343671.07049265633032
273888.13880.022701128588.07729887142432
283893.73888.634250963815.06574903619139
293901.93902.80779413922-0.90779413922246
303914.33914.93366863109-0.633668631090586
313930.33953.44356592619-23.1435659261888
323948.33940.998099182877.30190081713363
333971.53950.7985169427420.7014830572607
343990.13968.6742869418621.4257130581386
3539934001.55741553316-8.55741553315966
3639984010.90624409420-12.9062440941962
374015.84002.2884323208413.5115676791561
384041.24020.2909593332320.9090406667701
394060.74050.774805978629.92519402138396
404076.74073.831878653412.86812134659067
4141034098.219280173744.7807198262617
424125.34130.01735958948-4.71735958948011
434139.74178.18844262100-38.4884426210047
444146.74162.46619561426-15.7661956142592
4541584154.496558340733.5034416592689
464155.14154.721888332810.378111667188932
474144.84159.828803484-15.0288034839996
484148.24155.24402569768-7.04402569768263
494142.54147.10663009876-4.60663009876225
504142.14137.276348666244.82365133376061
514145.44136.947108866918.45289113308718
524146.34142.967403521833.3325964781734
534143.54152.89200115352-9.39200115352196
544149.24152.21907764142-3.01907764141743
554158.94182.14579974345-23.2457997434476
564166.14167.60261032765-1.50261032764593
574179.14163.2387323129415.8612676870607
584194.44167.1796832672427.2203167327561
594211.74195.8616914135615.8383085864371
604226.34227.74430753045-1.44430753044799
614235.84233.044079606192.75592039380808
624243.64240.436647691673.16335230832556
634258.74247.9977574377210.7022425622763
644278.24265.7011693360212.4988306639816
6542984295.981622335032.01837766496828
664315.14321.82695392218-6.72695392218247
674334.34362.69599795859-28.3959979585907
6843564357.9570673634-1.95706736340071
6943744367.076872413946.92312758606477
704395.54373.2855472834022.2144527166038
714417.84405.8072624078611.9927375921388
724432.84441.84042947121-9.04042947120615
734446.34446.49322031745-0.193220317454688

\begin{tabular}{lllllllll}
\hline
Interpolation Forecasts of Exponential Smoothing \tabularnewline
t & Observed & Fitted & Residuals \tabularnewline
13 & 3826.8 & 3847.46652333828 & -20.6665233382782 \tabularnewline
14 & 3818.2 & 3812.58612823781 & 5.61387176218886 \tabularnewline
15 & 3811.4 & 3805.27815675902 & 6.12184324098416 \tabularnewline
16 & 3806.8 & 3801.10364874457 & 5.69635125542572 \tabularnewline
17 & 3810.3 & 3804.95756172977 & 5.34243827022692 \tabularnewline
18 & 3818.2 & 3813.58246489585 & 4.61753510415292 \tabularnewline
19 & 3858.9 & 3847.88707427319 & 11.0129257268072 \tabularnewline
20 & 3867.8 & 3868.79801811904 & -0.99801811903717 \tabularnewline
21 & 3872.3 & 3868.91152689762 & 3.38847310238089 \tabularnewline
22 & 3873.3 & 3864.41756566221 & 8.88243433778916 \tabularnewline
23 & 3876.7 & 3876.84934061016 & -0.149340610159925 \tabularnewline
24 & 3882.6 & 3887.29222191269 & -4.69222191268636 \tabularnewline
25 & 3883.5 & 3881.3794905313 & 2.12050946870113 \tabularnewline
26 & 3882.2 & 3881.12950734367 & 1.07049265633032 \tabularnewline
27 & 3888.1 & 3880.02270112858 & 8.07729887142432 \tabularnewline
28 & 3893.7 & 3888.63425096381 & 5.06574903619139 \tabularnewline
29 & 3901.9 & 3902.80779413922 & -0.90779413922246 \tabularnewline
30 & 3914.3 & 3914.93366863109 & -0.633668631090586 \tabularnewline
31 & 3930.3 & 3953.44356592619 & -23.1435659261888 \tabularnewline
32 & 3948.3 & 3940.99809918287 & 7.30190081713363 \tabularnewline
33 & 3971.5 & 3950.79851694274 & 20.7014830572607 \tabularnewline
34 & 3990.1 & 3968.67428694186 & 21.4257130581386 \tabularnewline
35 & 3993 & 4001.55741553316 & -8.55741553315966 \tabularnewline
36 & 3998 & 4010.90624409420 & -12.9062440941962 \tabularnewline
37 & 4015.8 & 4002.28843232084 & 13.5115676791561 \tabularnewline
38 & 4041.2 & 4020.29095933323 & 20.9090406667701 \tabularnewline
39 & 4060.7 & 4050.77480597862 & 9.92519402138396 \tabularnewline
40 & 4076.7 & 4073.83187865341 & 2.86812134659067 \tabularnewline
41 & 4103 & 4098.21928017374 & 4.7807198262617 \tabularnewline
42 & 4125.3 & 4130.01735958948 & -4.71735958948011 \tabularnewline
43 & 4139.7 & 4178.18844262100 & -38.4884426210047 \tabularnewline
44 & 4146.7 & 4162.46619561426 & -15.7661956142592 \tabularnewline
45 & 4158 & 4154.49655834073 & 3.5034416592689 \tabularnewline
46 & 4155.1 & 4154.72188833281 & 0.378111667188932 \tabularnewline
47 & 4144.8 & 4159.828803484 & -15.0288034839996 \tabularnewline
48 & 4148.2 & 4155.24402569768 & -7.04402569768263 \tabularnewline
49 & 4142.5 & 4147.10663009876 & -4.60663009876225 \tabularnewline
50 & 4142.1 & 4137.27634866624 & 4.82365133376061 \tabularnewline
51 & 4145.4 & 4136.94710886691 & 8.45289113308718 \tabularnewline
52 & 4146.3 & 4142.96740352183 & 3.3325964781734 \tabularnewline
53 & 4143.5 & 4152.89200115352 & -9.39200115352196 \tabularnewline
54 & 4149.2 & 4152.21907764142 & -3.01907764141743 \tabularnewline
55 & 4158.9 & 4182.14579974345 & -23.2457997434476 \tabularnewline
56 & 4166.1 & 4167.60261032765 & -1.50261032764593 \tabularnewline
57 & 4179.1 & 4163.23873231294 & 15.8612676870607 \tabularnewline
58 & 4194.4 & 4167.17968326724 & 27.2203167327561 \tabularnewline
59 & 4211.7 & 4195.86169141356 & 15.8383085864371 \tabularnewline
60 & 4226.3 & 4227.74430753045 & -1.44430753044799 \tabularnewline
61 & 4235.8 & 4233.04407960619 & 2.75592039380808 \tabularnewline
62 & 4243.6 & 4240.43664769167 & 3.16335230832556 \tabularnewline
63 & 4258.7 & 4247.99775743772 & 10.7022425622763 \tabularnewline
64 & 4278.2 & 4265.70116933602 & 12.4988306639816 \tabularnewline
65 & 4298 & 4295.98162233503 & 2.01837766496828 \tabularnewline
66 & 4315.1 & 4321.82695392218 & -6.72695392218247 \tabularnewline
67 & 4334.3 & 4362.69599795859 & -28.3959979585907 \tabularnewline
68 & 4356 & 4357.9570673634 & -1.95706736340071 \tabularnewline
69 & 4374 & 4367.07687241394 & 6.92312758606477 \tabularnewline
70 & 4395.5 & 4373.28554728340 & 22.2144527166038 \tabularnewline
71 & 4417.8 & 4405.80726240786 & 11.9927375921388 \tabularnewline
72 & 4432.8 & 4441.84042947121 & -9.04042947120615 \tabularnewline
73 & 4446.3 & 4446.49322031745 & -0.193220317454688 \tabularnewline
\hline
\end{tabular}
%Source: https://freestatistics.org/blog/index.php?pk=42019&T=2

[TABLE]
[ROW][C]Interpolation Forecasts of Exponential Smoothing[/C][/ROW]
[ROW][C]t[/C][C]Observed[/C][C]Fitted[/C][C]Residuals[/C][/ROW]
[ROW][C]13[/C][C]3826.8[/C][C]3847.46652333828[/C][C]-20.6665233382782[/C][/ROW]
[ROW][C]14[/C][C]3818.2[/C][C]3812.58612823781[/C][C]5.61387176218886[/C][/ROW]
[ROW][C]15[/C][C]3811.4[/C][C]3805.27815675902[/C][C]6.12184324098416[/C][/ROW]
[ROW][C]16[/C][C]3806.8[/C][C]3801.10364874457[/C][C]5.69635125542572[/C][/ROW]
[ROW][C]17[/C][C]3810.3[/C][C]3804.95756172977[/C][C]5.34243827022692[/C][/ROW]
[ROW][C]18[/C][C]3818.2[/C][C]3813.58246489585[/C][C]4.61753510415292[/C][/ROW]
[ROW][C]19[/C][C]3858.9[/C][C]3847.88707427319[/C][C]11.0129257268072[/C][/ROW]
[ROW][C]20[/C][C]3867.8[/C][C]3868.79801811904[/C][C]-0.99801811903717[/C][/ROW]
[ROW][C]21[/C][C]3872.3[/C][C]3868.91152689762[/C][C]3.38847310238089[/C][/ROW]
[ROW][C]22[/C][C]3873.3[/C][C]3864.41756566221[/C][C]8.88243433778916[/C][/ROW]
[ROW][C]23[/C][C]3876.7[/C][C]3876.84934061016[/C][C]-0.149340610159925[/C][/ROW]
[ROW][C]24[/C][C]3882.6[/C][C]3887.29222191269[/C][C]-4.69222191268636[/C][/ROW]
[ROW][C]25[/C][C]3883.5[/C][C]3881.3794905313[/C][C]2.12050946870113[/C][/ROW]
[ROW][C]26[/C][C]3882.2[/C][C]3881.12950734367[/C][C]1.07049265633032[/C][/ROW]
[ROW][C]27[/C][C]3888.1[/C][C]3880.02270112858[/C][C]8.07729887142432[/C][/ROW]
[ROW][C]28[/C][C]3893.7[/C][C]3888.63425096381[/C][C]5.06574903619139[/C][/ROW]
[ROW][C]29[/C][C]3901.9[/C][C]3902.80779413922[/C][C]-0.90779413922246[/C][/ROW]
[ROW][C]30[/C][C]3914.3[/C][C]3914.93366863109[/C][C]-0.633668631090586[/C][/ROW]
[ROW][C]31[/C][C]3930.3[/C][C]3953.44356592619[/C][C]-23.1435659261888[/C][/ROW]
[ROW][C]32[/C][C]3948.3[/C][C]3940.99809918287[/C][C]7.30190081713363[/C][/ROW]
[ROW][C]33[/C][C]3971.5[/C][C]3950.79851694274[/C][C]20.7014830572607[/C][/ROW]
[ROW][C]34[/C][C]3990.1[/C][C]3968.67428694186[/C][C]21.4257130581386[/C][/ROW]
[ROW][C]35[/C][C]3993[/C][C]4001.55741553316[/C][C]-8.55741553315966[/C][/ROW]
[ROW][C]36[/C][C]3998[/C][C]4010.90624409420[/C][C]-12.9062440941962[/C][/ROW]
[ROW][C]37[/C][C]4015.8[/C][C]4002.28843232084[/C][C]13.5115676791561[/C][/ROW]
[ROW][C]38[/C][C]4041.2[/C][C]4020.29095933323[/C][C]20.9090406667701[/C][/ROW]
[ROW][C]39[/C][C]4060.7[/C][C]4050.77480597862[/C][C]9.92519402138396[/C][/ROW]
[ROW][C]40[/C][C]4076.7[/C][C]4073.83187865341[/C][C]2.86812134659067[/C][/ROW]
[ROW][C]41[/C][C]4103[/C][C]4098.21928017374[/C][C]4.7807198262617[/C][/ROW]
[ROW][C]42[/C][C]4125.3[/C][C]4130.01735958948[/C][C]-4.71735958948011[/C][/ROW]
[ROW][C]43[/C][C]4139.7[/C][C]4178.18844262100[/C][C]-38.4884426210047[/C][/ROW]
[ROW][C]44[/C][C]4146.7[/C][C]4162.46619561426[/C][C]-15.7661956142592[/C][/ROW]
[ROW][C]45[/C][C]4158[/C][C]4154.49655834073[/C][C]3.5034416592689[/C][/ROW]
[ROW][C]46[/C][C]4155.1[/C][C]4154.72188833281[/C][C]0.378111667188932[/C][/ROW]
[ROW][C]47[/C][C]4144.8[/C][C]4159.828803484[/C][C]-15.0288034839996[/C][/ROW]
[ROW][C]48[/C][C]4148.2[/C][C]4155.24402569768[/C][C]-7.04402569768263[/C][/ROW]
[ROW][C]49[/C][C]4142.5[/C][C]4147.10663009876[/C][C]-4.60663009876225[/C][/ROW]
[ROW][C]50[/C][C]4142.1[/C][C]4137.27634866624[/C][C]4.82365133376061[/C][/ROW]
[ROW][C]51[/C][C]4145.4[/C][C]4136.94710886691[/C][C]8.45289113308718[/C][/ROW]
[ROW][C]52[/C][C]4146.3[/C][C]4142.96740352183[/C][C]3.3325964781734[/C][/ROW]
[ROW][C]53[/C][C]4143.5[/C][C]4152.89200115352[/C][C]-9.39200115352196[/C][/ROW]
[ROW][C]54[/C][C]4149.2[/C][C]4152.21907764142[/C][C]-3.01907764141743[/C][/ROW]
[ROW][C]55[/C][C]4158.9[/C][C]4182.14579974345[/C][C]-23.2457997434476[/C][/ROW]
[ROW][C]56[/C][C]4166.1[/C][C]4167.60261032765[/C][C]-1.50261032764593[/C][/ROW]
[ROW][C]57[/C][C]4179.1[/C][C]4163.23873231294[/C][C]15.8612676870607[/C][/ROW]
[ROW][C]58[/C][C]4194.4[/C][C]4167.17968326724[/C][C]27.2203167327561[/C][/ROW]
[ROW][C]59[/C][C]4211.7[/C][C]4195.86169141356[/C][C]15.8383085864371[/C][/ROW]
[ROW][C]60[/C][C]4226.3[/C][C]4227.74430753045[/C][C]-1.44430753044799[/C][/ROW]
[ROW][C]61[/C][C]4235.8[/C][C]4233.04407960619[/C][C]2.75592039380808[/C][/ROW]
[ROW][C]62[/C][C]4243.6[/C][C]4240.43664769167[/C][C]3.16335230832556[/C][/ROW]
[ROW][C]63[/C][C]4258.7[/C][C]4247.99775743772[/C][C]10.7022425622763[/C][/ROW]
[ROW][C]64[/C][C]4278.2[/C][C]4265.70116933602[/C][C]12.4988306639816[/C][/ROW]
[ROW][C]65[/C][C]4298[/C][C]4295.98162233503[/C][C]2.01837766496828[/C][/ROW]
[ROW][C]66[/C][C]4315.1[/C][C]4321.82695392218[/C][C]-6.72695392218247[/C][/ROW]
[ROW][C]67[/C][C]4334.3[/C][C]4362.69599795859[/C][C]-28.3959979585907[/C][/ROW]
[ROW][C]68[/C][C]4356[/C][C]4357.9570673634[/C][C]-1.95706736340071[/C][/ROW]
[ROW][C]69[/C][C]4374[/C][C]4367.07687241394[/C][C]6.92312758606477[/C][/ROW]
[ROW][C]70[/C][C]4395.5[/C][C]4373.28554728340[/C][C]22.2144527166038[/C][/ROW]
[ROW][C]71[/C][C]4417.8[/C][C]4405.80726240786[/C][C]11.9927375921388[/C][/ROW]
[ROW][C]72[/C][C]4432.8[/C][C]4441.84042947121[/C][C]-9.04042947120615[/C][/ROW]
[ROW][C]73[/C][C]4446.3[/C][C]4446.49322031745[/C][C]-0.193220317454688[/C][/ROW]
[/TABLE]
Source: https://freestatistics.org/blog/index.php?pk=42019&T=2

Globally Unique Identifier (entire table): ba.freestatistics.org/blog/index.php?pk=42019&T=2

As an alternative you can also use a QR Code:  

The GUIDs for individual cells are displayed in the table below:

Interpolation Forecasts of Exponential Smoothing
tObservedFittedResiduals
133826.83847.46652333828-20.6665233382782
143818.23812.586128237815.61387176218886
153811.43805.278156759026.12184324098416
163806.83801.103648744575.69635125542572
173810.33804.957561729775.34243827022692
183818.23813.582464895854.61753510415292
193858.93847.8870742731911.0129257268072
203867.83868.79801811904-0.99801811903717
213872.33868.911526897623.38847310238089
223873.33864.417565662218.88243433778916
233876.73876.84934061016-0.149340610159925
243882.63887.29222191269-4.69222191268636
253883.53881.37949053132.12050946870113
263882.23881.129507343671.07049265633032
273888.13880.022701128588.07729887142432
283893.73888.634250963815.06574903619139
293901.93902.80779413922-0.90779413922246
303914.33914.93366863109-0.633668631090586
313930.33953.44356592619-23.1435659261888
323948.33940.998099182877.30190081713363
333971.53950.7985169427420.7014830572607
343990.13968.6742869418621.4257130581386
3539934001.55741553316-8.55741553315966
3639984010.90624409420-12.9062440941962
374015.84002.2884323208413.5115676791561
384041.24020.2909593332320.9090406667701
394060.74050.774805978629.92519402138396
404076.74073.831878653412.86812134659067
4141034098.219280173744.7807198262617
424125.34130.01735958948-4.71735958948011
434139.74178.18844262100-38.4884426210047
444146.74162.46619561426-15.7661956142592
4541584154.496558340733.5034416592689
464155.14154.721888332810.378111667188932
474144.84159.828803484-15.0288034839996
484148.24155.24402569768-7.04402569768263
494142.54147.10663009876-4.60663009876225
504142.14137.276348666244.82365133376061
514145.44136.947108866918.45289113308718
524146.34142.967403521833.3325964781734
534143.54152.89200115352-9.39200115352196
544149.24152.21907764142-3.01907764141743
554158.94182.14579974345-23.2457997434476
564166.14167.60261032765-1.50261032764593
574179.14163.2387323129415.8612676870607
584194.44167.1796832672427.2203167327561
594211.74195.8616914135615.8383085864371
604226.34227.74430753045-1.44430753044799
614235.84233.044079606192.75592039380808
624243.64240.436647691673.16335230832556
634258.74247.9977574377210.7022425622763
644278.24265.7011693360212.4988306639816
6542984295.981622335032.01837766496828
664315.14321.82695392218-6.72695392218247
674334.34362.69599795859-28.3959979585907
6843564357.9570673634-1.95706736340071
6943744367.076872413946.92312758606477
704395.54373.2855472834022.2144527166038
714417.84405.8072624078611.9927375921388
724432.84441.84042947121-9.04042947120615
734446.34446.49322031745-0.193220317454688


Extrapolation Forecasts of Exponential Smoothing
tForecast95% Lower Bound95% Upper Bound
744456.562365782114432.23056280184480.89416876242
754466.122374256874428.164465477464504.08028303627
764475.701359428324423.962059418434527.44065943822
774492.738706370144426.52830093894558.94911180139
784515.096135556114433.579590063404596.61268104882
794562.921119358794464.778976529414661.06326218817
804594.678280756234479.340068475314710.01649303716
814614.190858563734481.151371815694747.23034531176
824620.238158385184469.178868756434771.29744801392
834631.508586522244461.610705628624801.40646741586
844652.908991973864463.119750974934842.6982329728
854666.310488460464457.692043913344874.92893300759

\begin{tabular}{lllllllll}
\hline
Extrapolation Forecasts of Exponential Smoothing \tabularnewline
t & Forecast & 95% Lower Bound & 95% Upper Bound \tabularnewline
74 & 4456.56236578211 & 4432.2305628018 & 4480.89416876242 \tabularnewline
75 & 4466.12237425687 & 4428.16446547746 & 4504.08028303627 \tabularnewline
76 & 4475.70135942832 & 4423.96205941843 & 4527.44065943822 \tabularnewline
77 & 4492.73870637014 & 4426.5283009389 & 4558.94911180139 \tabularnewline
78 & 4515.09613555611 & 4433.57959006340 & 4596.61268104882 \tabularnewline
79 & 4562.92111935879 & 4464.77897652941 & 4661.06326218817 \tabularnewline
80 & 4594.67828075623 & 4479.34006847531 & 4710.01649303716 \tabularnewline
81 & 4614.19085856373 & 4481.15137181569 & 4747.23034531176 \tabularnewline
82 & 4620.23815838518 & 4469.17886875643 & 4771.29744801392 \tabularnewline
83 & 4631.50858652224 & 4461.61070562862 & 4801.40646741586 \tabularnewline
84 & 4652.90899197386 & 4463.11975097493 & 4842.6982329728 \tabularnewline
85 & 4666.31048846046 & 4457.69204391334 & 4874.92893300759 \tabularnewline
\hline
\end{tabular}
%Source: https://freestatistics.org/blog/index.php?pk=42019&T=3

[TABLE]
[ROW][C]Extrapolation Forecasts of Exponential Smoothing[/C][/ROW]
[ROW][C]t[/C][C]Forecast[/C][C]95% Lower Bound[/C][C]95% Upper Bound[/C][/ROW]
[ROW][C]74[/C][C]4456.56236578211[/C][C]4432.2305628018[/C][C]4480.89416876242[/C][/ROW]
[ROW][C]75[/C][C]4466.12237425687[/C][C]4428.16446547746[/C][C]4504.08028303627[/C][/ROW]
[ROW][C]76[/C][C]4475.70135942832[/C][C]4423.96205941843[/C][C]4527.44065943822[/C][/ROW]
[ROW][C]77[/C][C]4492.73870637014[/C][C]4426.5283009389[/C][C]4558.94911180139[/C][/ROW]
[ROW][C]78[/C][C]4515.09613555611[/C][C]4433.57959006340[/C][C]4596.61268104882[/C][/ROW]
[ROW][C]79[/C][C]4562.92111935879[/C][C]4464.77897652941[/C][C]4661.06326218817[/C][/ROW]
[ROW][C]80[/C][C]4594.67828075623[/C][C]4479.34006847531[/C][C]4710.01649303716[/C][/ROW]
[ROW][C]81[/C][C]4614.19085856373[/C][C]4481.15137181569[/C][C]4747.23034531176[/C][/ROW]
[ROW][C]82[/C][C]4620.23815838518[/C][C]4469.17886875643[/C][C]4771.29744801392[/C][/ROW]
[ROW][C]83[/C][C]4631.50858652224[/C][C]4461.61070562862[/C][C]4801.40646741586[/C][/ROW]
[ROW][C]84[/C][C]4652.90899197386[/C][C]4463.11975097493[/C][C]4842.6982329728[/C][/ROW]
[ROW][C]85[/C][C]4666.31048846046[/C][C]4457.69204391334[/C][C]4874.92893300759[/C][/ROW]
[/TABLE]
Source: https://freestatistics.org/blog/index.php?pk=42019&T=3

Globally Unique Identifier (entire table): ba.freestatistics.org/blog/index.php?pk=42019&T=3

As an alternative you can also use a QR Code:  

The GUIDs for individual cells are displayed in the table below:

Extrapolation Forecasts of Exponential Smoothing
tForecast95% Lower Bound95% Upper Bound
744456.562365782114432.23056280184480.89416876242
754466.122374256874428.164465477464504.08028303627
764475.701359428324423.962059418434527.44065943822
774492.738706370144426.52830093894558.94911180139
784515.096135556114433.579590063404596.61268104882
794562.921119358794464.778976529414661.06326218817
804594.678280756234479.340068475314710.01649303716
814614.190858563734481.151371815694747.23034531176
824620.238158385184469.178868756434771.29744801392
834631.508586522244461.610705628624801.40646741586
844652.908991973864463.119750974934842.6982329728
854666.310488460464457.692043913344874.92893300759


Parameters (Session):
par1 = 12 ; par2 = Triple ; par3 = multiplicative ;
Parameters (R input):
par1 = 12 ; par2 = Triple ; par3 = multiplicative ;
R code (references can be found in the software module):
par1 <- as.numeric(par1)
if (par2 == 'Single') K <- 1
if (par2 == 'Double') K <- 2
if (par2 == 'Triple') K <- par1
nx <- length(x)
nxmK <- nx - K
x <- ts(x, frequency = par1)
if (par2 == 'Single') fit <- HoltWinters(x, gamma=0, beta=0)
if (par2 == 'Double') fit <- HoltWinters(x, gamma=0)
if (par2 == 'Triple') fit <- HoltWinters(x, seasonal=par3)
fit
myresid <- x - fit$fitted[,'xhat']
bitmap(file='test1.png')
op <- par(mfrow=c(2,1))
plot(fit,ylab='Observed (black) / Fitted (red)',main='Interpolation Fit of Exponential Smoothing')
plot(myresid,ylab='Residuals',main='Interpolation Prediction Errors')
par(op)
dev.off()
bitmap(file='test2.png')
p <- predict(fit, par1, prediction.interval=TRUE)
np <- length(p[,1])
plot(fit,p,ylab='Observed (black) / Fitted (red)',main='Extrapolation Fit of Exponential Smoothing')
dev.off()
bitmap(file='test3.png')
op <- par(mfrow = c(2,2))
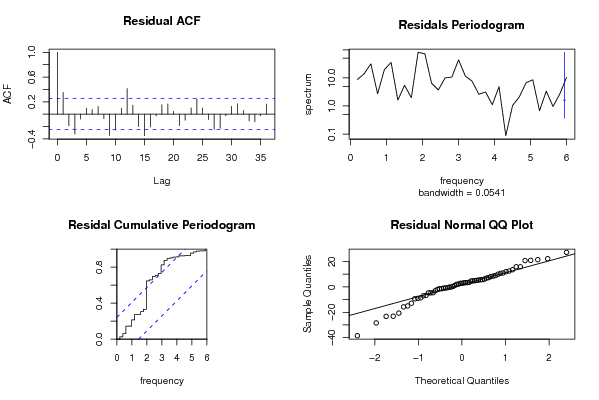
acf(as.numeric(myresid),lag.max = nx/2,main='Residual ACF')
spectrum(myresid,main='Residals Periodogram')
cpgram(myresid,main='Residal Cumulative Periodogram')
qqnorm(myresid,main='Residual Normal QQ Plot')
qqline(myresid)
par(op)
dev.off()
load(file='createtable')
a<-table.start()
a<-table.row.start(a)
a<-table.element(a,'Estimated Parameters of Exponential Smoothing',2,TRUE)
a<-table.row.end(a)
a<-table.row.start(a)
a<-table.element(a,'Parameter',header=TRUE)
a<-table.element(a,'Value',header=TRUE)
a<-table.row.end(a)
a<-table.row.start(a)
a<-table.element(a,'alpha',header=TRUE)
a<-table.element(a,fit$alpha)
a<-table.row.end(a)
a<-table.row.start(a)
a<-table.element(a,'beta',header=TRUE)
a<-table.element(a,fit$beta)
a<-table.row.end(a)
a<-table.row.start(a)
a<-table.element(a,'gamma',header=TRUE)
a<-table.element(a,fit$gamma)
a<-table.row.end(a)
a<-table.end(a)
table.save(a,file='mytable.tab')
a<-table.start()
a<-table.row.start(a)
a<-table.element(a,'Interpolation Forecasts of Exponential Smoothing',4,TRUE)
a<-table.row.end(a)
a<-table.row.start(a)
a<-table.element(a,'t',header=TRUE)
a<-table.element(a,'Observed',header=TRUE)
a<-table.element(a,'Fitted',header=TRUE)
a<-table.element(a,'Residuals',header=TRUE)
a<-table.row.end(a)
for (i in 1:nxmK) {
a<-table.row.start(a)
a<-table.element(a,i+K,header=TRUE)
a<-table.element(a,x[i+K])
a<-table.element(a,fit$fitted[i,'xhat'])
a<-table.element(a,myresid[i])
a<-table.row.end(a)
}
a<-table.end(a)
table.save(a,file='mytable1.tab')
a<-table.start()
a<-table.row.start(a)
a<-table.element(a,'Extrapolation Forecasts of Exponential Smoothing',4,TRUE)
a<-table.row.end(a)
a<-table.row.start(a)
a<-table.element(a,'t',header=TRUE)
a<-table.element(a,'Forecast',header=TRUE)
a<-table.element(a,'95% Lower Bound',header=TRUE)
a<-table.element(a,'95% Upper Bound',header=TRUE)
a<-table.row.end(a)
for (i in 1:np) {
a<-table.row.start(a)
a<-table.element(a,nx+i,header=TRUE)
a<-table.element(a,p[i,'fit'])
a<-table.element(a,p[i,'lwr'])
a<-table.element(a,p[i,'upr'])
a<-table.row.end(a)
}
a<-table.end(a)
table.save(a,file='mytable2.tab')