Free Statistics

of Irreproducible Research!

Author's title

Author*Unverified author*
R Software Modulerwasp_exponentialsmoothing.wasp
Title produced by softwareExponential Smoothing
Date of computationSat, 06 Jun 2009 05:35:11 -0600
Cite this page as followsStatistical Computations at FreeStatistics.org, Office for Research Development and Education, URL https://freestatistics.org/blog/index.php?v=date/2009/Jun/06/t1244288191ymfflby88z6zqc3.htm/, Retrieved Mon, 29 Apr 2024 05:39:13 +0000
Statistical Computations at FreeStatistics.org, Office for Research Development and Education, URL https://freestatistics.org/blog/index.php?pk=41968, Retrieved Mon, 29 Apr 2024 05:39:13 +0000
QR Codes:

Original text written by user:
IsPrivate?No (this computation is public)
User-defined keywords
Estimated Impact146
Family? (F = Feedback message, R = changed R code, M = changed R Module, P = changed Parameters, D = changed Data)
-     [Bootstrap Plot - Central Tendency] [bootstrapplot] [2009-06-04 15:33:12] [74be16979710d4c4e7c6647856088456]
- RMPD  [Exponential Smoothing] [opgave10W.Verlinden] [2009-06-05 15:07:33] [74be16979710d4c4e7c6647856088456]
-         [Exponential Smoothing] [opgave 10 dennis gys] [2009-06-06 11:28:51] [74be16979710d4c4e7c6647856088456]
-    D        [Exponential Smoothing] [opgave 10(2) denn...] [2009-06-06 11:35:11] [d41d8cd98f00b204e9800998ecf8427e] [Current]
Feedback Forum

Post a new message
Dataseries X:
10.738
10.171
9.721
9.897
9.828
9.924
10.371
10.846
10.413
10.709
10.662
10.570
10.297
10.635
10.872
10.296
10.383
10.431
10.574
10.653
10.805
10.872
10.625
10.407
10.463
10.556
10.646
10.702
11.353
11.346
11.451
11.964
12.574
13.031
13.812
14.544
14.931
14.886
16.005
17.064
15.168
16.050
15.839
15.137
14.954
15.648
15.305
15.579
16.348
15.928
16.171
15.937
15.713
15.594
15.683
16.438
17.032
17.696
17.745
19.394
20.148
20.108
18.584
18.441
18.391
19.178
18.079
18.483
19.644
19.195
19.650
20.830


Summary of computational transaction
Raw Inputview raw input (R code)
Raw Outputview raw output of R engine
Computing time1 seconds
R Server'Gwilym Jenkins' @ 72.249.127.135

\begin{tabular}{lllllllll}
\hline
Summary of computational transaction \tabularnewline
Raw Input & view raw input (R code)  \tabularnewline
Raw Output & view raw output of R engine  \tabularnewline
Computing time & 1 seconds \tabularnewline
R Server & 'Gwilym Jenkins' @ 72.249.127.135 \tabularnewline
\hline
\end{tabular}
%Source: https://freestatistics.org/blog/index.php?pk=41968&T=0

[TABLE]
[ROW][C]Summary of computational transaction[/C][/ROW]
[ROW][C]Raw Input[/C][C]view raw input (R code) [/C][/ROW]
[ROW][C]Raw Output[/C][C]view raw output of R engine [/C][/ROW]
[ROW][C]Computing time[/C][C]1 seconds[/C][/ROW]
[ROW][C]R Server[/C][C]'Gwilym Jenkins' @ 72.249.127.135[/C][/ROW]
[/TABLE]
Source: https://freestatistics.org/blog/index.php?pk=41968&T=0

Globally Unique Identifier (entire table): ba.freestatistics.org/blog/index.php?pk=41968&T=0

As an alternative you can also use a QR Code:  

The GUIDs for individual cells are displayed in the table below:

Summary of computational transaction
Raw Inputview raw input (R code)
Raw Outputview raw output of R engine
Computing time1 seconds
R Server'Gwilym Jenkins' @ 72.249.127.135


Estimated Parameters of Exponential Smoothing
ParameterValue
alpha0.734065025144526
beta0.0248623119871675
gamma1

\begin{tabular}{lllllllll}
\hline
Estimated Parameters of Exponential Smoothing \tabularnewline
Parameter & Value \tabularnewline
alpha & 0.734065025144526 \tabularnewline
beta & 0.0248623119871675 \tabularnewline
gamma & 1 \tabularnewline
\hline
\end{tabular}
%Source: https://freestatistics.org/blog/index.php?pk=41968&T=1

[TABLE]
[ROW][C]Estimated Parameters of Exponential Smoothing[/C][/ROW]
[ROW][C]Parameter[/C][C]Value[/C][/ROW]
[ROW][C]alpha[/C][C]0.734065025144526[/C][/ROW]
[ROW][C]beta[/C][C]0.0248623119871675[/C][/ROW]
[ROW][C]gamma[/C][C]1[/C][/ROW]
[/TABLE]
Source: https://freestatistics.org/blog/index.php?pk=41968&T=1

Globally Unique Identifier (entire table): ba.freestatistics.org/blog/index.php?pk=41968&T=1

As an alternative you can also use a QR Code:  

The GUIDs for individual cells are displayed in the table below:

Estimated Parameters of Exponential Smoothing
ParameterValue
alpha0.734065025144526
beta0.0248623119871675
gamma1


Interpolation Forecasts of Exponential Smoothing
tObservedFittedResiduals
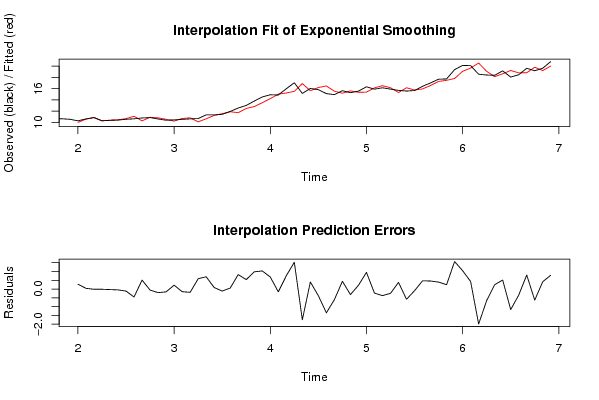
1310.29710.02342628205130.273573717948715
1410.63510.59445800073740.0405419992626399
1510.87210.8862941989203-0.0142941989202647
1610.29610.3097828515273-0.0137828515272513
1710.38310.4142703216996-0.0312703216995658
1810.43110.4799334842889-0.0489334842888773
1910.57410.6905710071398-0.116571007139800
2010.65311.1083057046558-0.455305704655805
2110.80510.29474419338820.510255806611832
2210.87210.9309884014872-0.0589884014871682
2310.62510.8301271080005-0.205127108000454
2410.40710.5687468179479-0.161746817947913
2510.46310.24267799909150.220322000908512
2610.55610.7065360984725-0.150536098472536
2710.64610.8339262919257-0.187926291925704
2810.70210.11732540801170.584674591988321
2911.35310.65462293130090.698377068699068
3011.34611.26266784476770.0833321552323198
3111.45111.5662940594310-0.115294059431035
3211.96411.90879231608530.0552076839147215
3312.57411.74998215620800.82401784379205
3413.03112.49411724050430.536882759495665
3513.81212.83162679380440.980373206195605
3614.54413.51347925641921.03052074358080
3714.93114.24743945833030.683560541669712
3814.88615.0443966308006-0.158396630800594
3916.00515.24760586452110.757394135478927
4017.06415.53917840404011.52482159595990
4115.16816.9227857935655-1.75478579356547
4216.0515.64765948161490.402340518385138
4315.83916.2196307866016-0.380630786601587
4415.13716.4948483322086-1.35784833220859
4514.95415.5595789516196-0.605578951619558
4615.64815.20820910263510.439790897364880
4715.30515.6208858919815-0.315885891981493
4815.57915.36937778041690.209622219583117
4916.34815.39833629074850.949663709251526
5015.92816.1614412189243-0.233441218924302
5116.17116.5464506210905-0.375450621090536
5215.93716.1831991857762-0.246199185776197
5315.71315.33494967959710.378050320402904
5415.59416.1783943624217-0.584394362421724
5515.68315.7790854577268-0.0960854577268098
5616.43815.96976137342010.468238626579939
5717.03216.57480031852680.45719968147316
5817.69617.3007628141230.395237185877001
5917.74517.49814358030110.246856419698858
6019.39417.82811644925841.5658835507416
6120.14819.10285494782971.04514505217028
6220.10819.67655606357740.431443936422632
6318.58420.5791393119491-1.99513931194912
6418.44119.0990134935879-0.658013493587891
6518.39118.14466940412510.246330595874880
6619.17818.66326570382860.514734296171401
6718.07919.2484969907143-1.16949699071426
6818.48318.8295520677096-0.346552067709617
6919.64418.84693515252110.797064847478904
7019.19519.8254946452781-0.63049464527807
7119.6519.23133360010500.418666399895027
7220.8320.04220892708760.787791072912384

\begin{tabular}{lllllllll}
\hline
Interpolation Forecasts of Exponential Smoothing \tabularnewline
t & Observed & Fitted & Residuals \tabularnewline
13 & 10.297 & 10.0234262820513 & 0.273573717948715 \tabularnewline
14 & 10.635 & 10.5944580007374 & 0.0405419992626399 \tabularnewline
15 & 10.872 & 10.8862941989203 & -0.0142941989202647 \tabularnewline
16 & 10.296 & 10.3097828515273 & -0.0137828515272513 \tabularnewline
17 & 10.383 & 10.4142703216996 & -0.0312703216995658 \tabularnewline
18 & 10.431 & 10.4799334842889 & -0.0489334842888773 \tabularnewline
19 & 10.574 & 10.6905710071398 & -0.116571007139800 \tabularnewline
20 & 10.653 & 11.1083057046558 & -0.455305704655805 \tabularnewline
21 & 10.805 & 10.2947441933882 & 0.510255806611832 \tabularnewline
22 & 10.872 & 10.9309884014872 & -0.0589884014871682 \tabularnewline
23 & 10.625 & 10.8301271080005 & -0.205127108000454 \tabularnewline
24 & 10.407 & 10.5687468179479 & -0.161746817947913 \tabularnewline
25 & 10.463 & 10.2426779990915 & 0.220322000908512 \tabularnewline
26 & 10.556 & 10.7065360984725 & -0.150536098472536 \tabularnewline
27 & 10.646 & 10.8339262919257 & -0.187926291925704 \tabularnewline
28 & 10.702 & 10.1173254080117 & 0.584674591988321 \tabularnewline
29 & 11.353 & 10.6546229313009 & 0.698377068699068 \tabularnewline
30 & 11.346 & 11.2626678447677 & 0.0833321552323198 \tabularnewline
31 & 11.451 & 11.5662940594310 & -0.115294059431035 \tabularnewline
32 & 11.964 & 11.9087923160853 & 0.0552076839147215 \tabularnewline
33 & 12.574 & 11.7499821562080 & 0.82401784379205 \tabularnewline
34 & 13.031 & 12.4941172405043 & 0.536882759495665 \tabularnewline
35 & 13.812 & 12.8316267938044 & 0.980373206195605 \tabularnewline
36 & 14.544 & 13.5134792564192 & 1.03052074358080 \tabularnewline
37 & 14.931 & 14.2474394583303 & 0.683560541669712 \tabularnewline
38 & 14.886 & 15.0443966308006 & -0.158396630800594 \tabularnewline
39 & 16.005 & 15.2476058645211 & 0.757394135478927 \tabularnewline
40 & 17.064 & 15.5391784040401 & 1.52482159595990 \tabularnewline
41 & 15.168 & 16.9227857935655 & -1.75478579356547 \tabularnewline
42 & 16.05 & 15.6476594816149 & 0.402340518385138 \tabularnewline
43 & 15.839 & 16.2196307866016 & -0.380630786601587 \tabularnewline
44 & 15.137 & 16.4948483322086 & -1.35784833220859 \tabularnewline
45 & 14.954 & 15.5595789516196 & -0.605578951619558 \tabularnewline
46 & 15.648 & 15.2082091026351 & 0.439790897364880 \tabularnewline
47 & 15.305 & 15.6208858919815 & -0.315885891981493 \tabularnewline
48 & 15.579 & 15.3693777804169 & 0.209622219583117 \tabularnewline
49 & 16.348 & 15.3983362907485 & 0.949663709251526 \tabularnewline
50 & 15.928 & 16.1614412189243 & -0.233441218924302 \tabularnewline
51 & 16.171 & 16.5464506210905 & -0.375450621090536 \tabularnewline
52 & 15.937 & 16.1831991857762 & -0.246199185776197 \tabularnewline
53 & 15.713 & 15.3349496795971 & 0.378050320402904 \tabularnewline
54 & 15.594 & 16.1783943624217 & -0.584394362421724 \tabularnewline
55 & 15.683 & 15.7790854577268 & -0.0960854577268098 \tabularnewline
56 & 16.438 & 15.9697613734201 & 0.468238626579939 \tabularnewline
57 & 17.032 & 16.5748003185268 & 0.45719968147316 \tabularnewline
58 & 17.696 & 17.300762814123 & 0.395237185877001 \tabularnewline
59 & 17.745 & 17.4981435803011 & 0.246856419698858 \tabularnewline
60 & 19.394 & 17.8281164492584 & 1.5658835507416 \tabularnewline
61 & 20.148 & 19.1028549478297 & 1.04514505217028 \tabularnewline
62 & 20.108 & 19.6765560635774 & 0.431443936422632 \tabularnewline
63 & 18.584 & 20.5791393119491 & -1.99513931194912 \tabularnewline
64 & 18.441 & 19.0990134935879 & -0.658013493587891 \tabularnewline
65 & 18.391 & 18.1446694041251 & 0.246330595874880 \tabularnewline
66 & 19.178 & 18.6632657038286 & 0.514734296171401 \tabularnewline
67 & 18.079 & 19.2484969907143 & -1.16949699071426 \tabularnewline
68 & 18.483 & 18.8295520677096 & -0.346552067709617 \tabularnewline
69 & 19.644 & 18.8469351525211 & 0.797064847478904 \tabularnewline
70 & 19.195 & 19.8254946452781 & -0.63049464527807 \tabularnewline
71 & 19.65 & 19.2313336001050 & 0.418666399895027 \tabularnewline
72 & 20.83 & 20.0422089270876 & 0.787791072912384 \tabularnewline
\hline
\end{tabular}
%Source: https://freestatistics.org/blog/index.php?pk=41968&T=2

[TABLE]
[ROW][C]Interpolation Forecasts of Exponential Smoothing[/C][/ROW]
[ROW][C]t[/C][C]Observed[/C][C]Fitted[/C][C]Residuals[/C][/ROW]
[ROW][C]13[/C][C]10.297[/C][C]10.0234262820513[/C][C]0.273573717948715[/C][/ROW]
[ROW][C]14[/C][C]10.635[/C][C]10.5944580007374[/C][C]0.0405419992626399[/C][/ROW]
[ROW][C]15[/C][C]10.872[/C][C]10.8862941989203[/C][C]-0.0142941989202647[/C][/ROW]
[ROW][C]16[/C][C]10.296[/C][C]10.3097828515273[/C][C]-0.0137828515272513[/C][/ROW]
[ROW][C]17[/C][C]10.383[/C][C]10.4142703216996[/C][C]-0.0312703216995658[/C][/ROW]
[ROW][C]18[/C][C]10.431[/C][C]10.4799334842889[/C][C]-0.0489334842888773[/C][/ROW]
[ROW][C]19[/C][C]10.574[/C][C]10.6905710071398[/C][C]-0.116571007139800[/C][/ROW]
[ROW][C]20[/C][C]10.653[/C][C]11.1083057046558[/C][C]-0.455305704655805[/C][/ROW]
[ROW][C]21[/C][C]10.805[/C][C]10.2947441933882[/C][C]0.510255806611832[/C][/ROW]
[ROW][C]22[/C][C]10.872[/C][C]10.9309884014872[/C][C]-0.0589884014871682[/C][/ROW]
[ROW][C]23[/C][C]10.625[/C][C]10.8301271080005[/C][C]-0.205127108000454[/C][/ROW]
[ROW][C]24[/C][C]10.407[/C][C]10.5687468179479[/C][C]-0.161746817947913[/C][/ROW]
[ROW][C]25[/C][C]10.463[/C][C]10.2426779990915[/C][C]0.220322000908512[/C][/ROW]
[ROW][C]26[/C][C]10.556[/C][C]10.7065360984725[/C][C]-0.150536098472536[/C][/ROW]
[ROW][C]27[/C][C]10.646[/C][C]10.8339262919257[/C][C]-0.187926291925704[/C][/ROW]
[ROW][C]28[/C][C]10.702[/C][C]10.1173254080117[/C][C]0.584674591988321[/C][/ROW]
[ROW][C]29[/C][C]11.353[/C][C]10.6546229313009[/C][C]0.698377068699068[/C][/ROW]
[ROW][C]30[/C][C]11.346[/C][C]11.2626678447677[/C][C]0.0833321552323198[/C][/ROW]
[ROW][C]31[/C][C]11.451[/C][C]11.5662940594310[/C][C]-0.115294059431035[/C][/ROW]
[ROW][C]32[/C][C]11.964[/C][C]11.9087923160853[/C][C]0.0552076839147215[/C][/ROW]
[ROW][C]33[/C][C]12.574[/C][C]11.7499821562080[/C][C]0.82401784379205[/C][/ROW]
[ROW][C]34[/C][C]13.031[/C][C]12.4941172405043[/C][C]0.536882759495665[/C][/ROW]
[ROW][C]35[/C][C]13.812[/C][C]12.8316267938044[/C][C]0.980373206195605[/C][/ROW]
[ROW][C]36[/C][C]14.544[/C][C]13.5134792564192[/C][C]1.03052074358080[/C][/ROW]
[ROW][C]37[/C][C]14.931[/C][C]14.2474394583303[/C][C]0.683560541669712[/C][/ROW]
[ROW][C]38[/C][C]14.886[/C][C]15.0443966308006[/C][C]-0.158396630800594[/C][/ROW]
[ROW][C]39[/C][C]16.005[/C][C]15.2476058645211[/C][C]0.757394135478927[/C][/ROW]
[ROW][C]40[/C][C]17.064[/C][C]15.5391784040401[/C][C]1.52482159595990[/C][/ROW]
[ROW][C]41[/C][C]15.168[/C][C]16.9227857935655[/C][C]-1.75478579356547[/C][/ROW]
[ROW][C]42[/C][C]16.05[/C][C]15.6476594816149[/C][C]0.402340518385138[/C][/ROW]
[ROW][C]43[/C][C]15.839[/C][C]16.2196307866016[/C][C]-0.380630786601587[/C][/ROW]
[ROW][C]44[/C][C]15.137[/C][C]16.4948483322086[/C][C]-1.35784833220859[/C][/ROW]
[ROW][C]45[/C][C]14.954[/C][C]15.5595789516196[/C][C]-0.605578951619558[/C][/ROW]
[ROW][C]46[/C][C]15.648[/C][C]15.2082091026351[/C][C]0.439790897364880[/C][/ROW]
[ROW][C]47[/C][C]15.305[/C][C]15.6208858919815[/C][C]-0.315885891981493[/C][/ROW]
[ROW][C]48[/C][C]15.579[/C][C]15.3693777804169[/C][C]0.209622219583117[/C][/ROW]
[ROW][C]49[/C][C]16.348[/C][C]15.3983362907485[/C][C]0.949663709251526[/C][/ROW]
[ROW][C]50[/C][C]15.928[/C][C]16.1614412189243[/C][C]-0.233441218924302[/C][/ROW]
[ROW][C]51[/C][C]16.171[/C][C]16.5464506210905[/C][C]-0.375450621090536[/C][/ROW]
[ROW][C]52[/C][C]15.937[/C][C]16.1831991857762[/C][C]-0.246199185776197[/C][/ROW]
[ROW][C]53[/C][C]15.713[/C][C]15.3349496795971[/C][C]0.378050320402904[/C][/ROW]
[ROW][C]54[/C][C]15.594[/C][C]16.1783943624217[/C][C]-0.584394362421724[/C][/ROW]
[ROW][C]55[/C][C]15.683[/C][C]15.7790854577268[/C][C]-0.0960854577268098[/C][/ROW]
[ROW][C]56[/C][C]16.438[/C][C]15.9697613734201[/C][C]0.468238626579939[/C][/ROW]
[ROW][C]57[/C][C]17.032[/C][C]16.5748003185268[/C][C]0.45719968147316[/C][/ROW]
[ROW][C]58[/C][C]17.696[/C][C]17.300762814123[/C][C]0.395237185877001[/C][/ROW]
[ROW][C]59[/C][C]17.745[/C][C]17.4981435803011[/C][C]0.246856419698858[/C][/ROW]
[ROW][C]60[/C][C]19.394[/C][C]17.8281164492584[/C][C]1.5658835507416[/C][/ROW]
[ROW][C]61[/C][C]20.148[/C][C]19.1028549478297[/C][C]1.04514505217028[/C][/ROW]
[ROW][C]62[/C][C]20.108[/C][C]19.6765560635774[/C][C]0.431443936422632[/C][/ROW]
[ROW][C]63[/C][C]18.584[/C][C]20.5791393119491[/C][C]-1.99513931194912[/C][/ROW]
[ROW][C]64[/C][C]18.441[/C][C]19.0990134935879[/C][C]-0.658013493587891[/C][/ROW]
[ROW][C]65[/C][C]18.391[/C][C]18.1446694041251[/C][C]0.246330595874880[/C][/ROW]
[ROW][C]66[/C][C]19.178[/C][C]18.6632657038286[/C][C]0.514734296171401[/C][/ROW]
[ROW][C]67[/C][C]18.079[/C][C]19.2484969907143[/C][C]-1.16949699071426[/C][/ROW]
[ROW][C]68[/C][C]18.483[/C][C]18.8295520677096[/C][C]-0.346552067709617[/C][/ROW]
[ROW][C]69[/C][C]19.644[/C][C]18.8469351525211[/C][C]0.797064847478904[/C][/ROW]
[ROW][C]70[/C][C]19.195[/C][C]19.8254946452781[/C][C]-0.63049464527807[/C][/ROW]
[ROW][C]71[/C][C]19.65[/C][C]19.2313336001050[/C][C]0.418666399895027[/C][/ROW]
[ROW][C]72[/C][C]20.83[/C][C]20.0422089270876[/C][C]0.787791072912384[/C][/ROW]
[/TABLE]
Source: https://freestatistics.org/blog/index.php?pk=41968&T=2

Globally Unique Identifier (entire table): ba.freestatistics.org/blog/index.php?pk=41968&T=2

As an alternative you can also use a QR Code:  

The GUIDs for individual cells are displayed in the table below:

Interpolation Forecasts of Exponential Smoothing
tObservedFittedResiduals
1310.29710.02342628205130.273573717948715
1410.63510.59445800073740.0405419992626399
1510.87210.8862941989203-0.0142941989202647
1610.29610.3097828515273-0.0137828515272513
1710.38310.4142703216996-0.0312703216995658
1810.43110.4799334842889-0.0489334842888773
1910.57410.6905710071398-0.116571007139800
2010.65311.1083057046558-0.455305704655805
2110.80510.29474419338820.510255806611832
2210.87210.9309884014872-0.0589884014871682
2310.62510.8301271080005-0.205127108000454
2410.40710.5687468179479-0.161746817947913
2510.46310.24267799909150.220322000908512
2610.55610.7065360984725-0.150536098472536
2710.64610.8339262919257-0.187926291925704
2810.70210.11732540801170.584674591988321
2911.35310.65462293130090.698377068699068
3011.34611.26266784476770.0833321552323198
3111.45111.5662940594310-0.115294059431035
3211.96411.90879231608530.0552076839147215
3312.57411.74998215620800.82401784379205
3413.03112.49411724050430.536882759495665
3513.81212.83162679380440.980373206195605
3614.54413.51347925641921.03052074358080
3714.93114.24743945833030.683560541669712
3814.88615.0443966308006-0.158396630800594
3916.00515.24760586452110.757394135478927
4017.06415.53917840404011.52482159595990
4115.16816.9227857935655-1.75478579356547
4216.0515.64765948161490.402340518385138
4315.83916.2196307866016-0.380630786601587
4415.13716.4948483322086-1.35784833220859
4514.95415.5595789516196-0.605578951619558
4615.64815.20820910263510.439790897364880
4715.30515.6208858919815-0.315885891981493
4815.57915.36937778041690.209622219583117
4916.34815.39833629074850.949663709251526
5015.92816.1614412189243-0.233441218924302
5116.17116.5464506210905-0.375450621090536
5215.93716.1831991857762-0.246199185776197
5315.71315.33494967959710.378050320402904
5415.59416.1783943624217-0.584394362421724
5515.68315.7790854577268-0.0960854577268098
5616.43815.96976137342010.468238626579939
5717.03216.57480031852680.45719968147316
5817.69617.3007628141230.395237185877001
5917.74517.49814358030110.246856419698858
6019.39417.82811644925841.5658835507416
6120.14819.10285494782971.04514505217028
6220.10819.67655606357740.431443936422632
6318.58420.5791393119491-1.99513931194912
6418.44119.0990134935879-0.658013493587891
6518.39118.14466940412510.246330595874880
6619.17818.66326570382860.514734296171401
6718.07919.2484969907143-1.16949699071426
6818.48318.8295520677096-0.346552067709617
6919.64418.84693515252110.797064847478904
7019.19519.8254946452781-0.63049464527807
7119.6519.23133360010500.418666399895027
7220.8320.04220892708760.787791072912384


Extrapolation Forecasts of Exponential Smoothing
tForecast95% Lower Bound95% Upper Bound
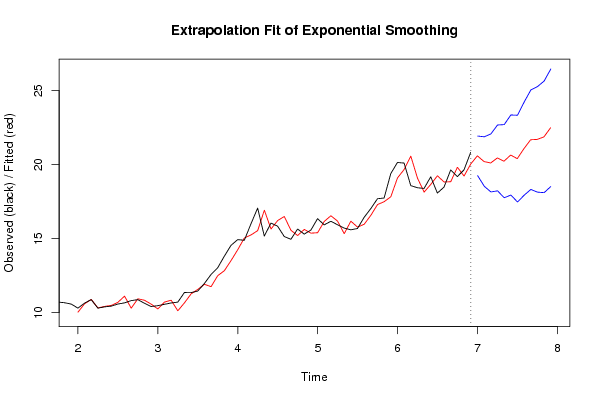
7320.597101066967719.262098793353721.9321033405818
7420.211125382192518.540515927930121.8817348364550
7520.114545499929618.15261401561322.0764769842462
7620.453840717289818.227153506946322.6805279276334
7720.234297678462217.760635300520722.7079600564037
7820.65023320086617.942287246481623.3581791552504
7920.407109819326517.474326092406723.3398935462464
8021.084235319789717.933848024264224.2346226153153
8121.685196407762018.322858274655525.0475345408684
8221.709532115899618.139722530194325.2793417016049
8321.879222271396318.105524397550225.6529201452425
8422.495310020910418.520606198399626.4700138434211

\begin{tabular}{lllllllll}
\hline
Extrapolation Forecasts of Exponential Smoothing \tabularnewline
t & Forecast & 95% Lower Bound & 95% Upper Bound \tabularnewline
73 & 20.5971010669677 & 19.2620987933537 & 21.9321033405818 \tabularnewline
74 & 20.2111253821925 & 18.5405159279301 & 21.8817348364550 \tabularnewline
75 & 20.1145454999296 & 18.152614015613 & 22.0764769842462 \tabularnewline
76 & 20.4538407172898 & 18.2271535069463 & 22.6805279276334 \tabularnewline
77 & 20.2342976784622 & 17.7606353005207 & 22.7079600564037 \tabularnewline
78 & 20.650233200866 & 17.9422872464816 & 23.3581791552504 \tabularnewline
79 & 20.4071098193265 & 17.4743260924067 & 23.3398935462464 \tabularnewline
80 & 21.0842353197897 & 17.9338480242642 & 24.2346226153153 \tabularnewline
81 & 21.6851964077620 & 18.3228582746555 & 25.0475345408684 \tabularnewline
82 & 21.7095321158996 & 18.1397225301943 & 25.2793417016049 \tabularnewline
83 & 21.8792222713963 & 18.1055243975502 & 25.6529201452425 \tabularnewline
84 & 22.4953100209104 & 18.5206061983996 & 26.4700138434211 \tabularnewline
\hline
\end{tabular}
%Source: https://freestatistics.org/blog/index.php?pk=41968&T=3

[TABLE]
[ROW][C]Extrapolation Forecasts of Exponential Smoothing[/C][/ROW]
[ROW][C]t[/C][C]Forecast[/C][C]95% Lower Bound[/C][C]95% Upper Bound[/C][/ROW]
[ROW][C]73[/C][C]20.5971010669677[/C][C]19.2620987933537[/C][C]21.9321033405818[/C][/ROW]
[ROW][C]74[/C][C]20.2111253821925[/C][C]18.5405159279301[/C][C]21.8817348364550[/C][/ROW]
[ROW][C]75[/C][C]20.1145454999296[/C][C]18.152614015613[/C][C]22.0764769842462[/C][/ROW]
[ROW][C]76[/C][C]20.4538407172898[/C][C]18.2271535069463[/C][C]22.6805279276334[/C][/ROW]
[ROW][C]77[/C][C]20.2342976784622[/C][C]17.7606353005207[/C][C]22.7079600564037[/C][/ROW]
[ROW][C]78[/C][C]20.650233200866[/C][C]17.9422872464816[/C][C]23.3581791552504[/C][/ROW]
[ROW][C]79[/C][C]20.4071098193265[/C][C]17.4743260924067[/C][C]23.3398935462464[/C][/ROW]
[ROW][C]80[/C][C]21.0842353197897[/C][C]17.9338480242642[/C][C]24.2346226153153[/C][/ROW]
[ROW][C]81[/C][C]21.6851964077620[/C][C]18.3228582746555[/C][C]25.0475345408684[/C][/ROW]
[ROW][C]82[/C][C]21.7095321158996[/C][C]18.1397225301943[/C][C]25.2793417016049[/C][/ROW]
[ROW][C]83[/C][C]21.8792222713963[/C][C]18.1055243975502[/C][C]25.6529201452425[/C][/ROW]
[ROW][C]84[/C][C]22.4953100209104[/C][C]18.5206061983996[/C][C]26.4700138434211[/C][/ROW]
[/TABLE]
Source: https://freestatistics.org/blog/index.php?pk=41968&T=3

Globally Unique Identifier (entire table): ba.freestatistics.org/blog/index.php?pk=41968&T=3

As an alternative you can also use a QR Code:  

The GUIDs for individual cells are displayed in the table below:

Extrapolation Forecasts of Exponential Smoothing
tForecast95% Lower Bound95% Upper Bound
7320.597101066967719.262098793353721.9321033405818
7420.211125382192518.540515927930121.8817348364550
7520.114545499929618.15261401561322.0764769842462
7620.453840717289818.227153506946322.6805279276334
7720.234297678462217.760635300520722.7079600564037
7820.65023320086617.942287246481623.3581791552504
7920.407109819326517.474326092406723.3398935462464
8021.084235319789717.933848024264224.2346226153153
8121.685196407762018.322858274655525.0475345408684
8221.709532115899618.139722530194325.2793417016049
8321.879222271396318.105524397550225.6529201452425
8422.495310020910418.520606198399626.4700138434211


Parameters (Session):
par1 = 12 ; par2 = Triple ; par3 = additive ;
Parameters (R input):
par1 = 12 ; par2 = Triple ; par3 = additive ;
R code (references can be found in the software module):
par1 <- as.numeric(par1)
if (par2 == 'Single') K <- 1
if (par2 == 'Double') K <- 2
if (par2 == 'Triple') K <- par1
nx <- length(x)
nxmK <- nx - K
x <- ts(x, frequency = par1)
if (par2 == 'Single') fit <- HoltWinters(x, gamma=0, beta=0)
if (par2 == 'Double') fit <- HoltWinters(x, gamma=0)
if (par2 == 'Triple') fit <- HoltWinters(x, seasonal=par3)
fit
myresid <- x - fit$fitted[,'xhat']
bitmap(file='test1.png')
op <- par(mfrow=c(2,1))
plot(fit,ylab='Observed (black) / Fitted (red)',main='Interpolation Fit of Exponential Smoothing')
plot(myresid,ylab='Residuals',main='Interpolation Prediction Errors')
par(op)
dev.off()
bitmap(file='test2.png')
p <- predict(fit, par1, prediction.interval=TRUE)
np <- length(p[,1])
plot(fit,p,ylab='Observed (black) / Fitted (red)',main='Extrapolation Fit of Exponential Smoothing')
dev.off()
bitmap(file='test3.png')
op <- par(mfrow = c(2,2))
acf(as.numeric(myresid),lag.max = nx/2,main='Residual ACF')
spectrum(myresid,main='Residals Periodogram')
cpgram(myresid,main='Residal Cumulative Periodogram')
qqnorm(myresid,main='Residual Normal QQ Plot')
qqline(myresid)
par(op)
dev.off()
load(file='createtable')
a<-table.start()
a<-table.row.start(a)
a<-table.element(a,'Estimated Parameters of Exponential Smoothing',2,TRUE)
a<-table.row.end(a)
a<-table.row.start(a)
a<-table.element(a,'Parameter',header=TRUE)
a<-table.element(a,'Value',header=TRUE)
a<-table.row.end(a)
a<-table.row.start(a)
a<-table.element(a,'alpha',header=TRUE)
a<-table.element(a,fit$alpha)
a<-table.row.end(a)
a<-table.row.start(a)
a<-table.element(a,'beta',header=TRUE)
a<-table.element(a,fit$beta)
a<-table.row.end(a)
a<-table.row.start(a)
a<-table.element(a,'gamma',header=TRUE)
a<-table.element(a,fit$gamma)
a<-table.row.end(a)
a<-table.end(a)
table.save(a,file='mytable.tab')
a<-table.start()
a<-table.row.start(a)
a<-table.element(a,'Interpolation Forecasts of Exponential Smoothing',4,TRUE)
a<-table.row.end(a)
a<-table.row.start(a)
a<-table.element(a,'t',header=TRUE)
a<-table.element(a,'Observed',header=TRUE)
a<-table.element(a,'Fitted',header=TRUE)
a<-table.element(a,'Residuals',header=TRUE)
a<-table.row.end(a)
for (i in 1:nxmK) {
a<-table.row.start(a)
a<-table.element(a,i+K,header=TRUE)
a<-table.element(a,x[i+K])
a<-table.element(a,fit$fitted[i,'xhat'])
a<-table.element(a,myresid[i])
a<-table.row.end(a)
}
a<-table.end(a)
table.save(a,file='mytable1.tab')
a<-table.start()
a<-table.row.start(a)
a<-table.element(a,'Extrapolation Forecasts of Exponential Smoothing',4,TRUE)
a<-table.row.end(a)
a<-table.row.start(a)
a<-table.element(a,'t',header=TRUE)
a<-table.element(a,'Forecast',header=TRUE)
a<-table.element(a,'95% Lower Bound',header=TRUE)
a<-table.element(a,'95% Upper Bound',header=TRUE)
a<-table.row.end(a)
for (i in 1:np) {
a<-table.row.start(a)
a<-table.element(a,nx+i,header=TRUE)
a<-table.element(a,p[i,'fit'])
a<-table.element(a,p[i,'lwr'])
a<-table.element(a,p[i,'upr'])
a<-table.row.end(a)
}
a<-table.end(a)
table.save(a,file='mytable2.tab')