Free Statistics

of Irreproducible Research!

Author's title

Autocorrelation function-omzetcijfers droge voeding carrefour-Angelique Vig...

Author*Unverified author*
R Software Modulerwasp_autocorrelation.wasp
Title produced by software(Partial) Autocorrelation Function
Date of computationSat, 06 Jun 2009 04:43:22 -0600
Cite this page as followsStatistical Computations at FreeStatistics.org, Office for Research Development and Education, URL https://freestatistics.org/blog/index.php?v=date/2009/Jun/06/t12442850632lipre74emi11zz.htm/, Retrieved Sun, 28 Apr 2024 20:58:06 +0000
Statistical Computations at FreeStatistics.org, Office for Research Development and Education, URL https://freestatistics.org/blog/index.php?pk=41950, Retrieved Sun, 28 Apr 2024 20:58:06 +0000
QR Codes:

Original text written by user:
IsPrivate?No (this computation is public)
User-defined keywords
Estimated Impact148
Family? (F = Feedback message, R = changed R code, M = changed R Module, P = changed Parameters, D = changed Data)
-       [(Partial) Autocorrelation Function] [Autocorrelation f...] [2009-06-06 10:43:22] [5e28000efa8060aa7512f63d330b190a] [Current]
Feedback Forum

Post a new message
Dataseries X:
831581
808744
899237
929532
883165
908232
955613
937590
849396
978630
868513
1156102
1505713
1415151
1545021
1681193
1457973
1638575
1688972
1563924
1596359
1722061
1549332
2264959
1420268
1415099
1597279
1605693
1575400
1654752
1553966
1570959
1642414
1664774
1551560
2304365
1644081
1425600
1569344
1456489
1610786
1601519
1496600
1486452
1637939
1605759
1504221
1993384
1507620
1477037
1679184
1504731
1570141
1734191
1657498
1652164
1610941
1813765
1711573
2165466
1492778
1385488
1470589
1514657
1641395
1606185
1581162
1517847
1630080
1604623
1548973
2125558


Summary of computational transaction
Raw Inputview raw input (R code)
Raw Outputview raw output of R engine
Computing time2 seconds
R Server'Sir Ronald Aylmer Fisher' @ 193.190.124.24

\begin{tabular}{lllllllll}
\hline
Summary of computational transaction \tabularnewline
Raw Input & view raw input (R code)  \tabularnewline
Raw Output & view raw output of R engine  \tabularnewline
Computing time & 2 seconds \tabularnewline
R Server & 'Sir Ronald Aylmer Fisher' @ 193.190.124.24 \tabularnewline
\hline
\end{tabular}
%Source: https://freestatistics.org/blog/index.php?pk=41950&T=0

[TABLE]
[ROW][C]Summary of computational transaction[/C][/ROW]
[ROW][C]Raw Input[/C][C]view raw input (R code) [/C][/ROW]
[ROW][C]Raw Output[/C][C]view raw output of R engine [/C][/ROW]
[ROW][C]Computing time[/C][C]2 seconds[/C][/ROW]
[ROW][C]R Server[/C][C]'Sir Ronald Aylmer Fisher' @ 193.190.124.24[/C][/ROW]
[/TABLE]
Source: https://freestatistics.org/blog/index.php?pk=41950&T=0

Globally Unique Identifier (entire table): ba.freestatistics.org/blog/index.php?pk=41950&T=0

As an alternative you can also use a QR Code:  

The GUIDs for individual cells are displayed in the table below:

Summary of computational transaction
Raw Inputview raw input (R code)
Raw Outputview raw output of R engine
Computing time2 seconds
R Server'Sir Ronald Aylmer Fisher' @ 193.190.124.24


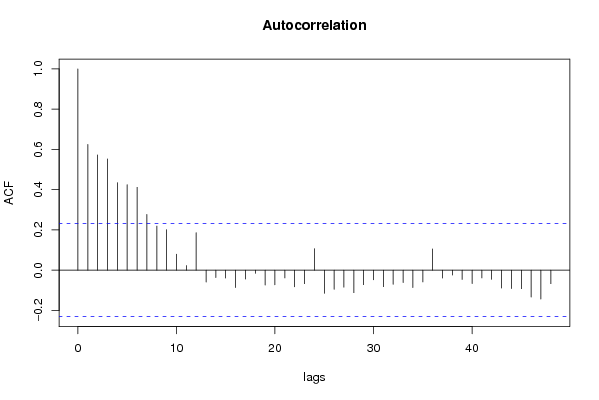
Autocorrelation Function
Time lag kACF(k)T-STATP-value
10.6247235.3011e-06
20.5723014.85613e-06
30.5530124.69256e-06
40.4344213.68620.000219
50.4247533.60410.000287
60.4116953.49330.00041
70.277042.35080.010739
80.2189021.85740.033669
90.2012961.7080.045968
100.078830.66890.25285
110.0228450.19390.423419
120.1865561.5830.058905
13-0.059106-0.50150.308763
14-0.036386-0.30870.379202
15-0.039241-0.3330.370062
16-0.085859-0.72850.234325
17-0.043849-0.37210.355467
18-0.015044-0.12770.44939
19-0.073385-0.62270.267728
20-0.072351-0.61390.270601
21-0.038494-0.32660.372445
22-0.082835-0.70290.2422
23-0.06709-0.56930.28547
240.1064420.90320.184717
25-0.115205-0.97750.165786
26-0.095357-0.80910.210553
27-0.084265-0.7150.238458
28-0.111754-0.94830.173084
29-0.07198-0.61080.271636
30-0.048136-0.40840.34208
31-0.081867-0.69470.244752
32-0.070451-0.59780.275925
33-0.06143-0.52120.301897
34-0.086498-0.7340.232678
35-0.058368-0.49530.31096
360.1057310.89720.186312
37-0.039178-0.33240.370264
38-0.024442-0.20740.418141
39-0.045902-0.38950.349033
40-0.066571-0.56490.286957
41-0.038499-0.32670.37243
42-0.044839-0.38050.352358
43-0.088672-0.75240.227129
44-0.091434-0.77580.22019
45-0.091961-0.78030.21888
46-0.133566-1.13330.130414
47-0.143815-1.22030.113165
48-0.06704-0.56890.285612

\begin{tabular}{lllllllll}
\hline
Autocorrelation Function \tabularnewline
Time lag k & ACF(k) & T-STAT & P-value \tabularnewline
1 & 0.624723 & 5.301 & 1e-06 \tabularnewline
2 & 0.572301 & 4.8561 & 3e-06 \tabularnewline
3 & 0.553012 & 4.6925 & 6e-06 \tabularnewline
4 & 0.434421 & 3.6862 & 0.000219 \tabularnewline
5 & 0.424753 & 3.6041 & 0.000287 \tabularnewline
6 & 0.411695 & 3.4933 & 0.00041 \tabularnewline
7 & 0.27704 & 2.3508 & 0.010739 \tabularnewline
8 & 0.218902 & 1.8574 & 0.033669 \tabularnewline
9 & 0.201296 & 1.708 & 0.045968 \tabularnewline
10 & 0.07883 & 0.6689 & 0.25285 \tabularnewline
11 & 0.022845 & 0.1939 & 0.423419 \tabularnewline
12 & 0.186556 & 1.583 & 0.058905 \tabularnewline
13 & -0.059106 & -0.5015 & 0.308763 \tabularnewline
14 & -0.036386 & -0.3087 & 0.379202 \tabularnewline
15 & -0.039241 & -0.333 & 0.370062 \tabularnewline
16 & -0.085859 & -0.7285 & 0.234325 \tabularnewline
17 & -0.043849 & -0.3721 & 0.355467 \tabularnewline
18 & -0.015044 & -0.1277 & 0.44939 \tabularnewline
19 & -0.073385 & -0.6227 & 0.267728 \tabularnewline
20 & -0.072351 & -0.6139 & 0.270601 \tabularnewline
21 & -0.038494 & -0.3266 & 0.372445 \tabularnewline
22 & -0.082835 & -0.7029 & 0.2422 \tabularnewline
23 & -0.06709 & -0.5693 & 0.28547 \tabularnewline
24 & 0.106442 & 0.9032 & 0.184717 \tabularnewline
25 & -0.115205 & -0.9775 & 0.165786 \tabularnewline
26 & -0.095357 & -0.8091 & 0.210553 \tabularnewline
27 & -0.084265 & -0.715 & 0.238458 \tabularnewline
28 & -0.111754 & -0.9483 & 0.173084 \tabularnewline
29 & -0.07198 & -0.6108 & 0.271636 \tabularnewline
30 & -0.048136 & -0.4084 & 0.34208 \tabularnewline
31 & -0.081867 & -0.6947 & 0.244752 \tabularnewline
32 & -0.070451 & -0.5978 & 0.275925 \tabularnewline
33 & -0.06143 & -0.5212 & 0.301897 \tabularnewline
34 & -0.086498 & -0.734 & 0.232678 \tabularnewline
35 & -0.058368 & -0.4953 & 0.31096 \tabularnewline
36 & 0.105731 & 0.8972 & 0.186312 \tabularnewline
37 & -0.039178 & -0.3324 & 0.370264 \tabularnewline
38 & -0.024442 & -0.2074 & 0.418141 \tabularnewline
39 & -0.045902 & -0.3895 & 0.349033 \tabularnewline
40 & -0.066571 & -0.5649 & 0.286957 \tabularnewline
41 & -0.038499 & -0.3267 & 0.37243 \tabularnewline
42 & -0.044839 & -0.3805 & 0.352358 \tabularnewline
43 & -0.088672 & -0.7524 & 0.227129 \tabularnewline
44 & -0.091434 & -0.7758 & 0.22019 \tabularnewline
45 & -0.091961 & -0.7803 & 0.21888 \tabularnewline
46 & -0.133566 & -1.1333 & 0.130414 \tabularnewline
47 & -0.143815 & -1.2203 & 0.113165 \tabularnewline
48 & -0.06704 & -0.5689 & 0.285612 \tabularnewline
\hline
\end{tabular}
%Source: https://freestatistics.org/blog/index.php?pk=41950&T=1

[TABLE]
[ROW][C]Autocorrelation Function[/C][/ROW]
[ROW][C]Time lag k[/C][C]ACF(k)[/C][C]T-STAT[/C][C]P-value[/C][/ROW]
[ROW][C]1[/C][C]0.624723[/C][C]5.301[/C][C]1e-06[/C][/ROW]
[ROW][C]2[/C][C]0.572301[/C][C]4.8561[/C][C]3e-06[/C][/ROW]
[ROW][C]3[/C][C]0.553012[/C][C]4.6925[/C][C]6e-06[/C][/ROW]
[ROW][C]4[/C][C]0.434421[/C][C]3.6862[/C][C]0.000219[/C][/ROW]
[ROW][C]5[/C][C]0.424753[/C][C]3.6041[/C][C]0.000287[/C][/ROW]
[ROW][C]6[/C][C]0.411695[/C][C]3.4933[/C][C]0.00041[/C][/ROW]
[ROW][C]7[/C][C]0.27704[/C][C]2.3508[/C][C]0.010739[/C][/ROW]
[ROW][C]8[/C][C]0.218902[/C][C]1.8574[/C][C]0.033669[/C][/ROW]
[ROW][C]9[/C][C]0.201296[/C][C]1.708[/C][C]0.045968[/C][/ROW]
[ROW][C]10[/C][C]0.07883[/C][C]0.6689[/C][C]0.25285[/C][/ROW]
[ROW][C]11[/C][C]0.022845[/C][C]0.1939[/C][C]0.423419[/C][/ROW]
[ROW][C]12[/C][C]0.186556[/C][C]1.583[/C][C]0.058905[/C][/ROW]
[ROW][C]13[/C][C]-0.059106[/C][C]-0.5015[/C][C]0.308763[/C][/ROW]
[ROW][C]14[/C][C]-0.036386[/C][C]-0.3087[/C][C]0.379202[/C][/ROW]
[ROW][C]15[/C][C]-0.039241[/C][C]-0.333[/C][C]0.370062[/C][/ROW]
[ROW][C]16[/C][C]-0.085859[/C][C]-0.7285[/C][C]0.234325[/C][/ROW]
[ROW][C]17[/C][C]-0.043849[/C][C]-0.3721[/C][C]0.355467[/C][/ROW]
[ROW][C]18[/C][C]-0.015044[/C][C]-0.1277[/C][C]0.44939[/C][/ROW]
[ROW][C]19[/C][C]-0.073385[/C][C]-0.6227[/C][C]0.267728[/C][/ROW]
[ROW][C]20[/C][C]-0.072351[/C][C]-0.6139[/C][C]0.270601[/C][/ROW]
[ROW][C]21[/C][C]-0.038494[/C][C]-0.3266[/C][C]0.372445[/C][/ROW]
[ROW][C]22[/C][C]-0.082835[/C][C]-0.7029[/C][C]0.2422[/C][/ROW]
[ROW][C]23[/C][C]-0.06709[/C][C]-0.5693[/C][C]0.28547[/C][/ROW]
[ROW][C]24[/C][C]0.106442[/C][C]0.9032[/C][C]0.184717[/C][/ROW]
[ROW][C]25[/C][C]-0.115205[/C][C]-0.9775[/C][C]0.165786[/C][/ROW]
[ROW][C]26[/C][C]-0.095357[/C][C]-0.8091[/C][C]0.210553[/C][/ROW]
[ROW][C]27[/C][C]-0.084265[/C][C]-0.715[/C][C]0.238458[/C][/ROW]
[ROW][C]28[/C][C]-0.111754[/C][C]-0.9483[/C][C]0.173084[/C][/ROW]
[ROW][C]29[/C][C]-0.07198[/C][C]-0.6108[/C][C]0.271636[/C][/ROW]
[ROW][C]30[/C][C]-0.048136[/C][C]-0.4084[/C][C]0.34208[/C][/ROW]
[ROW][C]31[/C][C]-0.081867[/C][C]-0.6947[/C][C]0.244752[/C][/ROW]
[ROW][C]32[/C][C]-0.070451[/C][C]-0.5978[/C][C]0.275925[/C][/ROW]
[ROW][C]33[/C][C]-0.06143[/C][C]-0.5212[/C][C]0.301897[/C][/ROW]
[ROW][C]34[/C][C]-0.086498[/C][C]-0.734[/C][C]0.232678[/C][/ROW]
[ROW][C]35[/C][C]-0.058368[/C][C]-0.4953[/C][C]0.31096[/C][/ROW]
[ROW][C]36[/C][C]0.105731[/C][C]0.8972[/C][C]0.186312[/C][/ROW]
[ROW][C]37[/C][C]-0.039178[/C][C]-0.3324[/C][C]0.370264[/C][/ROW]
[ROW][C]38[/C][C]-0.024442[/C][C]-0.2074[/C][C]0.418141[/C][/ROW]
[ROW][C]39[/C][C]-0.045902[/C][C]-0.3895[/C][C]0.349033[/C][/ROW]
[ROW][C]40[/C][C]-0.066571[/C][C]-0.5649[/C][C]0.286957[/C][/ROW]
[ROW][C]41[/C][C]-0.038499[/C][C]-0.3267[/C][C]0.37243[/C][/ROW]
[ROW][C]42[/C][C]-0.044839[/C][C]-0.3805[/C][C]0.352358[/C][/ROW]
[ROW][C]43[/C][C]-0.088672[/C][C]-0.7524[/C][C]0.227129[/C][/ROW]
[ROW][C]44[/C][C]-0.091434[/C][C]-0.7758[/C][C]0.22019[/C][/ROW]
[ROW][C]45[/C][C]-0.091961[/C][C]-0.7803[/C][C]0.21888[/C][/ROW]
[ROW][C]46[/C][C]-0.133566[/C][C]-1.1333[/C][C]0.130414[/C][/ROW]
[ROW][C]47[/C][C]-0.143815[/C][C]-1.2203[/C][C]0.113165[/C][/ROW]
[ROW][C]48[/C][C]-0.06704[/C][C]-0.5689[/C][C]0.285612[/C][/ROW]
[/TABLE]
Source: https://freestatistics.org/blog/index.php?pk=41950&T=1

Globally Unique Identifier (entire table): ba.freestatistics.org/blog/index.php?pk=41950&T=1

As an alternative you can also use a QR Code:  

The GUIDs for individual cells are displayed in the table below:

Autocorrelation Function
Time lag kACF(k)T-STATP-value
10.6247235.3011e-06
20.5723014.85613e-06
30.5530124.69256e-06
40.4344213.68620.000219
50.4247533.60410.000287
60.4116953.49330.00041
70.277042.35080.010739
80.2189021.85740.033669
90.2012961.7080.045968
100.078830.66890.25285
110.0228450.19390.423419
120.1865561.5830.058905
13-0.059106-0.50150.308763
14-0.036386-0.30870.379202
15-0.039241-0.3330.370062
16-0.085859-0.72850.234325
17-0.043849-0.37210.355467
18-0.015044-0.12770.44939
19-0.073385-0.62270.267728
20-0.072351-0.61390.270601
21-0.038494-0.32660.372445
22-0.082835-0.70290.2422
23-0.06709-0.56930.28547
240.1064420.90320.184717
25-0.115205-0.97750.165786
26-0.095357-0.80910.210553
27-0.084265-0.7150.238458
28-0.111754-0.94830.173084
29-0.07198-0.61080.271636
30-0.048136-0.40840.34208
31-0.081867-0.69470.244752
32-0.070451-0.59780.275925
33-0.06143-0.52120.301897
34-0.086498-0.7340.232678
35-0.058368-0.49530.31096
360.1057310.89720.186312
37-0.039178-0.33240.370264
38-0.024442-0.20740.418141
39-0.045902-0.38950.349033
40-0.066571-0.56490.286957
41-0.038499-0.32670.37243
42-0.044839-0.38050.352358
43-0.088672-0.75240.227129
44-0.091434-0.77580.22019
45-0.091961-0.78030.21888
46-0.133566-1.13330.130414
47-0.143815-1.22030.113165
48-0.06704-0.56890.285612


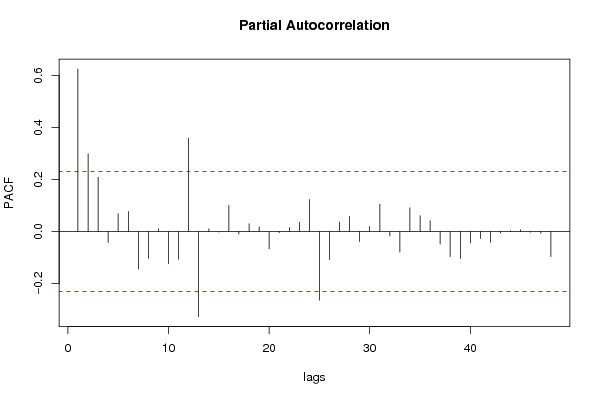
Partial Autocorrelation Function
Time lag kPACF(k)T-STATP-value
10.6247235.3011e-06
20.2985332.53310.006742
30.2083551.76790.040653
4-0.041944-0.35590.361475
50.0681340.57810.282488
60.076760.65130.258452
7-0.143942-1.22140.112961
8-0.103236-0.8760.191975
90.0111280.09440.462517
10-0.123929-1.05160.148256
11-0.106847-0.90660.183814
120.3583773.04090.001644
13-0.326897-2.77380.003526
140.0107230.0910.463879
15-0.002154-0.01830.492736
160.1004060.8520.198526
17-0.009534-0.08090.467875
180.0298540.25330.400372
190.0181930.15440.438873
20-0.066235-0.5620.287922
21-0.004593-0.0390.48451
220.0146240.12410.450795
230.0354140.30050.382331
240.1228031.0420.150446
25-0.263555-2.23630.014214
26-0.107601-0.9130.182138
270.036640.31090.378389
280.057960.49180.312177
29-0.038491-0.32660.372455
300.0198720.16860.433285
310.1050850.89170.187768
32-0.017029-0.14450.442756
33-0.078393-0.66520.254029
340.0911840.77370.220814
350.0606340.51450.304241
360.0415980.3530.36257
37-0.048158-0.40860.342012
38-0.095638-0.81150.209871
39-0.103812-0.88090.190659
40-0.043699-0.37080.355939
41-0.026599-0.22570.411038
42-0.040686-0.34520.365464
43-0.005287-0.04490.482171
440.0027710.02350.490654
450.0071210.06040.475991
46-0.002318-0.01970.49218
47-0.006553-0.05560.477906
48-0.096037-0.81490.208907

\begin{tabular}{lllllllll}
\hline
Partial Autocorrelation Function \tabularnewline
Time lag k & PACF(k) & T-STAT & P-value \tabularnewline
1 & 0.624723 & 5.301 & 1e-06 \tabularnewline
2 & 0.298533 & 2.5331 & 0.006742 \tabularnewline
3 & 0.208355 & 1.7679 & 0.040653 \tabularnewline
4 & -0.041944 & -0.3559 & 0.361475 \tabularnewline
5 & 0.068134 & 0.5781 & 0.282488 \tabularnewline
6 & 0.07676 & 0.6513 & 0.258452 \tabularnewline
7 & -0.143942 & -1.2214 & 0.112961 \tabularnewline
8 & -0.103236 & -0.876 & 0.191975 \tabularnewline
9 & 0.011128 & 0.0944 & 0.462517 \tabularnewline
10 & -0.123929 & -1.0516 & 0.148256 \tabularnewline
11 & -0.106847 & -0.9066 & 0.183814 \tabularnewline
12 & 0.358377 & 3.0409 & 0.001644 \tabularnewline
13 & -0.326897 & -2.7738 & 0.003526 \tabularnewline
14 & 0.010723 & 0.091 & 0.463879 \tabularnewline
15 & -0.002154 & -0.0183 & 0.492736 \tabularnewline
16 & 0.100406 & 0.852 & 0.198526 \tabularnewline
17 & -0.009534 & -0.0809 & 0.467875 \tabularnewline
18 & 0.029854 & 0.2533 & 0.400372 \tabularnewline
19 & 0.018193 & 0.1544 & 0.438873 \tabularnewline
20 & -0.066235 & -0.562 & 0.287922 \tabularnewline
21 & -0.004593 & -0.039 & 0.48451 \tabularnewline
22 & 0.014624 & 0.1241 & 0.450795 \tabularnewline
23 & 0.035414 & 0.3005 & 0.382331 \tabularnewline
24 & 0.122803 & 1.042 & 0.150446 \tabularnewline
25 & -0.263555 & -2.2363 & 0.014214 \tabularnewline
26 & -0.107601 & -0.913 & 0.182138 \tabularnewline
27 & 0.03664 & 0.3109 & 0.378389 \tabularnewline
28 & 0.05796 & 0.4918 & 0.312177 \tabularnewline
29 & -0.038491 & -0.3266 & 0.372455 \tabularnewline
30 & 0.019872 & 0.1686 & 0.433285 \tabularnewline
31 & 0.105085 & 0.8917 & 0.187768 \tabularnewline
32 & -0.017029 & -0.1445 & 0.442756 \tabularnewline
33 & -0.078393 & -0.6652 & 0.254029 \tabularnewline
34 & 0.091184 & 0.7737 & 0.220814 \tabularnewline
35 & 0.060634 & 0.5145 & 0.304241 \tabularnewline
36 & 0.041598 & 0.353 & 0.36257 \tabularnewline
37 & -0.048158 & -0.4086 & 0.342012 \tabularnewline
38 & -0.095638 & -0.8115 & 0.209871 \tabularnewline
39 & -0.103812 & -0.8809 & 0.190659 \tabularnewline
40 & -0.043699 & -0.3708 & 0.355939 \tabularnewline
41 & -0.026599 & -0.2257 & 0.411038 \tabularnewline
42 & -0.040686 & -0.3452 & 0.365464 \tabularnewline
43 & -0.005287 & -0.0449 & 0.482171 \tabularnewline
44 & 0.002771 & 0.0235 & 0.490654 \tabularnewline
45 & 0.007121 & 0.0604 & 0.475991 \tabularnewline
46 & -0.002318 & -0.0197 & 0.49218 \tabularnewline
47 & -0.006553 & -0.0556 & 0.477906 \tabularnewline
48 & -0.096037 & -0.8149 & 0.208907 \tabularnewline
\hline
\end{tabular}
%Source: https://freestatistics.org/blog/index.php?pk=41950&T=2

[TABLE]
[ROW][C]Partial Autocorrelation Function[/C][/ROW]
[ROW][C]Time lag k[/C][C]PACF(k)[/C][C]T-STAT[/C][C]P-value[/C][/ROW]
[ROW][C]1[/C][C]0.624723[/C][C]5.301[/C][C]1e-06[/C][/ROW]
[ROW][C]2[/C][C]0.298533[/C][C]2.5331[/C][C]0.006742[/C][/ROW]
[ROW][C]3[/C][C]0.208355[/C][C]1.7679[/C][C]0.040653[/C][/ROW]
[ROW][C]4[/C][C]-0.041944[/C][C]-0.3559[/C][C]0.361475[/C][/ROW]
[ROW][C]5[/C][C]0.068134[/C][C]0.5781[/C][C]0.282488[/C][/ROW]
[ROW][C]6[/C][C]0.07676[/C][C]0.6513[/C][C]0.258452[/C][/ROW]
[ROW][C]7[/C][C]-0.143942[/C][C]-1.2214[/C][C]0.112961[/C][/ROW]
[ROW][C]8[/C][C]-0.103236[/C][C]-0.876[/C][C]0.191975[/C][/ROW]
[ROW][C]9[/C][C]0.011128[/C][C]0.0944[/C][C]0.462517[/C][/ROW]
[ROW][C]10[/C][C]-0.123929[/C][C]-1.0516[/C][C]0.148256[/C][/ROW]
[ROW][C]11[/C][C]-0.106847[/C][C]-0.9066[/C][C]0.183814[/C][/ROW]
[ROW][C]12[/C][C]0.358377[/C][C]3.0409[/C][C]0.001644[/C][/ROW]
[ROW][C]13[/C][C]-0.326897[/C][C]-2.7738[/C][C]0.003526[/C][/ROW]
[ROW][C]14[/C][C]0.010723[/C][C]0.091[/C][C]0.463879[/C][/ROW]
[ROW][C]15[/C][C]-0.002154[/C][C]-0.0183[/C][C]0.492736[/C][/ROW]
[ROW][C]16[/C][C]0.100406[/C][C]0.852[/C][C]0.198526[/C][/ROW]
[ROW][C]17[/C][C]-0.009534[/C][C]-0.0809[/C][C]0.467875[/C][/ROW]
[ROW][C]18[/C][C]0.029854[/C][C]0.2533[/C][C]0.400372[/C][/ROW]
[ROW][C]19[/C][C]0.018193[/C][C]0.1544[/C][C]0.438873[/C][/ROW]
[ROW][C]20[/C][C]-0.066235[/C][C]-0.562[/C][C]0.287922[/C][/ROW]
[ROW][C]21[/C][C]-0.004593[/C][C]-0.039[/C][C]0.48451[/C][/ROW]
[ROW][C]22[/C][C]0.014624[/C][C]0.1241[/C][C]0.450795[/C][/ROW]
[ROW][C]23[/C][C]0.035414[/C][C]0.3005[/C][C]0.382331[/C][/ROW]
[ROW][C]24[/C][C]0.122803[/C][C]1.042[/C][C]0.150446[/C][/ROW]
[ROW][C]25[/C][C]-0.263555[/C][C]-2.2363[/C][C]0.014214[/C][/ROW]
[ROW][C]26[/C][C]-0.107601[/C][C]-0.913[/C][C]0.182138[/C][/ROW]
[ROW][C]27[/C][C]0.03664[/C][C]0.3109[/C][C]0.378389[/C][/ROW]
[ROW][C]28[/C][C]0.05796[/C][C]0.4918[/C][C]0.312177[/C][/ROW]
[ROW][C]29[/C][C]-0.038491[/C][C]-0.3266[/C][C]0.372455[/C][/ROW]
[ROW][C]30[/C][C]0.019872[/C][C]0.1686[/C][C]0.433285[/C][/ROW]
[ROW][C]31[/C][C]0.105085[/C][C]0.8917[/C][C]0.187768[/C][/ROW]
[ROW][C]32[/C][C]-0.017029[/C][C]-0.1445[/C][C]0.442756[/C][/ROW]
[ROW][C]33[/C][C]-0.078393[/C][C]-0.6652[/C][C]0.254029[/C][/ROW]
[ROW][C]34[/C][C]0.091184[/C][C]0.7737[/C][C]0.220814[/C][/ROW]
[ROW][C]35[/C][C]0.060634[/C][C]0.5145[/C][C]0.304241[/C][/ROW]
[ROW][C]36[/C][C]0.041598[/C][C]0.353[/C][C]0.36257[/C][/ROW]
[ROW][C]37[/C][C]-0.048158[/C][C]-0.4086[/C][C]0.342012[/C][/ROW]
[ROW][C]38[/C][C]-0.095638[/C][C]-0.8115[/C][C]0.209871[/C][/ROW]
[ROW][C]39[/C][C]-0.103812[/C][C]-0.8809[/C][C]0.190659[/C][/ROW]
[ROW][C]40[/C][C]-0.043699[/C][C]-0.3708[/C][C]0.355939[/C][/ROW]
[ROW][C]41[/C][C]-0.026599[/C][C]-0.2257[/C][C]0.411038[/C][/ROW]
[ROW][C]42[/C][C]-0.040686[/C][C]-0.3452[/C][C]0.365464[/C][/ROW]
[ROW][C]43[/C][C]-0.005287[/C][C]-0.0449[/C][C]0.482171[/C][/ROW]
[ROW][C]44[/C][C]0.002771[/C][C]0.0235[/C][C]0.490654[/C][/ROW]
[ROW][C]45[/C][C]0.007121[/C][C]0.0604[/C][C]0.475991[/C][/ROW]
[ROW][C]46[/C][C]-0.002318[/C][C]-0.0197[/C][C]0.49218[/C][/ROW]
[ROW][C]47[/C][C]-0.006553[/C][C]-0.0556[/C][C]0.477906[/C][/ROW]
[ROW][C]48[/C][C]-0.096037[/C][C]-0.8149[/C][C]0.208907[/C][/ROW]
[/TABLE]
Source: https://freestatistics.org/blog/index.php?pk=41950&T=2

Globally Unique Identifier (entire table): ba.freestatistics.org/blog/index.php?pk=41950&T=2

As an alternative you can also use a QR Code:  

The GUIDs for individual cells are displayed in the table below:

Partial Autocorrelation Function
Time lag kPACF(k)T-STATP-value
10.6247235.3011e-06
20.2985332.53310.006742
30.2083551.76790.040653
4-0.041944-0.35590.361475
50.0681340.57810.282488
60.076760.65130.258452
7-0.143942-1.22140.112961
8-0.103236-0.8760.191975
90.0111280.09440.462517
10-0.123929-1.05160.148256
11-0.106847-0.90660.183814
120.3583773.04090.001644
13-0.326897-2.77380.003526
140.0107230.0910.463879
15-0.002154-0.01830.492736
160.1004060.8520.198526
17-0.009534-0.08090.467875
180.0298540.25330.400372
190.0181930.15440.438873
20-0.066235-0.5620.287922
21-0.004593-0.0390.48451
220.0146240.12410.450795
230.0354140.30050.382331
240.1228031.0420.150446
25-0.263555-2.23630.014214
26-0.107601-0.9130.182138
270.036640.31090.378389
280.057960.49180.312177
29-0.038491-0.32660.372455
300.0198720.16860.433285
310.1050850.89170.187768
32-0.017029-0.14450.442756
33-0.078393-0.66520.254029
340.0911840.77370.220814
350.0606340.51450.304241
360.0415980.3530.36257
37-0.048158-0.40860.342012
38-0.095638-0.81150.209871
39-0.103812-0.88090.190659
40-0.043699-0.37080.355939
41-0.026599-0.22570.411038
42-0.040686-0.34520.365464
43-0.005287-0.04490.482171
440.0027710.02350.490654
450.0071210.06040.475991
46-0.002318-0.01970.49218
47-0.006553-0.05560.477906
48-0.096037-0.81490.208907


Parameters (Session):
par1 = 48 ; par2 = 1 ; par3 = 0 ; par4 = 0 ; par5 = 12 ;
Parameters (R input):
par1 = 48 ; par2 = 1 ; par3 = 0 ; par4 = 0 ; par5 = 12 ;
R code (references can be found in the software module):
if (par1 == 'Default') {
par1 = 10*log10(length(x))
} else {
par1 <- as.numeric(par1)
}
par2 <- as.numeric(par2)
par3 <- as.numeric(par3)
par4 <- as.numeric(par4)
par5 <- as.numeric(par5)
if (par2 == 0) {
x <- log(x)
} else {
x <- (x ^ par2 - 1) / par2
}
if (par3 > 0) x <- diff(x,lag=1,difference=par3)
if (par4 > 0) x <- diff(x,lag=par5,difference=par4)
bitmap(file='pic1.png')
racf <- acf(x,par1,main='Autocorrelation',xlab='lags',ylab='ACF')
dev.off()
bitmap(file='pic2.png')
rpacf <- pacf(x,par1,main='Partial Autocorrelation',xlab='lags',ylab='PACF')
dev.off()
(myacf <- c(racf$acf))
(mypacf <- c(rpacf$acf))
lengthx <- length(x)
sqrtn <- sqrt(lengthx)
load(file='createtable')
a<-table.start()
a<-table.row.start(a)
a<-table.element(a,'Autocorrelation Function',4,TRUE)
a<-table.row.end(a)
a<-table.row.start(a)
a<-table.element(a,'Time lag k',header=TRUE)
a<-table.element(a,hyperlink('basics.htm','ACF(k)','click here for more information about the Autocorrelation Function'),header=TRUE)
a<-table.element(a,'T-STAT',header=TRUE)
a<-table.element(a,'P-value',header=TRUE)
a<-table.row.end(a)
for (i in 2:(par1+1)) {
a<-table.row.start(a)
a<-table.element(a,i-1,header=TRUE)
a<-table.element(a,round(myacf[i],6))
mytstat <- myacf[i]*sqrtn
a<-table.element(a,round(mytstat,4))
a<-table.element(a,round(1-pt(abs(mytstat),lengthx),6))
a<-table.row.end(a)
}
a<-table.end(a)
table.save(a,file='mytable.tab')
a<-table.start()
a<-table.row.start(a)
a<-table.element(a,'Partial Autocorrelation Function',4,TRUE)
a<-table.row.end(a)
a<-table.row.start(a)
a<-table.element(a,'Time lag k',header=TRUE)
a<-table.element(a,hyperlink('basics.htm','PACF(k)','click here for more information about the Partial Autocorrelation Function'),header=TRUE)
a<-table.element(a,'T-STAT',header=TRUE)
a<-table.element(a,'P-value',header=TRUE)
a<-table.row.end(a)
for (i in 1:par1) {
a<-table.row.start(a)
a<-table.element(a,i,header=TRUE)
a<-table.element(a,round(mypacf[i],6))
mytstat <- mypacf[i]*sqrtn
a<-table.element(a,round(mytstat,4))
a<-table.element(a,round(1-pt(abs(mytstat),lengthx),6))
a<-table.row.end(a)
}
a<-table.end(a)
table.save(a,file='mytable1.tab')