Free Statistics

of Irreproducible Research!

Author's title

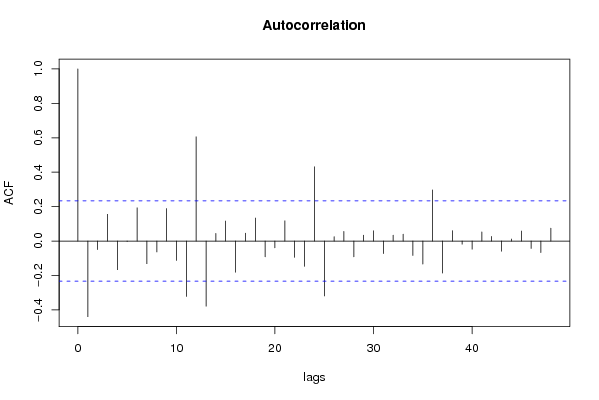
Autocorrelation Function-Degree of non-seasonal differencing-omzetcijfers d...

Author*Unverified author*
R Software Modulerwasp_autocorrelation.wasp
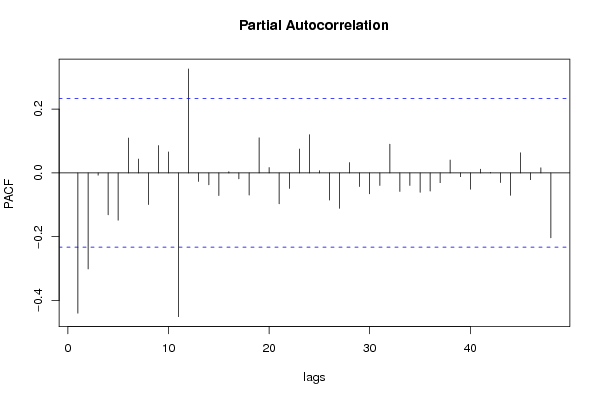
Title produced by software(Partial) Autocorrelation Function
Date of computationSat, 06 Jun 2009 03:06:59 -0600
Cite this page as followsStatistical Computations at FreeStatistics.org, Office for Research Development and Education, URL https://freestatistics.org/blog/index.php?v=date/2009/Jun/06/t12442792912nag8jsfaxb1gzk.htm/, Retrieved Sun, 28 Apr 2024 23:51:33 +0000
Statistical Computations at FreeStatistics.org, Office for Research Development and Education, URL https://freestatistics.org/blog/index.php?pk=41935, Retrieved Sun, 28 Apr 2024 23:51:33 +0000
QR Codes:

Original text written by user:
IsPrivate?No (this computation is public)
User-defined keywords
Estimated Impact160
Family? (F = Feedback message, R = changed R code, M = changed R Module, P = changed Parameters, D = changed Data)
-       [(Partial) Autocorrelation Function] [Autocorrelation F...] [2009-06-06 09:06:59] [5e28000efa8060aa7512f63d330b190a] [Current]
Feedback Forum

Post a new message
Dataseries X:
831581
808744
899237
929532
883165
908232
955613
937590
849396
978630
868513
1156102
1505713
1415151
1545021
1681193
1457973
1638575
1688972
1563924
1596359
1722061
1549332
2264959
1420268
1415099
1597279
1605693
1575400
1654752
1553966
1570959
1642414
1664774
1551560
2304365
1644081
1425600
1569344
1456489
1610786
1601519
1496600
1486452
1637939
1605759
1504221
1993384
1507620
1477037
1679184
1504731
1570141
1734191
1657498
1652164
1610941
1813765
1711573
2165466
1492778
1385488
1470589
1514657
1641395
1606185
1581162
1517847
1630080
1604623
1548973
2125558


Summary of computational transaction
Raw Inputview raw input (R code)
Raw Outputview raw output of R engine
Computing time1 seconds
R Server'George Udny Yule' @ 72.249.76.132

\begin{tabular}{lllllllll}
\hline
Summary of computational transaction \tabularnewline
Raw Input & view raw input (R code)  \tabularnewline
Raw Output & view raw output of R engine  \tabularnewline
Computing time & 1 seconds \tabularnewline
R Server & 'George Udny Yule' @ 72.249.76.132 \tabularnewline
\hline
\end{tabular}
%Source: https://freestatistics.org/blog/index.php?pk=41935&T=0

[TABLE]
[ROW][C]Summary of computational transaction[/C][/ROW]
[ROW][C]Raw Input[/C][C]view raw input (R code) [/C][/ROW]
[ROW][C]Raw Output[/C][C]view raw output of R engine [/C][/ROW]
[ROW][C]Computing time[/C][C]1 seconds[/C][/ROW]
[ROW][C]R Server[/C][C]'George Udny Yule' @ 72.249.76.132[/C][/ROW]
[/TABLE]
Source: https://freestatistics.org/blog/index.php?pk=41935&T=0

Globally Unique Identifier (entire table): ba.freestatistics.org/blog/index.php?pk=41935&T=0

As an alternative you can also use a QR Code:  

The GUIDs for individual cells are displayed in the table below:

Summary of computational transaction
Raw Inputview raw input (R code)
Raw Outputview raw output of R engine
Computing time1 seconds
R Server'George Udny Yule' @ 72.249.76.132


Autocorrelation Function
Time lag kACF(k)T-STATP-value
1-0.439557-3.70380.000208
2-0.049638-0.41830.338511
30.1553271.30880.09741
4-0.167-1.40720.08187
5-0.00258-0.02170.491358
60.1932151.62810.053971
7-0.131998-1.11220.134894
8-0.063278-0.53320.297783
90.1886081.58920.058225
10-0.112842-0.95080.172461
11-0.322257-2.71540.004153
120.6053535.10081e-06
13-0.379045-3.19390.001047
140.0437440.36860.356764
150.1162220.97930.165378
16-0.180968-1.52490.065867
170.0455910.38420.351004
180.1336051.12580.132026
19-0.091677-0.77250.221196
20-0.039407-0.33210.370414
210.1174140.98930.162926
22-0.094583-0.7970.214063
23-0.146951-1.23820.109854
240.4311123.63260.000263
25-0.319072-2.68860.004468
260.025090.21140.416587
270.05590.4710.319534
28-0.092143-0.77640.220042
290.0341120.28740.387309
300.0596790.50290.308307
31-0.072689-0.61250.271086
320.0337390.28430.388509
330.0399580.33670.36867
34-0.083467-0.70330.242083
35-0.133679-1.12640.131894
360.2969242.50190.007329
37-0.186138-1.56840.060614
380.0600680.50610.307164
39-0.018487-0.15580.438327
40-0.047447-0.39980.345255
410.052660.44370.329296
420.0264980.22330.411982
43-0.059275-0.49950.3095
440.011670.09830.460971
450.058220.49060.312622
46-0.042934-0.36180.3593
47-0.067362-0.56760.286048
480.0744350.62720.26627

\begin{tabular}{lllllllll}
\hline
Autocorrelation Function \tabularnewline
Time lag k & ACF(k) & T-STAT & P-value \tabularnewline
1 & -0.439557 & -3.7038 & 0.000208 \tabularnewline
2 & -0.049638 & -0.4183 & 0.338511 \tabularnewline
3 & 0.155327 & 1.3088 & 0.09741 \tabularnewline
4 & -0.167 & -1.4072 & 0.08187 \tabularnewline
5 & -0.00258 & -0.0217 & 0.491358 \tabularnewline
6 & 0.193215 & 1.6281 & 0.053971 \tabularnewline
7 & -0.131998 & -1.1122 & 0.134894 \tabularnewline
8 & -0.063278 & -0.5332 & 0.297783 \tabularnewline
9 & 0.188608 & 1.5892 & 0.058225 \tabularnewline
10 & -0.112842 & -0.9508 & 0.172461 \tabularnewline
11 & -0.322257 & -2.7154 & 0.004153 \tabularnewline
12 & 0.605353 & 5.1008 & 1e-06 \tabularnewline
13 & -0.379045 & -3.1939 & 0.001047 \tabularnewline
14 & 0.043744 & 0.3686 & 0.356764 \tabularnewline
15 & 0.116222 & 0.9793 & 0.165378 \tabularnewline
16 & -0.180968 & -1.5249 & 0.065867 \tabularnewline
17 & 0.045591 & 0.3842 & 0.351004 \tabularnewline
18 & 0.133605 & 1.1258 & 0.132026 \tabularnewline
19 & -0.091677 & -0.7725 & 0.221196 \tabularnewline
20 & -0.039407 & -0.3321 & 0.370414 \tabularnewline
21 & 0.117414 & 0.9893 & 0.162926 \tabularnewline
22 & -0.094583 & -0.797 & 0.214063 \tabularnewline
23 & -0.146951 & -1.2382 & 0.109854 \tabularnewline
24 & 0.431112 & 3.6326 & 0.000263 \tabularnewline
25 & -0.319072 & -2.6886 & 0.004468 \tabularnewline
26 & 0.02509 & 0.2114 & 0.416587 \tabularnewline
27 & 0.0559 & 0.471 & 0.319534 \tabularnewline
28 & -0.092143 & -0.7764 & 0.220042 \tabularnewline
29 & 0.034112 & 0.2874 & 0.387309 \tabularnewline
30 & 0.059679 & 0.5029 & 0.308307 \tabularnewline
31 & -0.072689 & -0.6125 & 0.271086 \tabularnewline
32 & 0.033739 & 0.2843 & 0.388509 \tabularnewline
33 & 0.039958 & 0.3367 & 0.36867 \tabularnewline
34 & -0.083467 & -0.7033 & 0.242083 \tabularnewline
35 & -0.133679 & -1.1264 & 0.131894 \tabularnewline
36 & 0.296924 & 2.5019 & 0.007329 \tabularnewline
37 & -0.186138 & -1.5684 & 0.060614 \tabularnewline
38 & 0.060068 & 0.5061 & 0.307164 \tabularnewline
39 & -0.018487 & -0.1558 & 0.438327 \tabularnewline
40 & -0.047447 & -0.3998 & 0.345255 \tabularnewline
41 & 0.05266 & 0.4437 & 0.329296 \tabularnewline
42 & 0.026498 & 0.2233 & 0.411982 \tabularnewline
43 & -0.059275 & -0.4995 & 0.3095 \tabularnewline
44 & 0.01167 & 0.0983 & 0.460971 \tabularnewline
45 & 0.05822 & 0.4906 & 0.312622 \tabularnewline
46 & -0.042934 & -0.3618 & 0.3593 \tabularnewline
47 & -0.067362 & -0.5676 & 0.286048 \tabularnewline
48 & 0.074435 & 0.6272 & 0.26627 \tabularnewline
\hline
\end{tabular}
%Source: https://freestatistics.org/blog/index.php?pk=41935&T=1

[TABLE]
[ROW][C]Autocorrelation Function[/C][/ROW]
[ROW][C]Time lag k[/C][C]ACF(k)[/C][C]T-STAT[/C][C]P-value[/C][/ROW]
[ROW][C]1[/C][C]-0.439557[/C][C]-3.7038[/C][C]0.000208[/C][/ROW]
[ROW][C]2[/C][C]-0.049638[/C][C]-0.4183[/C][C]0.338511[/C][/ROW]
[ROW][C]3[/C][C]0.155327[/C][C]1.3088[/C][C]0.09741[/C][/ROW]
[ROW][C]4[/C][C]-0.167[/C][C]-1.4072[/C][C]0.08187[/C][/ROW]
[ROW][C]5[/C][C]-0.00258[/C][C]-0.0217[/C][C]0.491358[/C][/ROW]
[ROW][C]6[/C][C]0.193215[/C][C]1.6281[/C][C]0.053971[/C][/ROW]
[ROW][C]7[/C][C]-0.131998[/C][C]-1.1122[/C][C]0.134894[/C][/ROW]
[ROW][C]8[/C][C]-0.063278[/C][C]-0.5332[/C][C]0.297783[/C][/ROW]
[ROW][C]9[/C][C]0.188608[/C][C]1.5892[/C][C]0.058225[/C][/ROW]
[ROW][C]10[/C][C]-0.112842[/C][C]-0.9508[/C][C]0.172461[/C][/ROW]
[ROW][C]11[/C][C]-0.322257[/C][C]-2.7154[/C][C]0.004153[/C][/ROW]
[ROW][C]12[/C][C]0.605353[/C][C]5.1008[/C][C]1e-06[/C][/ROW]
[ROW][C]13[/C][C]-0.379045[/C][C]-3.1939[/C][C]0.001047[/C][/ROW]
[ROW][C]14[/C][C]0.043744[/C][C]0.3686[/C][C]0.356764[/C][/ROW]
[ROW][C]15[/C][C]0.116222[/C][C]0.9793[/C][C]0.165378[/C][/ROW]
[ROW][C]16[/C][C]-0.180968[/C][C]-1.5249[/C][C]0.065867[/C][/ROW]
[ROW][C]17[/C][C]0.045591[/C][C]0.3842[/C][C]0.351004[/C][/ROW]
[ROW][C]18[/C][C]0.133605[/C][C]1.1258[/C][C]0.132026[/C][/ROW]
[ROW][C]19[/C][C]-0.091677[/C][C]-0.7725[/C][C]0.221196[/C][/ROW]
[ROW][C]20[/C][C]-0.039407[/C][C]-0.3321[/C][C]0.370414[/C][/ROW]
[ROW][C]21[/C][C]0.117414[/C][C]0.9893[/C][C]0.162926[/C][/ROW]
[ROW][C]22[/C][C]-0.094583[/C][C]-0.797[/C][C]0.214063[/C][/ROW]
[ROW][C]23[/C][C]-0.146951[/C][C]-1.2382[/C][C]0.109854[/C][/ROW]
[ROW][C]24[/C][C]0.431112[/C][C]3.6326[/C][C]0.000263[/C][/ROW]
[ROW][C]25[/C][C]-0.319072[/C][C]-2.6886[/C][C]0.004468[/C][/ROW]
[ROW][C]26[/C][C]0.02509[/C][C]0.2114[/C][C]0.416587[/C][/ROW]
[ROW][C]27[/C][C]0.0559[/C][C]0.471[/C][C]0.319534[/C][/ROW]
[ROW][C]28[/C][C]-0.092143[/C][C]-0.7764[/C][C]0.220042[/C][/ROW]
[ROW][C]29[/C][C]0.034112[/C][C]0.2874[/C][C]0.387309[/C][/ROW]
[ROW][C]30[/C][C]0.059679[/C][C]0.5029[/C][C]0.308307[/C][/ROW]
[ROW][C]31[/C][C]-0.072689[/C][C]-0.6125[/C][C]0.271086[/C][/ROW]
[ROW][C]32[/C][C]0.033739[/C][C]0.2843[/C][C]0.388509[/C][/ROW]
[ROW][C]33[/C][C]0.039958[/C][C]0.3367[/C][C]0.36867[/C][/ROW]
[ROW][C]34[/C][C]-0.083467[/C][C]-0.7033[/C][C]0.242083[/C][/ROW]
[ROW][C]35[/C][C]-0.133679[/C][C]-1.1264[/C][C]0.131894[/C][/ROW]
[ROW][C]36[/C][C]0.296924[/C][C]2.5019[/C][C]0.007329[/C][/ROW]
[ROW][C]37[/C][C]-0.186138[/C][C]-1.5684[/C][C]0.060614[/C][/ROW]
[ROW][C]38[/C][C]0.060068[/C][C]0.5061[/C][C]0.307164[/C][/ROW]
[ROW][C]39[/C][C]-0.018487[/C][C]-0.1558[/C][C]0.438327[/C][/ROW]
[ROW][C]40[/C][C]-0.047447[/C][C]-0.3998[/C][C]0.345255[/C][/ROW]
[ROW][C]41[/C][C]0.05266[/C][C]0.4437[/C][C]0.329296[/C][/ROW]
[ROW][C]42[/C][C]0.026498[/C][C]0.2233[/C][C]0.411982[/C][/ROW]
[ROW][C]43[/C][C]-0.059275[/C][C]-0.4995[/C][C]0.3095[/C][/ROW]
[ROW][C]44[/C][C]0.01167[/C][C]0.0983[/C][C]0.460971[/C][/ROW]
[ROW][C]45[/C][C]0.05822[/C][C]0.4906[/C][C]0.312622[/C][/ROW]
[ROW][C]46[/C][C]-0.042934[/C][C]-0.3618[/C][C]0.3593[/C][/ROW]
[ROW][C]47[/C][C]-0.067362[/C][C]-0.5676[/C][C]0.286048[/C][/ROW]
[ROW][C]48[/C][C]0.074435[/C][C]0.6272[/C][C]0.26627[/C][/ROW]
[/TABLE]
Source: https://freestatistics.org/blog/index.php?pk=41935&T=1

Globally Unique Identifier (entire table): ba.freestatistics.org/blog/index.php?pk=41935&T=1

As an alternative you can also use a QR Code:  

The GUIDs for individual cells are displayed in the table below:

Autocorrelation Function
Time lag kACF(k)T-STATP-value
1-0.439557-3.70380.000208
2-0.049638-0.41830.338511
30.1553271.30880.09741
4-0.167-1.40720.08187
5-0.00258-0.02170.491358
60.1932151.62810.053971
7-0.131998-1.11220.134894
8-0.063278-0.53320.297783
90.1886081.58920.058225
10-0.112842-0.95080.172461
11-0.322257-2.71540.004153
120.6053535.10081e-06
13-0.379045-3.19390.001047
140.0437440.36860.356764
150.1162220.97930.165378
16-0.180968-1.52490.065867
170.0455910.38420.351004
180.1336051.12580.132026
19-0.091677-0.77250.221196
20-0.039407-0.33210.370414
210.1174140.98930.162926
22-0.094583-0.7970.214063
23-0.146951-1.23820.109854
240.4311123.63260.000263
25-0.319072-2.68860.004468
260.025090.21140.416587
270.05590.4710.319534
28-0.092143-0.77640.220042
290.0341120.28740.387309
300.0596790.50290.308307
31-0.072689-0.61250.271086
320.0337390.28430.388509
330.0399580.33670.36867
34-0.083467-0.70330.242083
35-0.133679-1.12640.131894
360.2969242.50190.007329
37-0.186138-1.56840.060614
380.0600680.50610.307164
39-0.018487-0.15580.438327
40-0.047447-0.39980.345255
410.052660.44370.329296
420.0264980.22330.411982
43-0.059275-0.49950.3095
440.011670.09830.460971
450.058220.49060.312622
46-0.042934-0.36180.3593
47-0.067362-0.56760.286048
480.0744350.62720.26627


Partial Autocorrelation Function
Time lag kPACF(k)T-STATP-value
1-0.439557-3.70380.000208
2-0.301006-2.53630.006702
3-0.007317-0.06170.475506
4-0.131121-1.10480.136479
5-0.148015-1.24720.108212
60.1091270.91950.180468
70.0435580.3670.357345
8-0.099184-0.83570.203053
90.0858490.72340.235911
100.0657630.55410.290617
11-0.450471-3.79570.000154
120.325862.74570.003822
13-0.026602-0.22410.411642
14-0.037095-0.31260.377763
15-0.071028-0.59850.275707
160.0037760.03180.487353
17-0.018618-0.15690.437892
18-0.06945-0.58520.280135
190.1099360.92630.178705
200.0166540.14030.444399
21-0.096944-0.81690.208369
22-0.048679-0.41020.341455
230.0749330.63140.264904
240.1196711.00840.158352
250.0069960.05890.47658
26-0.085258-0.71840.237436
27-0.110989-0.93520.176426
280.0323310.27240.393043
29-0.042763-0.36030.359835
30-0.065594-0.55270.291102
31-0.039101-0.32950.371384
320.0900720.7590.225196
33-0.057946-0.48830.313434
34-0.039104-0.32950.371376
35-0.060673-0.51120.305383
36-0.056935-0.47970.316442
37-0.030779-0.25940.398057
380.0404510.34080.367112
39-0.011938-0.10060.460078
40-0.050835-0.42830.334849
410.0118310.09970.460435
420.0017060.01440.494287
43-0.030165-0.25420.400047
44-0.070351-0.59280.277602
450.0629410.53030.298763
46-0.021015-0.17710.429976
470.0161160.13580.446184
48-0.203537-1.7150.045351

\begin{tabular}{lllllllll}
\hline
Partial Autocorrelation Function \tabularnewline
Time lag k & PACF(k) & T-STAT & P-value \tabularnewline
1 & -0.439557 & -3.7038 & 0.000208 \tabularnewline
2 & -0.301006 & -2.5363 & 0.006702 \tabularnewline
3 & -0.007317 & -0.0617 & 0.475506 \tabularnewline
4 & -0.131121 & -1.1048 & 0.136479 \tabularnewline
5 & -0.148015 & -1.2472 & 0.108212 \tabularnewline
6 & 0.109127 & 0.9195 & 0.180468 \tabularnewline
7 & 0.043558 & 0.367 & 0.357345 \tabularnewline
8 & -0.099184 & -0.8357 & 0.203053 \tabularnewline
9 & 0.085849 & 0.7234 & 0.235911 \tabularnewline
10 & 0.065763 & 0.5541 & 0.290617 \tabularnewline
11 & -0.450471 & -3.7957 & 0.000154 \tabularnewline
12 & 0.32586 & 2.7457 & 0.003822 \tabularnewline
13 & -0.026602 & -0.2241 & 0.411642 \tabularnewline
14 & -0.037095 & -0.3126 & 0.377763 \tabularnewline
15 & -0.071028 & -0.5985 & 0.275707 \tabularnewline
16 & 0.003776 & 0.0318 & 0.487353 \tabularnewline
17 & -0.018618 & -0.1569 & 0.437892 \tabularnewline
18 & -0.06945 & -0.5852 & 0.280135 \tabularnewline
19 & 0.109936 & 0.9263 & 0.178705 \tabularnewline
20 & 0.016654 & 0.1403 & 0.444399 \tabularnewline
21 & -0.096944 & -0.8169 & 0.208369 \tabularnewline
22 & -0.048679 & -0.4102 & 0.341455 \tabularnewline
23 & 0.074933 & 0.6314 & 0.264904 \tabularnewline
24 & 0.119671 & 1.0084 & 0.158352 \tabularnewline
25 & 0.006996 & 0.0589 & 0.47658 \tabularnewline
26 & -0.085258 & -0.7184 & 0.237436 \tabularnewline
27 & -0.110989 & -0.9352 & 0.176426 \tabularnewline
28 & 0.032331 & 0.2724 & 0.393043 \tabularnewline
29 & -0.042763 & -0.3603 & 0.359835 \tabularnewline
30 & -0.065594 & -0.5527 & 0.291102 \tabularnewline
31 & -0.039101 & -0.3295 & 0.371384 \tabularnewline
32 & 0.090072 & 0.759 & 0.225196 \tabularnewline
33 & -0.057946 & -0.4883 & 0.313434 \tabularnewline
34 & -0.039104 & -0.3295 & 0.371376 \tabularnewline
35 & -0.060673 & -0.5112 & 0.305383 \tabularnewline
36 & -0.056935 & -0.4797 & 0.316442 \tabularnewline
37 & -0.030779 & -0.2594 & 0.398057 \tabularnewline
38 & 0.040451 & 0.3408 & 0.367112 \tabularnewline
39 & -0.011938 & -0.1006 & 0.460078 \tabularnewline
40 & -0.050835 & -0.4283 & 0.334849 \tabularnewline
41 & 0.011831 & 0.0997 & 0.460435 \tabularnewline
42 & 0.001706 & 0.0144 & 0.494287 \tabularnewline
43 & -0.030165 & -0.2542 & 0.400047 \tabularnewline
44 & -0.070351 & -0.5928 & 0.277602 \tabularnewline
45 & 0.062941 & 0.5303 & 0.298763 \tabularnewline
46 & -0.021015 & -0.1771 & 0.429976 \tabularnewline
47 & 0.016116 & 0.1358 & 0.446184 \tabularnewline
48 & -0.203537 & -1.715 & 0.045351 \tabularnewline
\hline
\end{tabular}
%Source: https://freestatistics.org/blog/index.php?pk=41935&T=2

[TABLE]
[ROW][C]Partial Autocorrelation Function[/C][/ROW]
[ROW][C]Time lag k[/C][C]PACF(k)[/C][C]T-STAT[/C][C]P-value[/C][/ROW]
[ROW][C]1[/C][C]-0.439557[/C][C]-3.7038[/C][C]0.000208[/C][/ROW]
[ROW][C]2[/C][C]-0.301006[/C][C]-2.5363[/C][C]0.006702[/C][/ROW]
[ROW][C]3[/C][C]-0.007317[/C][C]-0.0617[/C][C]0.475506[/C][/ROW]
[ROW][C]4[/C][C]-0.131121[/C][C]-1.1048[/C][C]0.136479[/C][/ROW]
[ROW][C]5[/C][C]-0.148015[/C][C]-1.2472[/C][C]0.108212[/C][/ROW]
[ROW][C]6[/C][C]0.109127[/C][C]0.9195[/C][C]0.180468[/C][/ROW]
[ROW][C]7[/C][C]0.043558[/C][C]0.367[/C][C]0.357345[/C][/ROW]
[ROW][C]8[/C][C]-0.099184[/C][C]-0.8357[/C][C]0.203053[/C][/ROW]
[ROW][C]9[/C][C]0.085849[/C][C]0.7234[/C][C]0.235911[/C][/ROW]
[ROW][C]10[/C][C]0.065763[/C][C]0.5541[/C][C]0.290617[/C][/ROW]
[ROW][C]11[/C][C]-0.450471[/C][C]-3.7957[/C][C]0.000154[/C][/ROW]
[ROW][C]12[/C][C]0.32586[/C][C]2.7457[/C][C]0.003822[/C][/ROW]
[ROW][C]13[/C][C]-0.026602[/C][C]-0.2241[/C][C]0.411642[/C][/ROW]
[ROW][C]14[/C][C]-0.037095[/C][C]-0.3126[/C][C]0.377763[/C][/ROW]
[ROW][C]15[/C][C]-0.071028[/C][C]-0.5985[/C][C]0.275707[/C][/ROW]
[ROW][C]16[/C][C]0.003776[/C][C]0.0318[/C][C]0.487353[/C][/ROW]
[ROW][C]17[/C][C]-0.018618[/C][C]-0.1569[/C][C]0.437892[/C][/ROW]
[ROW][C]18[/C][C]-0.06945[/C][C]-0.5852[/C][C]0.280135[/C][/ROW]
[ROW][C]19[/C][C]0.109936[/C][C]0.9263[/C][C]0.178705[/C][/ROW]
[ROW][C]20[/C][C]0.016654[/C][C]0.1403[/C][C]0.444399[/C][/ROW]
[ROW][C]21[/C][C]-0.096944[/C][C]-0.8169[/C][C]0.208369[/C][/ROW]
[ROW][C]22[/C][C]-0.048679[/C][C]-0.4102[/C][C]0.341455[/C][/ROW]
[ROW][C]23[/C][C]0.074933[/C][C]0.6314[/C][C]0.264904[/C][/ROW]
[ROW][C]24[/C][C]0.119671[/C][C]1.0084[/C][C]0.158352[/C][/ROW]
[ROW][C]25[/C][C]0.006996[/C][C]0.0589[/C][C]0.47658[/C][/ROW]
[ROW][C]26[/C][C]-0.085258[/C][C]-0.7184[/C][C]0.237436[/C][/ROW]
[ROW][C]27[/C][C]-0.110989[/C][C]-0.9352[/C][C]0.176426[/C][/ROW]
[ROW][C]28[/C][C]0.032331[/C][C]0.2724[/C][C]0.393043[/C][/ROW]
[ROW][C]29[/C][C]-0.042763[/C][C]-0.3603[/C][C]0.359835[/C][/ROW]
[ROW][C]30[/C][C]-0.065594[/C][C]-0.5527[/C][C]0.291102[/C][/ROW]
[ROW][C]31[/C][C]-0.039101[/C][C]-0.3295[/C][C]0.371384[/C][/ROW]
[ROW][C]32[/C][C]0.090072[/C][C]0.759[/C][C]0.225196[/C][/ROW]
[ROW][C]33[/C][C]-0.057946[/C][C]-0.4883[/C][C]0.313434[/C][/ROW]
[ROW][C]34[/C][C]-0.039104[/C][C]-0.3295[/C][C]0.371376[/C][/ROW]
[ROW][C]35[/C][C]-0.060673[/C][C]-0.5112[/C][C]0.305383[/C][/ROW]
[ROW][C]36[/C][C]-0.056935[/C][C]-0.4797[/C][C]0.316442[/C][/ROW]
[ROW][C]37[/C][C]-0.030779[/C][C]-0.2594[/C][C]0.398057[/C][/ROW]
[ROW][C]38[/C][C]0.040451[/C][C]0.3408[/C][C]0.367112[/C][/ROW]
[ROW][C]39[/C][C]-0.011938[/C][C]-0.1006[/C][C]0.460078[/C][/ROW]
[ROW][C]40[/C][C]-0.050835[/C][C]-0.4283[/C][C]0.334849[/C][/ROW]
[ROW][C]41[/C][C]0.011831[/C][C]0.0997[/C][C]0.460435[/C][/ROW]
[ROW][C]42[/C][C]0.001706[/C][C]0.0144[/C][C]0.494287[/C][/ROW]
[ROW][C]43[/C][C]-0.030165[/C][C]-0.2542[/C][C]0.400047[/C][/ROW]
[ROW][C]44[/C][C]-0.070351[/C][C]-0.5928[/C][C]0.277602[/C][/ROW]
[ROW][C]45[/C][C]0.062941[/C][C]0.5303[/C][C]0.298763[/C][/ROW]
[ROW][C]46[/C][C]-0.021015[/C][C]-0.1771[/C][C]0.429976[/C][/ROW]
[ROW][C]47[/C][C]0.016116[/C][C]0.1358[/C][C]0.446184[/C][/ROW]
[ROW][C]48[/C][C]-0.203537[/C][C]-1.715[/C][C]0.045351[/C][/ROW]
[/TABLE]
Source: https://freestatistics.org/blog/index.php?pk=41935&T=2

Globally Unique Identifier (entire table): ba.freestatistics.org/blog/index.php?pk=41935&T=2

As an alternative you can also use a QR Code:  

The GUIDs for individual cells are displayed in the table below:

Partial Autocorrelation Function
Time lag kPACF(k)T-STATP-value
1-0.439557-3.70380.000208
2-0.301006-2.53630.006702
3-0.007317-0.06170.475506
4-0.131121-1.10480.136479
5-0.148015-1.24720.108212
60.1091270.91950.180468
70.0435580.3670.357345
8-0.099184-0.83570.203053
90.0858490.72340.235911
100.0657630.55410.290617
11-0.450471-3.79570.000154
120.325862.74570.003822
13-0.026602-0.22410.411642
14-0.037095-0.31260.377763
15-0.071028-0.59850.275707
160.0037760.03180.487353
17-0.018618-0.15690.437892
18-0.06945-0.58520.280135
190.1099360.92630.178705
200.0166540.14030.444399
21-0.096944-0.81690.208369
22-0.048679-0.41020.341455
230.0749330.63140.264904
240.1196711.00840.158352
250.0069960.05890.47658
26-0.085258-0.71840.237436
27-0.110989-0.93520.176426
280.0323310.27240.393043
29-0.042763-0.36030.359835
30-0.065594-0.55270.291102
31-0.039101-0.32950.371384
320.0900720.7590.225196
33-0.057946-0.48830.313434
34-0.039104-0.32950.371376
35-0.060673-0.51120.305383
36-0.056935-0.47970.316442
37-0.030779-0.25940.398057
380.0404510.34080.367112
39-0.011938-0.10060.460078
40-0.050835-0.42830.334849
410.0118310.09970.460435
420.0017060.01440.494287
43-0.030165-0.25420.400047
44-0.070351-0.59280.277602
450.0629410.53030.298763
46-0.021015-0.17710.429976
470.0161160.13580.446184
48-0.203537-1.7150.045351


Parameters (Session):
par1 = 48 ; par2 = 1 ; par3 = 1 ; par4 = 0 ; par5 = 12 ;
Parameters (R input):
par1 = 48 ; par2 = 1 ; par3 = 1 ; par4 = 0 ; par5 = 12 ;
R code (references can be found in the software module):
if (par1 == 'Default') {
par1 = 10*log10(length(x))
} else {
par1 <- as.numeric(par1)
}
par2 <- as.numeric(par2)
par3 <- as.numeric(par3)
par4 <- as.numeric(par4)
par5 <- as.numeric(par5)
if (par2 == 0) {
x <- log(x)
} else {
x <- (x ^ par2 - 1) / par2
}
if (par3 > 0) x <- diff(x,lag=1,difference=par3)
if (par4 > 0) x <- diff(x,lag=par5,difference=par4)
bitmap(file='pic1.png')
racf <- acf(x,par1,main='Autocorrelation',xlab='lags',ylab='ACF')
dev.off()
bitmap(file='pic2.png')
rpacf <- pacf(x,par1,main='Partial Autocorrelation',xlab='lags',ylab='PACF')
dev.off()
(myacf <- c(racf$acf))
(mypacf <- c(rpacf$acf))
lengthx <- length(x)
sqrtn <- sqrt(lengthx)
load(file='createtable')
a<-table.start()
a<-table.row.start(a)
a<-table.element(a,'Autocorrelation Function',4,TRUE)
a<-table.row.end(a)
a<-table.row.start(a)
a<-table.element(a,'Time lag k',header=TRUE)
a<-table.element(a,hyperlink('basics.htm','ACF(k)','click here for more information about the Autocorrelation Function'),header=TRUE)
a<-table.element(a,'T-STAT',header=TRUE)
a<-table.element(a,'P-value',header=TRUE)
a<-table.row.end(a)
for (i in 2:(par1+1)) {
a<-table.row.start(a)
a<-table.element(a,i-1,header=TRUE)
a<-table.element(a,round(myacf[i],6))
mytstat <- myacf[i]*sqrtn
a<-table.element(a,round(mytstat,4))
a<-table.element(a,round(1-pt(abs(mytstat),lengthx),6))
a<-table.row.end(a)
}
a<-table.end(a)
table.save(a,file='mytable.tab')
a<-table.start()
a<-table.row.start(a)
a<-table.element(a,'Partial Autocorrelation Function',4,TRUE)
a<-table.row.end(a)
a<-table.row.start(a)
a<-table.element(a,'Time lag k',header=TRUE)
a<-table.element(a,hyperlink('basics.htm','PACF(k)','click here for more information about the Partial Autocorrelation Function'),header=TRUE)
a<-table.element(a,'T-STAT',header=TRUE)
a<-table.element(a,'P-value',header=TRUE)
a<-table.row.end(a)
for (i in 1:par1) {
a<-table.row.start(a)
a<-table.element(a,i,header=TRUE)
a<-table.element(a,round(mypacf[i],6))
mytstat <- mypacf[i]*sqrtn
a<-table.element(a,round(mytstat,4))
a<-table.element(a,round(1-pt(abs(mytstat),lengthx),6))
a<-table.row.end(a)
}
a<-table.end(a)
table.save(a,file='mytable1.tab')