Free Statistics

of Irreproducible Research!

Author's title

Author*Unverified author*
R Software Modulerwasp_exponentialsmoothing.wasp
Title produced by softwareExponential Smoothing
Date of computationSat, 06 Jun 2009 03:06:29 -0600
Cite this page as followsStatistical Computations at FreeStatistics.org, Office for Research Development and Education, URL https://freestatistics.org/blog/index.php?v=date/2009/Jun/06/t1244279231sqnkg831inyez1g.htm/, Retrieved Sun, 28 Apr 2024 23:51:41 +0000
Statistical Computations at FreeStatistics.org, Office for Research Development and Education, URL https://freestatistics.org/blog/index.php?pk=41934, Retrieved Sun, 28 Apr 2024 23:51:41 +0000
QR Codes:

Original text written by user:
IsPrivate?No (this computation is public)
User-defined keywords
Estimated Impact163
Family? (F = Feedback message, R = changed R code, M = changed R Module, P = changed Parameters, D = changed Data)
-     [Exponential Smoothing] [Exponential Smoot...] [2009-06-04 15:24:33] [2ce3c91abef806693ba7bf55b08cc4e2]
-    D  [Exponential Smoothing] [Kim Van Assche We...] [2009-06-05 20:03:06] [74be16979710d4c4e7c6647856088456]
-   P     [Exponential Smoothing] [Kim Van Assche We...] [2009-06-05 20:08:29] [74be16979710d4c4e7c6647856088456]
-   P         [Exponential Smoothing] [Kim Van Assche We...] [2009-06-06 09:06:29] [d41d8cd98f00b204e9800998ecf8427e] [Current]
Feedback Forum

Post a new message
Dataseries X:
519
517
510
509
501
507
569
580
578
565
547
555
562
561
555
544
537
543
594
611
613
611
594
595
591
589
584
573
567
569
621
629
628
612
595
597
593
590
580
574
573
573
620
626
620
588
566
557
561
549
532
526
511
499
555
565
542
527
510
514
517
508
493
490
469
478
528
534
518
506
502
516


Summary of computational transaction
Raw Inputview raw input (R code)
Raw Outputview raw output of R engine
Computing time1 seconds
R Server'George Udny Yule' @ 72.249.76.132

\begin{tabular}{lllllllll}
\hline
Summary of computational transaction \tabularnewline
Raw Input & view raw input (R code)  \tabularnewline
Raw Output & view raw output of R engine  \tabularnewline
Computing time & 1 seconds \tabularnewline
R Server & 'George Udny Yule' @ 72.249.76.132 \tabularnewline
\hline
\end{tabular}
%Source: https://freestatistics.org/blog/index.php?pk=41934&T=0

[TABLE]
[ROW][C]Summary of computational transaction[/C][/ROW]
[ROW][C]Raw Input[/C][C]view raw input (R code) [/C][/ROW]
[ROW][C]Raw Output[/C][C]view raw output of R engine [/C][/ROW]
[ROW][C]Computing time[/C][C]1 seconds[/C][/ROW]
[ROW][C]R Server[/C][C]'George Udny Yule' @ 72.249.76.132[/C][/ROW]
[/TABLE]
Source: https://freestatistics.org/blog/index.php?pk=41934&T=0

Globally Unique Identifier (entire table): ba.freestatistics.org/blog/index.php?pk=41934&T=0

As an alternative you can also use a QR Code:  

The GUIDs for individual cells are displayed in the table below:

Summary of computational transaction
Raw Inputview raw input (R code)
Raw Outputview raw output of R engine
Computing time1 seconds
R Server'George Udny Yule' @ 72.249.76.132


Estimated Parameters of Exponential Smoothing
ParameterValue
alpha0.941500704926866
beta0.113828330159863
gamma1

\begin{tabular}{lllllllll}
\hline
Estimated Parameters of Exponential Smoothing \tabularnewline
Parameter & Value \tabularnewline
alpha & 0.941500704926866 \tabularnewline
beta & 0.113828330159863 \tabularnewline
gamma & 1 \tabularnewline
\hline
\end{tabular}
%Source: https://freestatistics.org/blog/index.php?pk=41934&T=1

[TABLE]
[ROW][C]Estimated Parameters of Exponential Smoothing[/C][/ROW]
[ROW][C]Parameter[/C][C]Value[/C][/ROW]
[ROW][C]alpha[/C][C]0.941500704926866[/C][/ROW]
[ROW][C]beta[/C][C]0.113828330159863[/C][/ROW]
[ROW][C]gamma[/C][C]1[/C][/ROW]
[/TABLE]
Source: https://freestatistics.org/blog/index.php?pk=41934&T=1

Globally Unique Identifier (entire table): ba.freestatistics.org/blog/index.php?pk=41934&T=1

As an alternative you can also use a QR Code:  

The GUIDs for individual cells are displayed in the table below:

Estimated Parameters of Exponential Smoothing
ParameterValue
alpha0.941500704926866
beta0.113828330159863
gamma1


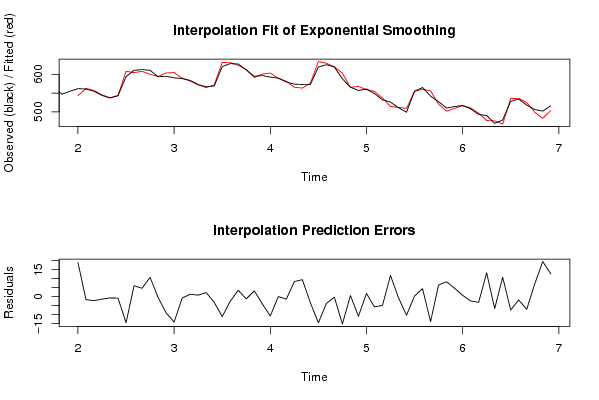
Interpolation Forecasts of Exponential Smoothing
tObservedFittedResiduals
13562543.08627136752218.9137286324783
14561562.640959569084-1.64095956908352
15555557.250866933101-2.25086693310107
16544545.420321905766-1.42032190576595
17537537.719520485293-0.71952048529306
18543543.851413479316-0.85141347931608
19594608.517883609563-14.5178836095628
20611605.0114888319155.98851116808487
21613608.3703313262824.6296686737179
22611600.3209817140510.6790182859496
23594594.486563575286-0.486563575286027
24595604.045930824328-9.04593082432825
25591605.141973441108-14.1419734411083
26589589.8239595535-0.823959553499662
27584582.7066507873041.29334921269560
28573572.1806626942840.819337305715635
29567564.7886100781042.21138992189606
30569572.145457393583-3.14545739358323
31621632.079969015195-11.0799690151947
32629631.60578663998-2.60578663998001
33628624.468357915293.53164208470992
34612613.296180828051-1.29618082805086
35595591.8076327188123.19236728118801
36597600.997975125051-3.99797512505097
37593603.757519454681-10.7575194546810
38590589.9767386522910.0232613477088535
39580581.443419079719-1.44341907971852
40574565.6822034342648.31779656573565
41573563.6041664584059.3958335415955
42573576.354530472415-3.35453047241469
43620634.548359816644-14.5483598166444
44626629.853036717227-3.85303671722693
45620620.315307275957-0.315307275957252
46588603.241475814077-15.2414758140771
47566565.3941653059760.605834694024111
48557567.959623973831-10.9596239738306
49561559.2542348047271.74576519527318
50549554.700835947309-5.70083594730852
51532536.903889144647-4.90388914464666
52526514.29622022306311.7037797769375
53511511.672584694536-0.672584694536113
54499509.322043123141-10.3220431231413
55555554.6788233373260.321176662673793
56565560.5801083371594.41989166284134
57542555.89616684606-13.8961668460602
58527520.5651882652786.43481173472162
59510501.7786222171268.22137778287362
60514509.3791504390824.62084956091815
61517516.2973967704180.702603229581769
62508510.425796546431-2.42579654643055
63493496.209463932967-3.20946393296674
64490476.80076654901913.1992334509815
65469475.653492145676-6.6534921456763
66478467.25886393055810.7411360694421
67528535.478020905203-7.47802090520258
68534535.849049945234-1.8490499452339
69518525.092502066135-7.09250206613456
70506498.9867546867447.01324531325594
71502482.54151562509519.4584843749053
72516503.40765233979112.5923476602094

\begin{tabular}{lllllllll}
\hline
Interpolation Forecasts of Exponential Smoothing \tabularnewline
t & Observed & Fitted & Residuals \tabularnewline
13 & 562 & 543.086271367522 & 18.9137286324783 \tabularnewline
14 & 561 & 562.640959569084 & -1.64095956908352 \tabularnewline
15 & 555 & 557.250866933101 & -2.25086693310107 \tabularnewline
16 & 544 & 545.420321905766 & -1.42032190576595 \tabularnewline
17 & 537 & 537.719520485293 & -0.71952048529306 \tabularnewline
18 & 543 & 543.851413479316 & -0.85141347931608 \tabularnewline
19 & 594 & 608.517883609563 & -14.5178836095628 \tabularnewline
20 & 611 & 605.011488831915 & 5.98851116808487 \tabularnewline
21 & 613 & 608.370331326282 & 4.6296686737179 \tabularnewline
22 & 611 & 600.32098171405 & 10.6790182859496 \tabularnewline
23 & 594 & 594.486563575286 & -0.486563575286027 \tabularnewline
24 & 595 & 604.045930824328 & -9.04593082432825 \tabularnewline
25 & 591 & 605.141973441108 & -14.1419734411083 \tabularnewline
26 & 589 & 589.8239595535 & -0.823959553499662 \tabularnewline
27 & 584 & 582.706650787304 & 1.29334921269560 \tabularnewline
28 & 573 & 572.180662694284 & 0.819337305715635 \tabularnewline
29 & 567 & 564.788610078104 & 2.21138992189606 \tabularnewline
30 & 569 & 572.145457393583 & -3.14545739358323 \tabularnewline
31 & 621 & 632.079969015195 & -11.0799690151947 \tabularnewline
32 & 629 & 631.60578663998 & -2.60578663998001 \tabularnewline
33 & 628 & 624.46835791529 & 3.53164208470992 \tabularnewline
34 & 612 & 613.296180828051 & -1.29618082805086 \tabularnewline
35 & 595 & 591.807632718812 & 3.19236728118801 \tabularnewline
36 & 597 & 600.997975125051 & -3.99797512505097 \tabularnewline
37 & 593 & 603.757519454681 & -10.7575194546810 \tabularnewline
38 & 590 & 589.976738652291 & 0.0232613477088535 \tabularnewline
39 & 580 & 581.443419079719 & -1.44341907971852 \tabularnewline
40 & 574 & 565.682203434264 & 8.31779656573565 \tabularnewline
41 & 573 & 563.604166458405 & 9.3958335415955 \tabularnewline
42 & 573 & 576.354530472415 & -3.35453047241469 \tabularnewline
43 & 620 & 634.548359816644 & -14.5483598166444 \tabularnewline
44 & 626 & 629.853036717227 & -3.85303671722693 \tabularnewline
45 & 620 & 620.315307275957 & -0.315307275957252 \tabularnewline
46 & 588 & 603.241475814077 & -15.2414758140771 \tabularnewline
47 & 566 & 565.394165305976 & 0.605834694024111 \tabularnewline
48 & 557 & 567.959623973831 & -10.9596239738306 \tabularnewline
49 & 561 & 559.254234804727 & 1.74576519527318 \tabularnewline
50 & 549 & 554.700835947309 & -5.70083594730852 \tabularnewline
51 & 532 & 536.903889144647 & -4.90388914464666 \tabularnewline
52 & 526 & 514.296220223063 & 11.7037797769375 \tabularnewline
53 & 511 & 511.672584694536 & -0.672584694536113 \tabularnewline
54 & 499 & 509.322043123141 & -10.3220431231413 \tabularnewline
55 & 555 & 554.678823337326 & 0.321176662673793 \tabularnewline
56 & 565 & 560.580108337159 & 4.41989166284134 \tabularnewline
57 & 542 & 555.89616684606 & -13.8961668460602 \tabularnewline
58 & 527 & 520.565188265278 & 6.43481173472162 \tabularnewline
59 & 510 & 501.778622217126 & 8.22137778287362 \tabularnewline
60 & 514 & 509.379150439082 & 4.62084956091815 \tabularnewline
61 & 517 & 516.297396770418 & 0.702603229581769 \tabularnewline
62 & 508 & 510.425796546431 & -2.42579654643055 \tabularnewline
63 & 493 & 496.209463932967 & -3.20946393296674 \tabularnewline
64 & 490 & 476.800766549019 & 13.1992334509815 \tabularnewline
65 & 469 & 475.653492145676 & -6.6534921456763 \tabularnewline
66 & 478 & 467.258863930558 & 10.7411360694421 \tabularnewline
67 & 528 & 535.478020905203 & -7.47802090520258 \tabularnewline
68 & 534 & 535.849049945234 & -1.8490499452339 \tabularnewline
69 & 518 & 525.092502066135 & -7.09250206613456 \tabularnewline
70 & 506 & 498.986754686744 & 7.01324531325594 \tabularnewline
71 & 502 & 482.541515625095 & 19.4584843749053 \tabularnewline
72 & 516 & 503.407652339791 & 12.5923476602094 \tabularnewline
\hline
\end{tabular}
%Source: https://freestatistics.org/blog/index.php?pk=41934&T=2

[TABLE]
[ROW][C]Interpolation Forecasts of Exponential Smoothing[/C][/ROW]
[ROW][C]t[/C][C]Observed[/C][C]Fitted[/C][C]Residuals[/C][/ROW]
[ROW][C]13[/C][C]562[/C][C]543.086271367522[/C][C]18.9137286324783[/C][/ROW]
[ROW][C]14[/C][C]561[/C][C]562.640959569084[/C][C]-1.64095956908352[/C][/ROW]
[ROW][C]15[/C][C]555[/C][C]557.250866933101[/C][C]-2.25086693310107[/C][/ROW]
[ROW][C]16[/C][C]544[/C][C]545.420321905766[/C][C]-1.42032190576595[/C][/ROW]
[ROW][C]17[/C][C]537[/C][C]537.719520485293[/C][C]-0.71952048529306[/C][/ROW]
[ROW][C]18[/C][C]543[/C][C]543.851413479316[/C][C]-0.85141347931608[/C][/ROW]
[ROW][C]19[/C][C]594[/C][C]608.517883609563[/C][C]-14.5178836095628[/C][/ROW]
[ROW][C]20[/C][C]611[/C][C]605.011488831915[/C][C]5.98851116808487[/C][/ROW]
[ROW][C]21[/C][C]613[/C][C]608.370331326282[/C][C]4.6296686737179[/C][/ROW]
[ROW][C]22[/C][C]611[/C][C]600.32098171405[/C][C]10.6790182859496[/C][/ROW]
[ROW][C]23[/C][C]594[/C][C]594.486563575286[/C][C]-0.486563575286027[/C][/ROW]
[ROW][C]24[/C][C]595[/C][C]604.045930824328[/C][C]-9.04593082432825[/C][/ROW]
[ROW][C]25[/C][C]591[/C][C]605.141973441108[/C][C]-14.1419734411083[/C][/ROW]
[ROW][C]26[/C][C]589[/C][C]589.8239595535[/C][C]-0.823959553499662[/C][/ROW]
[ROW][C]27[/C][C]584[/C][C]582.706650787304[/C][C]1.29334921269560[/C][/ROW]
[ROW][C]28[/C][C]573[/C][C]572.180662694284[/C][C]0.819337305715635[/C][/ROW]
[ROW][C]29[/C][C]567[/C][C]564.788610078104[/C][C]2.21138992189606[/C][/ROW]
[ROW][C]30[/C][C]569[/C][C]572.145457393583[/C][C]-3.14545739358323[/C][/ROW]
[ROW][C]31[/C][C]621[/C][C]632.079969015195[/C][C]-11.0799690151947[/C][/ROW]
[ROW][C]32[/C][C]629[/C][C]631.60578663998[/C][C]-2.60578663998001[/C][/ROW]
[ROW][C]33[/C][C]628[/C][C]624.46835791529[/C][C]3.53164208470992[/C][/ROW]
[ROW][C]34[/C][C]612[/C][C]613.296180828051[/C][C]-1.29618082805086[/C][/ROW]
[ROW][C]35[/C][C]595[/C][C]591.807632718812[/C][C]3.19236728118801[/C][/ROW]
[ROW][C]36[/C][C]597[/C][C]600.997975125051[/C][C]-3.99797512505097[/C][/ROW]
[ROW][C]37[/C][C]593[/C][C]603.757519454681[/C][C]-10.7575194546810[/C][/ROW]
[ROW][C]38[/C][C]590[/C][C]589.976738652291[/C][C]0.0232613477088535[/C][/ROW]
[ROW][C]39[/C][C]580[/C][C]581.443419079719[/C][C]-1.44341907971852[/C][/ROW]
[ROW][C]40[/C][C]574[/C][C]565.682203434264[/C][C]8.31779656573565[/C][/ROW]
[ROW][C]41[/C][C]573[/C][C]563.604166458405[/C][C]9.3958335415955[/C][/ROW]
[ROW][C]42[/C][C]573[/C][C]576.354530472415[/C][C]-3.35453047241469[/C][/ROW]
[ROW][C]43[/C][C]620[/C][C]634.548359816644[/C][C]-14.5483598166444[/C][/ROW]
[ROW][C]44[/C][C]626[/C][C]629.853036717227[/C][C]-3.85303671722693[/C][/ROW]
[ROW][C]45[/C][C]620[/C][C]620.315307275957[/C][C]-0.315307275957252[/C][/ROW]
[ROW][C]46[/C][C]588[/C][C]603.241475814077[/C][C]-15.2414758140771[/C][/ROW]
[ROW][C]47[/C][C]566[/C][C]565.394165305976[/C][C]0.605834694024111[/C][/ROW]
[ROW][C]48[/C][C]557[/C][C]567.959623973831[/C][C]-10.9596239738306[/C][/ROW]
[ROW][C]49[/C][C]561[/C][C]559.254234804727[/C][C]1.74576519527318[/C][/ROW]
[ROW][C]50[/C][C]549[/C][C]554.700835947309[/C][C]-5.70083594730852[/C][/ROW]
[ROW][C]51[/C][C]532[/C][C]536.903889144647[/C][C]-4.90388914464666[/C][/ROW]
[ROW][C]52[/C][C]526[/C][C]514.296220223063[/C][C]11.7037797769375[/C][/ROW]
[ROW][C]53[/C][C]511[/C][C]511.672584694536[/C][C]-0.672584694536113[/C][/ROW]
[ROW][C]54[/C][C]499[/C][C]509.322043123141[/C][C]-10.3220431231413[/C][/ROW]
[ROW][C]55[/C][C]555[/C][C]554.678823337326[/C][C]0.321176662673793[/C][/ROW]
[ROW][C]56[/C][C]565[/C][C]560.580108337159[/C][C]4.41989166284134[/C][/ROW]
[ROW][C]57[/C][C]542[/C][C]555.89616684606[/C][C]-13.8961668460602[/C][/ROW]
[ROW][C]58[/C][C]527[/C][C]520.565188265278[/C][C]6.43481173472162[/C][/ROW]
[ROW][C]59[/C][C]510[/C][C]501.778622217126[/C][C]8.22137778287362[/C][/ROW]
[ROW][C]60[/C][C]514[/C][C]509.379150439082[/C][C]4.62084956091815[/C][/ROW]
[ROW][C]61[/C][C]517[/C][C]516.297396770418[/C][C]0.702603229581769[/C][/ROW]
[ROW][C]62[/C][C]508[/C][C]510.425796546431[/C][C]-2.42579654643055[/C][/ROW]
[ROW][C]63[/C][C]493[/C][C]496.209463932967[/C][C]-3.20946393296674[/C][/ROW]
[ROW][C]64[/C][C]490[/C][C]476.800766549019[/C][C]13.1992334509815[/C][/ROW]
[ROW][C]65[/C][C]469[/C][C]475.653492145676[/C][C]-6.6534921456763[/C][/ROW]
[ROW][C]66[/C][C]478[/C][C]467.258863930558[/C][C]10.7411360694421[/C][/ROW]
[ROW][C]67[/C][C]528[/C][C]535.478020905203[/C][C]-7.47802090520258[/C][/ROW]
[ROW][C]68[/C][C]534[/C][C]535.849049945234[/C][C]-1.8490499452339[/C][/ROW]
[ROW][C]69[/C][C]518[/C][C]525.092502066135[/C][C]-7.09250206613456[/C][/ROW]
[ROW][C]70[/C][C]506[/C][C]498.986754686744[/C][C]7.01324531325594[/C][/ROW]
[ROW][C]71[/C][C]502[/C][C]482.541515625095[/C][C]19.4584843749053[/C][/ROW]
[ROW][C]72[/C][C]516[/C][C]503.407652339791[/C][C]12.5923476602094[/C][/ROW]
[/TABLE]
Source: https://freestatistics.org/blog/index.php?pk=41934&T=2

Globally Unique Identifier (entire table): ba.freestatistics.org/blog/index.php?pk=41934&T=2

As an alternative you can also use a QR Code:  

The GUIDs for individual cells are displayed in the table below:

Interpolation Forecasts of Exponential Smoothing
tObservedFittedResiduals
13562543.08627136752218.9137286324783
14561562.640959569084-1.64095956908352
15555557.250866933101-2.25086693310107
16544545.420321905766-1.42032190576595
17537537.719520485293-0.71952048529306
18543543.851413479316-0.85141347931608
19594608.517883609563-14.5178836095628
20611605.0114888319155.98851116808487
21613608.3703313262824.6296686737179
22611600.3209817140510.6790182859496
23594594.486563575286-0.486563575286027
24595604.045930824328-9.04593082432825
25591605.141973441108-14.1419734411083
26589589.8239595535-0.823959553499662
27584582.7066507873041.29334921269560
28573572.1806626942840.819337305715635
29567564.7886100781042.21138992189606
30569572.145457393583-3.14545739358323
31621632.079969015195-11.0799690151947
32629631.60578663998-2.60578663998001
33628624.468357915293.53164208470992
34612613.296180828051-1.29618082805086
35595591.8076327188123.19236728118801
36597600.997975125051-3.99797512505097
37593603.757519454681-10.7575194546810
38590589.9767386522910.0232613477088535
39580581.443419079719-1.44341907971852
40574565.6822034342648.31779656573565
41573563.6041664584059.3958335415955
42573576.354530472415-3.35453047241469
43620634.548359816644-14.5483598166444
44626629.853036717227-3.85303671722693
45620620.315307275957-0.315307275957252
46588603.241475814077-15.2414758140771
47566565.3941653059760.605834694024111
48557567.959623973831-10.9596239738306
49561559.2542348047271.74576519527318
50549554.700835947309-5.70083594730852
51532536.903889144647-4.90388914464666
52526514.29622022306311.7037797769375
53511511.672584694536-0.672584694536113
54499509.322043123141-10.3220431231413
55555554.6788233373260.321176662673793
56565560.5801083371594.41989166284134
57542555.89616684606-13.8961668460602
58527520.5651882652786.43481173472162
59510501.7786222171268.22137778287362
60514509.3791504390824.62084956091815
61517516.2973967704180.702603229581769
62508510.425796546431-2.42579654643055
63493496.209463932967-3.20946393296674
64490476.80076654901913.1992334509815
65469475.653492145676-6.6534921456763
66478467.25886393055810.7411360694421
67528535.478020905203-7.47802090520258
68534535.849049945234-1.8490499452339
69518525.092502066135-7.09250206613456
70506498.9867546867447.01324531325594
71502482.54151562509519.4584843749053
72516503.40765233979112.5923476602094


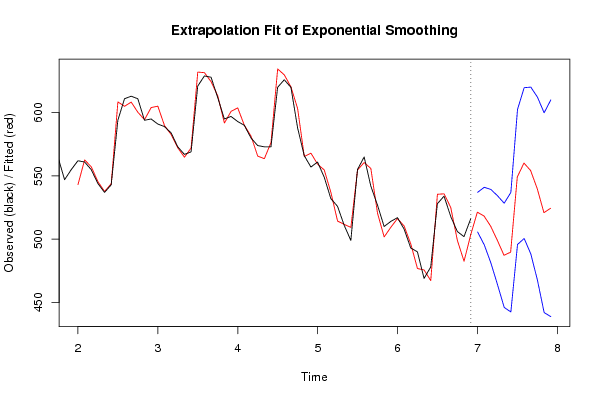
Extrapolation Forecasts of Exponential Smoothing
tForecast95% Lower Bound95% Upper Bound
73521.352649272085505.681790835391537.023507708779
74518.312034996166495.604376579365541.019693412966
75510.269215406278481.222382864873539.316047947682
76499.121552156867463.972455250068534.270649063665
77487.25068942133446.062094297472528.439284545188
78489.715823073684442.466658373058536.96498777431
79549.183184182753495.806694763435602.559673602072
80560.152280575576500.554968880954619.749592270199
81554.256252507838488.328303958905620.18420105677
82539.839752906322467.461198360502612.218307452143
83520.9544462907441.998997742049599.909894839352
84524.448257103744438.78578859228610.110725615209

\begin{tabular}{lllllllll}
\hline
Extrapolation Forecasts of Exponential Smoothing \tabularnewline
t & Forecast & 95% Lower Bound & 95% Upper Bound \tabularnewline
73 & 521.352649272085 & 505.681790835391 & 537.023507708779 \tabularnewline
74 & 518.312034996166 & 495.604376579365 & 541.019693412966 \tabularnewline
75 & 510.269215406278 & 481.222382864873 & 539.316047947682 \tabularnewline
76 & 499.121552156867 & 463.972455250068 & 534.270649063665 \tabularnewline
77 & 487.25068942133 & 446.062094297472 & 528.439284545188 \tabularnewline
78 & 489.715823073684 & 442.466658373058 & 536.96498777431 \tabularnewline
79 & 549.183184182753 & 495.806694763435 & 602.559673602072 \tabularnewline
80 & 560.152280575576 & 500.554968880954 & 619.749592270199 \tabularnewline
81 & 554.256252507838 & 488.328303958905 & 620.18420105677 \tabularnewline
82 & 539.839752906322 & 467.461198360502 & 612.218307452143 \tabularnewline
83 & 520.9544462907 & 441.998997742049 & 599.909894839352 \tabularnewline
84 & 524.448257103744 & 438.78578859228 & 610.110725615209 \tabularnewline
\hline
\end{tabular}
%Source: https://freestatistics.org/blog/index.php?pk=41934&T=3

[TABLE]
[ROW][C]Extrapolation Forecasts of Exponential Smoothing[/C][/ROW]
[ROW][C]t[/C][C]Forecast[/C][C]95% Lower Bound[/C][C]95% Upper Bound[/C][/ROW]
[ROW][C]73[/C][C]521.352649272085[/C][C]505.681790835391[/C][C]537.023507708779[/C][/ROW]
[ROW][C]74[/C][C]518.312034996166[/C][C]495.604376579365[/C][C]541.019693412966[/C][/ROW]
[ROW][C]75[/C][C]510.269215406278[/C][C]481.222382864873[/C][C]539.316047947682[/C][/ROW]
[ROW][C]76[/C][C]499.121552156867[/C][C]463.972455250068[/C][C]534.270649063665[/C][/ROW]
[ROW][C]77[/C][C]487.25068942133[/C][C]446.062094297472[/C][C]528.439284545188[/C][/ROW]
[ROW][C]78[/C][C]489.715823073684[/C][C]442.466658373058[/C][C]536.96498777431[/C][/ROW]
[ROW][C]79[/C][C]549.183184182753[/C][C]495.806694763435[/C][C]602.559673602072[/C][/ROW]
[ROW][C]80[/C][C]560.152280575576[/C][C]500.554968880954[/C][C]619.749592270199[/C][/ROW]
[ROW][C]81[/C][C]554.256252507838[/C][C]488.328303958905[/C][C]620.18420105677[/C][/ROW]
[ROW][C]82[/C][C]539.839752906322[/C][C]467.461198360502[/C][C]612.218307452143[/C][/ROW]
[ROW][C]83[/C][C]520.9544462907[/C][C]441.998997742049[/C][C]599.909894839352[/C][/ROW]
[ROW][C]84[/C][C]524.448257103744[/C][C]438.78578859228[/C][C]610.110725615209[/C][/ROW]
[/TABLE]
Source: https://freestatistics.org/blog/index.php?pk=41934&T=3

Globally Unique Identifier (entire table): ba.freestatistics.org/blog/index.php?pk=41934&T=3

As an alternative you can also use a QR Code:  

The GUIDs for individual cells are displayed in the table below:

Extrapolation Forecasts of Exponential Smoothing
tForecast95% Lower Bound95% Upper Bound
73521.352649272085505.681790835391537.023507708779
74518.312034996166495.604376579365541.019693412966
75510.269215406278481.222382864873539.316047947682
76499.121552156867463.972455250068534.270649063665
77487.25068942133446.062094297472528.439284545188
78489.715823073684442.466658373058536.96498777431
79549.183184182753495.806694763435602.559673602072
80560.152280575576500.554968880954619.749592270199
81554.256252507838488.328303958905620.18420105677
82539.839752906322467.461198360502612.218307452143
83520.9544462907441.998997742049599.909894839352
84524.448257103744438.78578859228610.110725615209


Parameters (Session):
par1 = 12 ; par2 = Triple ; par3 = additive ;
Parameters (R input):
par1 = 12 ; par2 = Triple ; par3 = additive ;
R code (references can be found in the software module):
par1 <- as.numeric(par1)
if (par2 == 'Single') K <- 1
if (par2 == 'Double') K <- 2
if (par2 == 'Triple') K <- par1
nx <- length(x)
nxmK <- nx - K
x <- ts(x, frequency = par1)
if (par2 == 'Single') fit <- HoltWinters(x, gamma=0, beta=0)
if (par2 == 'Double') fit <- HoltWinters(x, gamma=0)
if (par2 == 'Triple') fit <- HoltWinters(x, seasonal=par3)
fit
myresid <- x - fit$fitted[,'xhat']
bitmap(file='test1.png')
op <- par(mfrow=c(2,1))
plot(fit,ylab='Observed (black) / Fitted (red)',main='Interpolation Fit of Exponential Smoothing')
plot(myresid,ylab='Residuals',main='Interpolation Prediction Errors')
par(op)
dev.off()
bitmap(file='test2.png')
p <- predict(fit, par1, prediction.interval=TRUE)
np <- length(p[,1])
plot(fit,p,ylab='Observed (black) / Fitted (red)',main='Extrapolation Fit of Exponential Smoothing')
dev.off()
bitmap(file='test3.png')
op <- par(mfrow = c(2,2))
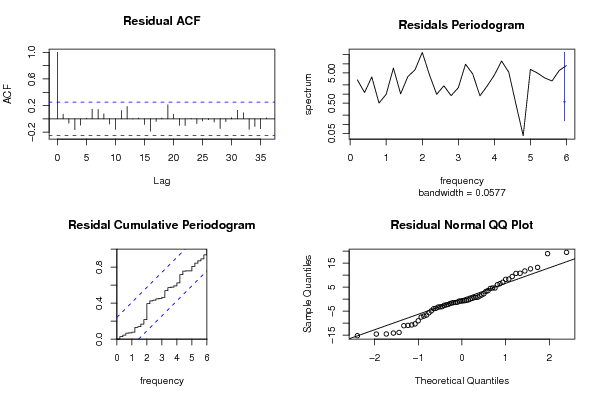
acf(as.numeric(myresid),lag.max = nx/2,main='Residual ACF')
spectrum(myresid,main='Residals Periodogram')
cpgram(myresid,main='Residal Cumulative Periodogram')
qqnorm(myresid,main='Residual Normal QQ Plot')
qqline(myresid)
par(op)
dev.off()
load(file='createtable')
a<-table.start()
a<-table.row.start(a)
a<-table.element(a,'Estimated Parameters of Exponential Smoothing',2,TRUE)
a<-table.row.end(a)
a<-table.row.start(a)
a<-table.element(a,'Parameter',header=TRUE)
a<-table.element(a,'Value',header=TRUE)
a<-table.row.end(a)
a<-table.row.start(a)
a<-table.element(a,'alpha',header=TRUE)
a<-table.element(a,fit$alpha)
a<-table.row.end(a)
a<-table.row.start(a)
a<-table.element(a,'beta',header=TRUE)
a<-table.element(a,fit$beta)
a<-table.row.end(a)
a<-table.row.start(a)
a<-table.element(a,'gamma',header=TRUE)
a<-table.element(a,fit$gamma)
a<-table.row.end(a)
a<-table.end(a)
table.save(a,file='mytable.tab')
a<-table.start()
a<-table.row.start(a)
a<-table.element(a,'Interpolation Forecasts of Exponential Smoothing',4,TRUE)
a<-table.row.end(a)
a<-table.row.start(a)
a<-table.element(a,'t',header=TRUE)
a<-table.element(a,'Observed',header=TRUE)
a<-table.element(a,'Fitted',header=TRUE)
a<-table.element(a,'Residuals',header=TRUE)
a<-table.row.end(a)
for (i in 1:nxmK) {
a<-table.row.start(a)
a<-table.element(a,i+K,header=TRUE)
a<-table.element(a,x[i+K])
a<-table.element(a,fit$fitted[i,'xhat'])
a<-table.element(a,myresid[i])
a<-table.row.end(a)
}
a<-table.end(a)
table.save(a,file='mytable1.tab')
a<-table.start()
a<-table.row.start(a)
a<-table.element(a,'Extrapolation Forecasts of Exponential Smoothing',4,TRUE)
a<-table.row.end(a)
a<-table.row.start(a)
a<-table.element(a,'t',header=TRUE)
a<-table.element(a,'Forecast',header=TRUE)
a<-table.element(a,'95% Lower Bound',header=TRUE)
a<-table.element(a,'95% Upper Bound',header=TRUE)
a<-table.row.end(a)
for (i in 1:np) {
a<-table.row.start(a)
a<-table.element(a,nx+i,header=TRUE)
a<-table.element(a,p[i,'fit'])
a<-table.element(a,p[i,'lwr'])
a<-table.element(a,p[i,'upr'])
a<-table.row.end(a)
}
a<-table.end(a)
table.save(a,file='mytable2.tab')