Free Statistics
of Irreproducible Research!
Description of Statistical Computation | |
|---|---|
| Author's title | |
| Author | *Unverified author* |
| R Software Module | Rscript (source code is shown below) |
| Title produced by software | R console |
| Date of computation | Mon, 06 Jul 2009 06:23:37 -0600 |
| Cite this page as follows | Statistical Computations at FreeStatistics.org, Office for Research Development and Education, URL https://freestatistics.org/blog/index.php?v=date/2009/Jul/06/t12468830194lvoxz72puwpqis.htm/, Retrieved Sat, 18 May 2024 18:23:52 +0000 |
| Statistical Computations at FreeStatistics.org, Office for Research Development and Education, URL https://freestatistics.org/blog/index.php?pk=42341, Retrieved Sat, 18 May 2024 18:23:52 +0000 | |
| QR Codes: | |
|
| |
| Original text written by user: | |
| IsPrivate? | No (this computation is public) |
| User-defined keywords | |
| Estimated Impact | 247 |
Tree of Dependent Computations | |
| Family? (F = Feedback message, R = changed R code, M = changed R Module, P = changed Parameters, D = changed Data) | |
| - [R console] [] [2009-07-06 12:23:37] [b768c7adc2675864c15627b87ad9ef22] [Current] | |
| Feedback Forum | |
Post a new message | |
Dataset | |
| Dataseries X: | |
1.48831666845106 0.0861917533353904 -1.40669000116739 -0.705269722491866 0.572963264260341 -0.473026853568855 -0.937169318551534 -0.438066896940391 -0.503338415617604 1.16467087186051 0.198882871993717 -0.787884273126195 -0.784209609685812 0.506649281850486 1.90684947899319 -1.25161147962116 -0.626936039672591 0.419648781398768 1.16511506316726 0.705865483475741 0.99943568577078 1.42072180379195 -0.340599405812383 1.18612719428271 0.371325146069939 -0.212545780487666 1.06172200355997 -0.239405290169461 0.716164675001318 0.290526846911998 0.238239526366919 1.32480335159744 0.786821486992703 0.444000213531062 1.08713201343149 0.554367017925343 -0.509374481807784 0.971913948955055 -0.0765447774334525 -0.0315473995832993 1.53081439939842 0.404759751010366 -0.639251373273546 0.673775343445702 0.297964522774601 0.383070168278711 -0.00207188794541372 -0.145885292784883 0.209598072820731 0.0916247437002744 -1.83196761474207 -0.700388953977938 2.30325088208894 -0.527143752240516 1.36198840308262 0.134231111330538 2.07794210594328 0.990340188218907 0.620837707825297 -0.0859504086812189 -1.05108305897369 -0.415106662193027 0.0692836959108357 1.17212983625136 -0.711709414856647 0.594084948288943 -0.399536337143537 0.902343374942135 -1.45135708457178 0.472871502086415 -0.417792663937469 -0.572838513095986 -1.07273200120520 -0.519766499597772 2.36115292254887 0.825067154141609 0.155621956518056 -0.716691498447023 0.124334984296978 0.50346277269306 -0.956869618174411 -2.31096880393893 0.0454981999235353 -0.0927824260674398 1.87171362812545 -1.08886511476867 -1.32702125741581 0.306349987172475 -0.156160549391637 1.35655786593718 -0.304390859233455 0.149726301730665 -0.876591901612862 -0.388981749596775 -0.063856384296133 0.404426841107328 0.0222428036186882 -0.869254968277859 0.498421729922922 0.0100138806149327 | |
Tables (Output of Computation) | |
> first_number = 5
> second_number = 7
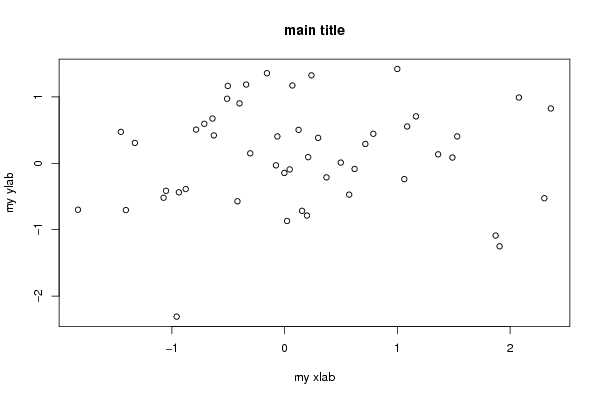
> strpar = 'main title'
> {
+ myfun <- function(x, y) {
+ x + y
+ }
+
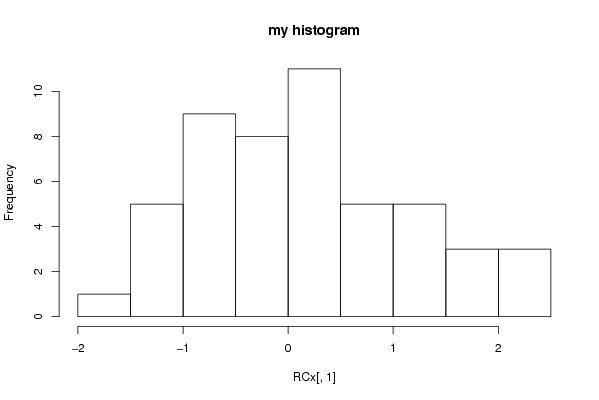
+ plot(RCx, main = strpar, xlab = 'my xlab', ylab = 'my ylab')
+ hist(R .... [TRUNCATED]
[1] 12
| |
Figures (Output of Computation) | |
Input Parameters & R Code | |
| Parameters (Session): | |
| par1 = 5 ; par2 = 7 ; par3 = maintitle ; | |
| Parameters (R input): | |
| R code (body of R function): | |
{ | |