Free Statistics
of Irreproducible Research!
Description of Statistical Computation | |
|---|---|
| Author's title | |
| Author | *The author of this computation has been verified* |
| R Software Module | Rscript (source code is shown below) |
| Title produced by software | R console |
| Date of computation | Mon, 06 Jul 2009 02:50:03 -0600 |
| Cite this page as follows | Statistical Computations at FreeStatistics.org, Office for Research Development and Education, URL https://freestatistics.org/blog/index.php?v=date/2009/Jul/06/t1246870205dca8pzlyzslfrvk.htm/, Retrieved Sat, 18 May 2024 19:54:33 +0000 |
| Statistical Computations at FreeStatistics.org, Office for Research Development and Education, URL https://freestatistics.org/blog/index.php?pk=42340, Retrieved Sat, 18 May 2024 19:54:33 +0000 | |
| QR Codes: | |
|
| |
| Original text written by user: | |
| IsPrivate? | No (this computation is public) |
| User-defined keywords | UseR1 |
| Estimated Impact | 497 |
Tree of Dependent Computations | |
| Family? (F = Feedback message, R = changed R code, M = changed R Module, P = changed Parameters, D = changed Data) | |
| - [R console] [fixed data] [2009-07-06 08:50:03] [256f657a32c6b2b7628dddcfa9a822d0] [Current] | |
| Feedback Forum | |
Post a new message | |
Dataset | |
| Dataseries X: | |
0.0327570747625087 -1.01260220468867 0.987781241007297 -0.04686368515551 -0.474607692103688 -0.0372435023825232 -0.65267620685629 1.66556682883467 -0.793109446377286 0.260668112195149 0.0379798691799828 -0.126713961770543 -0.988033040717532 -1.13892356717838 0.698356129389226 0.473905852482764 1.52639847464256 1.19509567255750 0.483207093623112 -0.71616263228264 0.172532240399714 -0.332767775256141 -1.77942226550811 0.280933038072764 -1.59985928759295 -0.96386851157488 -0.163046751374580 -0.509550010840007 -0.0396657973473913 -0.047215904716664 0.374625178584104 -0.868064513278352 0.218376443601349 1.42578684092698 1.20535360647886 -0.88641857541891 0.151825023107084 0.469020717188713 1.20920172512134 -0.858438367120121 -0.617147987437753 -0.679818808455076 -1.97640480252202 0.306796610115292 -0.708669914949992 -0.69094024459166 0.373683381584688 -1.05678473967331 2.26171741716571 0.136269491368627 0.656318769196182 0.0753170217142546 -0.121969415869606 0.694472662403023 -0.426909748125745 -0.652032963123506 0.854045289539782 -1.08203074180657 2.27516215896781 0.0922397969147141 0.0811255874698838 -1.02832762253308 0.47315799691282 0.252942383351661 0.416521691025975 -0.332033825716422 0.157178402725913 0.65209967322124 1.82776350141872 -0.0466069578496988 0.48223929277653 1.97543025615255 1.64361451247359 -0.0626231942941091 -1.39785482530121 -0.255517251868797 0.68451999913387 -0.685561128230648 0.718010132097075 -0.755568515416094 0.349584849123974 1.13238864964424 -1.88232090271429 -0.219948548041295 3.57190376498993 -0.40498378580955 -0.135842694878130 0.175801072368785 1.31572308195919 -1.70318731620686 0.85127822674266 0.262634033569135 0.887517786065176 -0.882628702052537 0.458756039665809 0.751373325045599 1.13027361770289 0.212907821128133 -0.708516781545271 0.899414776157957 | |
Tables (Output of Computation) | |
> first_number = 5
> second_number = 7
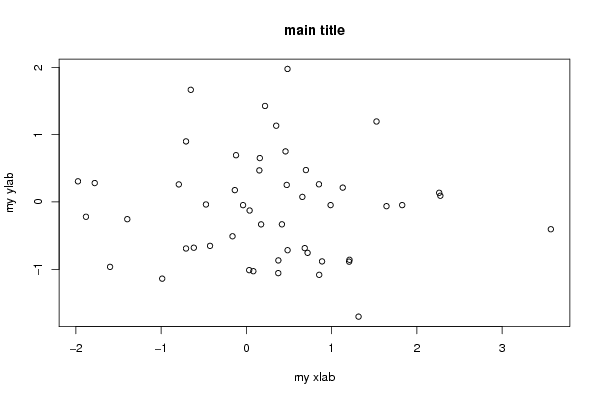
> strpar = 'main title'
> {
+ myfun <- function(x, y) {
+ x + y
+ }
+
+ plot(RCx, main = strpar, xlab = 'my xlab', ylab = 'my ylab')
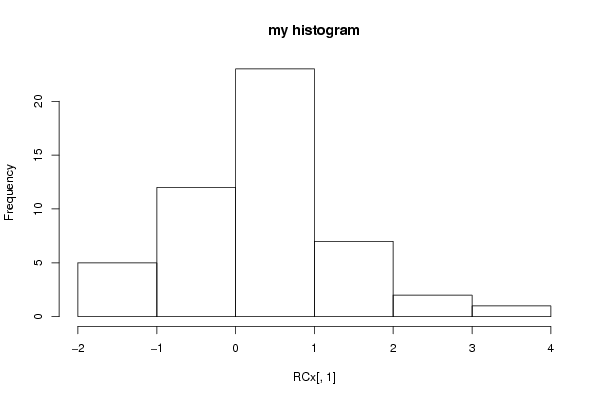
+ hist(R .... [TRUNCATED]
[1] 12
| |
Figures (Output of Computation) | |
Input Parameters & R Code | |
| Parameters (Session): | |
| par1 = 5 ; par2 = 7 ; par3 = "maintitle" ; | |
| Parameters (R input): | |
| R code (body of R function): | |
{ | |