Free Statistics

of Irreproducible Research!

Author's title

Author*Unverified author*
R Software Modulerwasp_exponentialsmoothing.wasp
Title produced by softwareExponential Smoothing
Date of computationFri, 16 Jan 2009 06:48:19 -0700
Cite this page as followsStatistical Computations at FreeStatistics.org, Office for Research Development and Education, URL https://freestatistics.org/blog/index.php?v=date/2009/Jan/16/t1232113770orf27siotmr02kt.htm/, Retrieved Sun, 05 May 2024 08:41:18 +0000
Statistical Computations at FreeStatistics.org, Office for Research Development and Education, URL https://freestatistics.org/blog/index.php?pk=36916, Retrieved Sun, 05 May 2024 08:41:18 +0000
QR Codes:

Original text written by user:
IsPrivate?No (this computation is public)
User-defined keywords
Estimated Impact210
Family? (F = Feedback message, R = changed R code, M = changed R Module, P = changed Parameters, D = changed Data)
-       [Exponential Smoothing] [Opgave 10-oefenin...] [2009-01-16 13:48:19] [d41d8cd98f00b204e9800998ecf8427e] [Current]
Feedback Forum

Post a new message
Dataseries X:
113,9000
112,0000
113,8500
113,0800
111,7200
110,6900
113,5300
113,9900
112,7400
112,1500
115,8200
118,3800
118,8100
123,8500
117,9600
120,1600
118,7400
119,8400
124,8100
121,3300
120,2000
118,3200
129,5800
130,2000
127,1900
133,1000
129,1200
123,2800
123,3600
124,1300
126,9700
127,1400
123,7000
123,6700
130,1900
134,0100
124,9600
129,9600
128,3200
132,3800
126,2500
128,9100
131,4200
129,4400
126,8600
126,7100
131,6300
132,7800
126,6100
132,8400
123,1400
128,1300
125,4900
126,4800
130,8600
127,3200
126,5600
126,6400
129,2600
126,4700
135,4000
135,5000
132,2200
122,6200
125,1600
128,5000
133,8600
128,8700
125,0700
125,2500
132,1600
130,2400


Summary of computational transaction
Raw Inputview raw input (R code)
Raw Outputview raw output of R engine
Computing time1 seconds
R Server'Gwilym Jenkins' @ 72.249.127.135

\begin{tabular}{lllllllll}
\hline
Summary of computational transaction \tabularnewline
Raw Input & view raw input (R code)  \tabularnewline
Raw Output & view raw output of R engine  \tabularnewline
Computing time & 1 seconds \tabularnewline
R Server & 'Gwilym Jenkins' @ 72.249.127.135 \tabularnewline
\hline
\end{tabular}
%Source: https://freestatistics.org/blog/index.php?pk=36916&T=0

[TABLE]
[ROW][C]Summary of computational transaction[/C][/ROW]
[ROW][C]Raw Input[/C][C]view raw input (R code) [/C][/ROW]
[ROW][C]Raw Output[/C][C]view raw output of R engine [/C][/ROW]
[ROW][C]Computing time[/C][C]1 seconds[/C][/ROW]
[ROW][C]R Server[/C][C]'Gwilym Jenkins' @ 72.249.127.135[/C][/ROW]
[/TABLE]
Source: https://freestatistics.org/blog/index.php?pk=36916&T=0

Globally Unique Identifier (entire table): ba.freestatistics.org/blog/index.php?pk=36916&T=0

As an alternative you can also use a QR Code:  

The GUIDs for individual cells are displayed in the table below:

Summary of computational transaction
Raw Inputview raw input (R code)
Raw Outputview raw output of R engine
Computing time1 seconds
R Server'Gwilym Jenkins' @ 72.249.127.135


Estimated Parameters of Exponential Smoothing
ParameterValue
alpha0.300229450194369
beta0.106520029572451
gamma0.101170257297618

\begin{tabular}{lllllllll}
\hline
Estimated Parameters of Exponential Smoothing \tabularnewline
Parameter & Value \tabularnewline
alpha & 0.300229450194369 \tabularnewline
beta & 0.106520029572451 \tabularnewline
gamma & 0.101170257297618 \tabularnewline
\hline
\end{tabular}
%Source: https://freestatistics.org/blog/index.php?pk=36916&T=1

[TABLE]
[ROW][C]Estimated Parameters of Exponential Smoothing[/C][/ROW]
[ROW][C]Parameter[/C][C]Value[/C][/ROW]
[ROW][C]alpha[/C][C]0.300229450194369[/C][/ROW]
[ROW][C]beta[/C][C]0.106520029572451[/C][/ROW]
[ROW][C]gamma[/C][C]0.101170257297618[/C][/ROW]
[/TABLE]
Source: https://freestatistics.org/blog/index.php?pk=36916&T=1

Globally Unique Identifier (entire table): ba.freestatistics.org/blog/index.php?pk=36916&T=1

As an alternative you can also use a QR Code:  

The GUIDs for individual cells are displayed in the table below:

Estimated Parameters of Exponential Smoothing
ParameterValue
alpha0.300229450194369
beta0.106520029572451
gamma0.101170257297618


Interpolation Forecasts of Exponential Smoothing
tObservedFittedResiduals
13118.81114.9091319444443.90086805555555
14123.85121.1585427193922.69145728060776
15117.96116.3600934437411.59990655625897
16120.16119.4238442257480.736155774252396
17118.74118.3693141782340.370685821765790
18119.84119.5014973205130.338502679486993
19124.81122.0894269372.72057306299986
20121.33123.752446052297-2.42244605229679
21120.2122.117241784959-1.91724178495919
22118.32121.431150462165-3.11115046216479
23129.58124.4258666021035.15413339789714
24130.2128.8706458760251.32935412397472
25127.19130.178292838869-2.98829283886914
26133.1134.417717615868-1.31771761586847
27129.12128.3540677542330.76593224576726
28123.28131.095363119880-7.81536311987963
29123.36127.163138340085-3.8031383400846
30124.13126.622054219994-2.49205421999356
31126.97128.020401894517-1.05040189451685
32127.14127.558154410962-0.418154410962174
33123.7125.995558242714-2.29555824271407
34123.67124.534356825636-0.864356825636392
35130.19128.2836243816331.90637561836684
36134.01130.8735364604073.13646353959291
37124.96131.866835354631-6.90683535463147
38129.96134.371527956692-4.41152795669197
39128.32126.7510573792201.56894262077978
40132.38128.3761178973154.00388210268454
41126.25127.904611612568-1.65461161256836
42128.91127.7982924783151.11170752168466
43131.42130.1928031710651.22719682893498
44129.44130.344101545671-0.904101545671466
45126.86128.372139383371-1.51213938337112
46126.71127.141963020923-0.431963020923078
47131.63131.1255291146140.504470885386155
48132.78133.245124327386-0.465124327385752
49126.61132.194405981146-5.58440598114551
50132.84135.06339096987-2.22339096986991
51123.14128.383836801113-5.2438368011134
52128.13127.7785884912920.351411508707585
53125.49125.3358010815010.154198918499262
54126.48125.5521275952020.927872404798052
55130.86127.4774858390173.38251416098306
56127.32127.771778730716-0.451778730716228
57126.56125.5538281671391.00617183286083
58126.64124.8979894470361.74201055296376
59129.26129.411861148902-0.151861148902071
60126.47131.056091905674-4.58609190567375
61135.4128.0642520191387.3357479808623
62135.5135.1219251541860.378074845814041
63132.22129.164499421583.05550057841987
64122.62131.867421332597-9.24742133259656
65125.16126.642188477594-1.48218847759372
66128.5126.4830325773612.0169674226385
67133.86129.0050140160074.85498598399315
68128.87129.612890214242-0.742890214242038
69125.07127.544402925246-2.47440292524621
70125.25125.918023721728-0.668023721728304
71132.16129.5195158493842.64048415061600
72130.24131.722727875470-1.48272787546981

\begin{tabular}{lllllllll}
\hline
Interpolation Forecasts of Exponential Smoothing \tabularnewline
t & Observed & Fitted & Residuals \tabularnewline
13 & 118.81 & 114.909131944444 & 3.90086805555555 \tabularnewline
14 & 123.85 & 121.158542719392 & 2.69145728060776 \tabularnewline
15 & 117.96 & 116.360093443741 & 1.59990655625897 \tabularnewline
16 & 120.16 & 119.423844225748 & 0.736155774252396 \tabularnewline
17 & 118.74 & 118.369314178234 & 0.370685821765790 \tabularnewline
18 & 119.84 & 119.501497320513 & 0.338502679486993 \tabularnewline
19 & 124.81 & 122.089426937 & 2.72057306299986 \tabularnewline
20 & 121.33 & 123.752446052297 & -2.42244605229679 \tabularnewline
21 & 120.2 & 122.117241784959 & -1.91724178495919 \tabularnewline
22 & 118.32 & 121.431150462165 & -3.11115046216479 \tabularnewline
23 & 129.58 & 124.425866602103 & 5.15413339789714 \tabularnewline
24 & 130.2 & 128.870645876025 & 1.32935412397472 \tabularnewline
25 & 127.19 & 130.178292838869 & -2.98829283886914 \tabularnewline
26 & 133.1 & 134.417717615868 & -1.31771761586847 \tabularnewline
27 & 129.12 & 128.354067754233 & 0.76593224576726 \tabularnewline
28 & 123.28 & 131.095363119880 & -7.81536311987963 \tabularnewline
29 & 123.36 & 127.163138340085 & -3.8031383400846 \tabularnewline
30 & 124.13 & 126.622054219994 & -2.49205421999356 \tabularnewline
31 & 126.97 & 128.020401894517 & -1.05040189451685 \tabularnewline
32 & 127.14 & 127.558154410962 & -0.418154410962174 \tabularnewline
33 & 123.7 & 125.995558242714 & -2.29555824271407 \tabularnewline
34 & 123.67 & 124.534356825636 & -0.864356825636392 \tabularnewline
35 & 130.19 & 128.283624381633 & 1.90637561836684 \tabularnewline
36 & 134.01 & 130.873536460407 & 3.13646353959291 \tabularnewline
37 & 124.96 & 131.866835354631 & -6.90683535463147 \tabularnewline
38 & 129.96 & 134.371527956692 & -4.41152795669197 \tabularnewline
39 & 128.32 & 126.751057379220 & 1.56894262077978 \tabularnewline
40 & 132.38 & 128.376117897315 & 4.00388210268454 \tabularnewline
41 & 126.25 & 127.904611612568 & -1.65461161256836 \tabularnewline
42 & 128.91 & 127.798292478315 & 1.11170752168466 \tabularnewline
43 & 131.42 & 130.192803171065 & 1.22719682893498 \tabularnewline
44 & 129.44 & 130.344101545671 & -0.904101545671466 \tabularnewline
45 & 126.86 & 128.372139383371 & -1.51213938337112 \tabularnewline
46 & 126.71 & 127.141963020923 & -0.431963020923078 \tabularnewline
47 & 131.63 & 131.125529114614 & 0.504470885386155 \tabularnewline
48 & 132.78 & 133.245124327386 & -0.465124327385752 \tabularnewline
49 & 126.61 & 132.194405981146 & -5.58440598114551 \tabularnewline
50 & 132.84 & 135.06339096987 & -2.22339096986991 \tabularnewline
51 & 123.14 & 128.383836801113 & -5.2438368011134 \tabularnewline
52 & 128.13 & 127.778588491292 & 0.351411508707585 \tabularnewline
53 & 125.49 & 125.335801081501 & 0.154198918499262 \tabularnewline
54 & 126.48 & 125.552127595202 & 0.927872404798052 \tabularnewline
55 & 130.86 & 127.477485839017 & 3.38251416098306 \tabularnewline
56 & 127.32 & 127.771778730716 & -0.451778730716228 \tabularnewline
57 & 126.56 & 125.553828167139 & 1.00617183286083 \tabularnewline
58 & 126.64 & 124.897989447036 & 1.74201055296376 \tabularnewline
59 & 129.26 & 129.411861148902 & -0.151861148902071 \tabularnewline
60 & 126.47 & 131.056091905674 & -4.58609190567375 \tabularnewline
61 & 135.4 & 128.064252019138 & 7.3357479808623 \tabularnewline
62 & 135.5 & 135.121925154186 & 0.378074845814041 \tabularnewline
63 & 132.22 & 129.16449942158 & 3.05550057841987 \tabularnewline
64 & 122.62 & 131.867421332597 & -9.24742133259656 \tabularnewline
65 & 125.16 & 126.642188477594 & -1.48218847759372 \tabularnewline
66 & 128.5 & 126.483032577361 & 2.0169674226385 \tabularnewline
67 & 133.86 & 129.005014016007 & 4.85498598399315 \tabularnewline
68 & 128.87 & 129.612890214242 & -0.742890214242038 \tabularnewline
69 & 125.07 & 127.544402925246 & -2.47440292524621 \tabularnewline
70 & 125.25 & 125.918023721728 & -0.668023721728304 \tabularnewline
71 & 132.16 & 129.519515849384 & 2.64048415061600 \tabularnewline
72 & 130.24 & 131.722727875470 & -1.48272787546981 \tabularnewline
\hline
\end{tabular}
%Source: https://freestatistics.org/blog/index.php?pk=36916&T=2

[TABLE]
[ROW][C]Interpolation Forecasts of Exponential Smoothing[/C][/ROW]
[ROW][C]t[/C][C]Observed[/C][C]Fitted[/C][C]Residuals[/C][/ROW]
[ROW][C]13[/C][C]118.81[/C][C]114.909131944444[/C][C]3.90086805555555[/C][/ROW]
[ROW][C]14[/C][C]123.85[/C][C]121.158542719392[/C][C]2.69145728060776[/C][/ROW]
[ROW][C]15[/C][C]117.96[/C][C]116.360093443741[/C][C]1.59990655625897[/C][/ROW]
[ROW][C]16[/C][C]120.16[/C][C]119.423844225748[/C][C]0.736155774252396[/C][/ROW]
[ROW][C]17[/C][C]118.74[/C][C]118.369314178234[/C][C]0.370685821765790[/C][/ROW]
[ROW][C]18[/C][C]119.84[/C][C]119.501497320513[/C][C]0.338502679486993[/C][/ROW]
[ROW][C]19[/C][C]124.81[/C][C]122.089426937[/C][C]2.72057306299986[/C][/ROW]
[ROW][C]20[/C][C]121.33[/C][C]123.752446052297[/C][C]-2.42244605229679[/C][/ROW]
[ROW][C]21[/C][C]120.2[/C][C]122.117241784959[/C][C]-1.91724178495919[/C][/ROW]
[ROW][C]22[/C][C]118.32[/C][C]121.431150462165[/C][C]-3.11115046216479[/C][/ROW]
[ROW][C]23[/C][C]129.58[/C][C]124.425866602103[/C][C]5.15413339789714[/C][/ROW]
[ROW][C]24[/C][C]130.2[/C][C]128.870645876025[/C][C]1.32935412397472[/C][/ROW]
[ROW][C]25[/C][C]127.19[/C][C]130.178292838869[/C][C]-2.98829283886914[/C][/ROW]
[ROW][C]26[/C][C]133.1[/C][C]134.417717615868[/C][C]-1.31771761586847[/C][/ROW]
[ROW][C]27[/C][C]129.12[/C][C]128.354067754233[/C][C]0.76593224576726[/C][/ROW]
[ROW][C]28[/C][C]123.28[/C][C]131.095363119880[/C][C]-7.81536311987963[/C][/ROW]
[ROW][C]29[/C][C]123.36[/C][C]127.163138340085[/C][C]-3.8031383400846[/C][/ROW]
[ROW][C]30[/C][C]124.13[/C][C]126.622054219994[/C][C]-2.49205421999356[/C][/ROW]
[ROW][C]31[/C][C]126.97[/C][C]128.020401894517[/C][C]-1.05040189451685[/C][/ROW]
[ROW][C]32[/C][C]127.14[/C][C]127.558154410962[/C][C]-0.418154410962174[/C][/ROW]
[ROW][C]33[/C][C]123.7[/C][C]125.995558242714[/C][C]-2.29555824271407[/C][/ROW]
[ROW][C]34[/C][C]123.67[/C][C]124.534356825636[/C][C]-0.864356825636392[/C][/ROW]
[ROW][C]35[/C][C]130.19[/C][C]128.283624381633[/C][C]1.90637561836684[/C][/ROW]
[ROW][C]36[/C][C]134.01[/C][C]130.873536460407[/C][C]3.13646353959291[/C][/ROW]
[ROW][C]37[/C][C]124.96[/C][C]131.866835354631[/C][C]-6.90683535463147[/C][/ROW]
[ROW][C]38[/C][C]129.96[/C][C]134.371527956692[/C][C]-4.41152795669197[/C][/ROW]
[ROW][C]39[/C][C]128.32[/C][C]126.751057379220[/C][C]1.56894262077978[/C][/ROW]
[ROW][C]40[/C][C]132.38[/C][C]128.376117897315[/C][C]4.00388210268454[/C][/ROW]
[ROW][C]41[/C][C]126.25[/C][C]127.904611612568[/C][C]-1.65461161256836[/C][/ROW]
[ROW][C]42[/C][C]128.91[/C][C]127.798292478315[/C][C]1.11170752168466[/C][/ROW]
[ROW][C]43[/C][C]131.42[/C][C]130.192803171065[/C][C]1.22719682893498[/C][/ROW]
[ROW][C]44[/C][C]129.44[/C][C]130.344101545671[/C][C]-0.904101545671466[/C][/ROW]
[ROW][C]45[/C][C]126.86[/C][C]128.372139383371[/C][C]-1.51213938337112[/C][/ROW]
[ROW][C]46[/C][C]126.71[/C][C]127.141963020923[/C][C]-0.431963020923078[/C][/ROW]
[ROW][C]47[/C][C]131.63[/C][C]131.125529114614[/C][C]0.504470885386155[/C][/ROW]
[ROW][C]48[/C][C]132.78[/C][C]133.245124327386[/C][C]-0.465124327385752[/C][/ROW]
[ROW][C]49[/C][C]126.61[/C][C]132.194405981146[/C][C]-5.58440598114551[/C][/ROW]
[ROW][C]50[/C][C]132.84[/C][C]135.06339096987[/C][C]-2.22339096986991[/C][/ROW]
[ROW][C]51[/C][C]123.14[/C][C]128.383836801113[/C][C]-5.2438368011134[/C][/ROW]
[ROW][C]52[/C][C]128.13[/C][C]127.778588491292[/C][C]0.351411508707585[/C][/ROW]
[ROW][C]53[/C][C]125.49[/C][C]125.335801081501[/C][C]0.154198918499262[/C][/ROW]
[ROW][C]54[/C][C]126.48[/C][C]125.552127595202[/C][C]0.927872404798052[/C][/ROW]
[ROW][C]55[/C][C]130.86[/C][C]127.477485839017[/C][C]3.38251416098306[/C][/ROW]
[ROW][C]56[/C][C]127.32[/C][C]127.771778730716[/C][C]-0.451778730716228[/C][/ROW]
[ROW][C]57[/C][C]126.56[/C][C]125.553828167139[/C][C]1.00617183286083[/C][/ROW]
[ROW][C]58[/C][C]126.64[/C][C]124.897989447036[/C][C]1.74201055296376[/C][/ROW]
[ROW][C]59[/C][C]129.26[/C][C]129.411861148902[/C][C]-0.151861148902071[/C][/ROW]
[ROW][C]60[/C][C]126.47[/C][C]131.056091905674[/C][C]-4.58609190567375[/C][/ROW]
[ROW][C]61[/C][C]135.4[/C][C]128.064252019138[/C][C]7.3357479808623[/C][/ROW]
[ROW][C]62[/C][C]135.5[/C][C]135.121925154186[/C][C]0.378074845814041[/C][/ROW]
[ROW][C]63[/C][C]132.22[/C][C]129.16449942158[/C][C]3.05550057841987[/C][/ROW]
[ROW][C]64[/C][C]122.62[/C][C]131.867421332597[/C][C]-9.24742133259656[/C][/ROW]
[ROW][C]65[/C][C]125.16[/C][C]126.642188477594[/C][C]-1.48218847759372[/C][/ROW]
[ROW][C]66[/C][C]128.5[/C][C]126.483032577361[/C][C]2.0169674226385[/C][/ROW]
[ROW][C]67[/C][C]133.86[/C][C]129.005014016007[/C][C]4.85498598399315[/C][/ROW]
[ROW][C]68[/C][C]128.87[/C][C]129.612890214242[/C][C]-0.742890214242038[/C][/ROW]
[ROW][C]69[/C][C]125.07[/C][C]127.544402925246[/C][C]-2.47440292524621[/C][/ROW]
[ROW][C]70[/C][C]125.25[/C][C]125.918023721728[/C][C]-0.668023721728304[/C][/ROW]
[ROW][C]71[/C][C]132.16[/C][C]129.519515849384[/C][C]2.64048415061600[/C][/ROW]
[ROW][C]72[/C][C]130.24[/C][C]131.722727875470[/C][C]-1.48272787546981[/C][/ROW]
[/TABLE]
Source: https://freestatistics.org/blog/index.php?pk=36916&T=2

Globally Unique Identifier (entire table): ba.freestatistics.org/blog/index.php?pk=36916&T=2

As an alternative you can also use a QR Code:  

The GUIDs for individual cells are displayed in the table below:

Interpolation Forecasts of Exponential Smoothing
tObservedFittedResiduals
13118.81114.9091319444443.90086805555555
14123.85121.1585427193922.69145728060776
15117.96116.3600934437411.59990655625897
16120.16119.4238442257480.736155774252396
17118.74118.3693141782340.370685821765790
18119.84119.5014973205130.338502679486993
19124.81122.0894269372.72057306299986
20121.33123.752446052297-2.42244605229679
21120.2122.117241784959-1.91724178495919
22118.32121.431150462165-3.11115046216479
23129.58124.4258666021035.15413339789714
24130.2128.8706458760251.32935412397472
25127.19130.178292838869-2.98829283886914
26133.1134.417717615868-1.31771761586847
27129.12128.3540677542330.76593224576726
28123.28131.095363119880-7.81536311987963
29123.36127.163138340085-3.8031383400846
30124.13126.622054219994-2.49205421999356
31126.97128.020401894517-1.05040189451685
32127.14127.558154410962-0.418154410962174
33123.7125.995558242714-2.29555824271407
34123.67124.534356825636-0.864356825636392
35130.19128.2836243816331.90637561836684
36134.01130.8735364604073.13646353959291
37124.96131.866835354631-6.90683535463147
38129.96134.371527956692-4.41152795669197
39128.32126.7510573792201.56894262077978
40132.38128.3761178973154.00388210268454
41126.25127.904611612568-1.65461161256836
42128.91127.7982924783151.11170752168466
43131.42130.1928031710651.22719682893498
44129.44130.344101545671-0.904101545671466
45126.86128.372139383371-1.51213938337112
46126.71127.141963020923-0.431963020923078
47131.63131.1255291146140.504470885386155
48132.78133.245124327386-0.465124327385752
49126.61132.194405981146-5.58440598114551
50132.84135.06339096987-2.22339096986991
51123.14128.383836801113-5.2438368011134
52128.13127.7785884912920.351411508707585
53125.49125.3358010815010.154198918499262
54126.48125.5521275952020.927872404798052
55130.86127.4774858390173.38251416098306
56127.32127.771778730716-0.451778730716228
57126.56125.5538281671391.00617183286083
58126.64124.8979894470361.74201055296376
59129.26129.411861148902-0.151861148902071
60126.47131.056091905674-4.58609190567375
61135.4128.0642520191387.3357479808623
62135.5135.1219251541860.378074845814041
63132.22129.164499421583.05550057841987
64122.62131.867421332597-9.24742133259656
65125.16126.642188477594-1.48218847759372
66128.5126.4830325773612.0169674226385
67133.86129.0050140160074.85498598399315
68128.87129.612890214242-0.742890214242038
69125.07127.544402925246-2.47440292524621
70125.25125.918023721728-0.668023721728304
71132.16129.5195158493842.64048415061600
72130.24131.722727875470-1.48272787546981


Extrapolation Forecasts of Exponential Smoothing
tForecast95% Lower Bound95% Upper Bound
73130.640437049224124.500772182621136.780101915827
74134.902336491291128.432739348052141.371933634530
75128.908070579365122.062969181734135.753171976996
76129.612045781185122.347627802425136.876463759946
77127.798046806868120.072643288183135.523450325553
78128.464153209514120.23841360357136.689892815458
79130.649537916387121.886452144992139.412623687781
80129.316268671027119.981087575066138.651449766989
81127.284764135178117.344859724704137.224668545653
82126.544819790573115.969515583432137.120123997713
83130.618126892226119.378518789680141.857734994772
84131.689262728196119.758043200548143.620482255845

\begin{tabular}{lllllllll}
\hline
Extrapolation Forecasts of Exponential Smoothing \tabularnewline
t & Forecast & 95% Lower Bound & 95% Upper Bound \tabularnewline
73 & 130.640437049224 & 124.500772182621 & 136.780101915827 \tabularnewline
74 & 134.902336491291 & 128.432739348052 & 141.371933634530 \tabularnewline
75 & 128.908070579365 & 122.062969181734 & 135.753171976996 \tabularnewline
76 & 129.612045781185 & 122.347627802425 & 136.876463759946 \tabularnewline
77 & 127.798046806868 & 120.072643288183 & 135.523450325553 \tabularnewline
78 & 128.464153209514 & 120.23841360357 & 136.689892815458 \tabularnewline
79 & 130.649537916387 & 121.886452144992 & 139.412623687781 \tabularnewline
80 & 129.316268671027 & 119.981087575066 & 138.651449766989 \tabularnewline
81 & 127.284764135178 & 117.344859724704 & 137.224668545653 \tabularnewline
82 & 126.544819790573 & 115.969515583432 & 137.120123997713 \tabularnewline
83 & 130.618126892226 & 119.378518789680 & 141.857734994772 \tabularnewline
84 & 131.689262728196 & 119.758043200548 & 143.620482255845 \tabularnewline
\hline
\end{tabular}
%Source: https://freestatistics.org/blog/index.php?pk=36916&T=3

[TABLE]
[ROW][C]Extrapolation Forecasts of Exponential Smoothing[/C][/ROW]
[ROW][C]t[/C][C]Forecast[/C][C]95% Lower Bound[/C][C]95% Upper Bound[/C][/ROW]
[ROW][C]73[/C][C]130.640437049224[/C][C]124.500772182621[/C][C]136.780101915827[/C][/ROW]
[ROW][C]74[/C][C]134.902336491291[/C][C]128.432739348052[/C][C]141.371933634530[/C][/ROW]
[ROW][C]75[/C][C]128.908070579365[/C][C]122.062969181734[/C][C]135.753171976996[/C][/ROW]
[ROW][C]76[/C][C]129.612045781185[/C][C]122.347627802425[/C][C]136.876463759946[/C][/ROW]
[ROW][C]77[/C][C]127.798046806868[/C][C]120.072643288183[/C][C]135.523450325553[/C][/ROW]
[ROW][C]78[/C][C]128.464153209514[/C][C]120.23841360357[/C][C]136.689892815458[/C][/ROW]
[ROW][C]79[/C][C]130.649537916387[/C][C]121.886452144992[/C][C]139.412623687781[/C][/ROW]
[ROW][C]80[/C][C]129.316268671027[/C][C]119.981087575066[/C][C]138.651449766989[/C][/ROW]
[ROW][C]81[/C][C]127.284764135178[/C][C]117.344859724704[/C][C]137.224668545653[/C][/ROW]
[ROW][C]82[/C][C]126.544819790573[/C][C]115.969515583432[/C][C]137.120123997713[/C][/ROW]
[ROW][C]83[/C][C]130.618126892226[/C][C]119.378518789680[/C][C]141.857734994772[/C][/ROW]
[ROW][C]84[/C][C]131.689262728196[/C][C]119.758043200548[/C][C]143.620482255845[/C][/ROW]
[/TABLE]
Source: https://freestatistics.org/blog/index.php?pk=36916&T=3

Globally Unique Identifier (entire table): ba.freestatistics.org/blog/index.php?pk=36916&T=3

As an alternative you can also use a QR Code:  

The GUIDs for individual cells are displayed in the table below:

Extrapolation Forecasts of Exponential Smoothing
tForecast95% Lower Bound95% Upper Bound
73130.640437049224124.500772182621136.780101915827
74134.902336491291128.432739348052141.371933634530
75128.908070579365122.062969181734135.753171976996
76129.612045781185122.347627802425136.876463759946
77127.798046806868120.072643288183135.523450325553
78128.464153209514120.23841360357136.689892815458
79130.649537916387121.886452144992139.412623687781
80129.316268671027119.981087575066138.651449766989
81127.284764135178117.344859724704137.224668545653
82126.544819790573115.969515583432137.120123997713
83130.618126892226119.378518789680141.857734994772
84131.689262728196119.758043200548143.620482255845


Parameters (Session):
par1 = 12 ; par2 = Triple ; par3 = additive ;
Parameters (R input):
par1 = 12 ; par2 = Triple ; par3 = additive ;
R code (references can be found in the software module):
par1 <- as.numeric(par1)
if (par2 == 'Single') K <- 1
if (par2 == 'Double') K <- 2
if (par2 == 'Triple') K <- par1
nx <- length(x)
nxmK <- nx - K
x <- ts(x, frequency = par1)
if (par2 == 'Single') fit <- HoltWinters(x, gamma=0, beta=0)
if (par2 == 'Double') fit <- HoltWinters(x, gamma=0)
if (par2 == 'Triple') fit <- HoltWinters(x, seasonal=par3)
fit
myresid <- x - fit$fitted[,'xhat']
bitmap(file='test1.png')
op <- par(mfrow=c(2,1))
plot(fit,ylab='Observed (black) / Fitted (red)',main='Interpolation Fit of Exponential Smoothing')
plot(myresid,ylab='Residuals',main='Interpolation Prediction Errors')
par(op)
dev.off()
bitmap(file='test2.png')
p <- predict(fit, par1, prediction.interval=TRUE)
np <- length(p[,1])
plot(fit,p,ylab='Observed (black) / Fitted (red)',main='Extrapolation Fit of Exponential Smoothing')
dev.off()
bitmap(file='test3.png')
op <- par(mfrow = c(2,2))
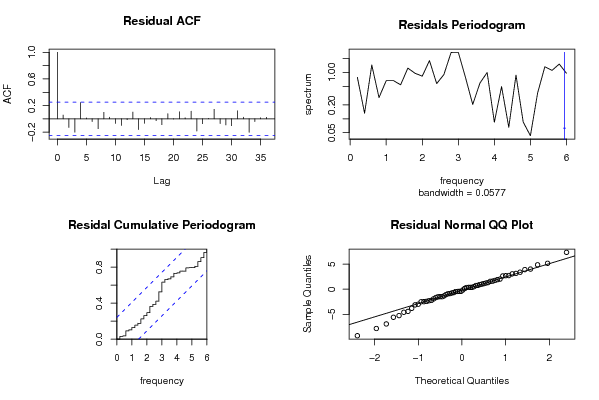
acf(as.numeric(myresid),lag.max = nx/2,main='Residual ACF')
spectrum(myresid,main='Residals Periodogram')
cpgram(myresid,main='Residal Cumulative Periodogram')
qqnorm(myresid,main='Residual Normal QQ Plot')
qqline(myresid)
par(op)
dev.off()
load(file='createtable')
a<-table.start()
a<-table.row.start(a)
a<-table.element(a,'Estimated Parameters of Exponential Smoothing',2,TRUE)
a<-table.row.end(a)
a<-table.row.start(a)
a<-table.element(a,'Parameter',header=TRUE)
a<-table.element(a,'Value',header=TRUE)
a<-table.row.end(a)
a<-table.row.start(a)
a<-table.element(a,'alpha',header=TRUE)
a<-table.element(a,fit$alpha)
a<-table.row.end(a)
a<-table.row.start(a)
a<-table.element(a,'beta',header=TRUE)
a<-table.element(a,fit$beta)
a<-table.row.end(a)
a<-table.row.start(a)
a<-table.element(a,'gamma',header=TRUE)
a<-table.element(a,fit$gamma)
a<-table.row.end(a)
a<-table.end(a)
table.save(a,file='mytable.tab')
a<-table.start()
a<-table.row.start(a)
a<-table.element(a,'Interpolation Forecasts of Exponential Smoothing',4,TRUE)
a<-table.row.end(a)
a<-table.row.start(a)
a<-table.element(a,'t',header=TRUE)
a<-table.element(a,'Observed',header=TRUE)
a<-table.element(a,'Fitted',header=TRUE)
a<-table.element(a,'Residuals',header=TRUE)
a<-table.row.end(a)
for (i in 1:nxmK) {
a<-table.row.start(a)
a<-table.element(a,i+K,header=TRUE)
a<-table.element(a,x[i+K])
a<-table.element(a,fit$fitted[i,'xhat'])
a<-table.element(a,myresid[i])
a<-table.row.end(a)
}
a<-table.end(a)
table.save(a,file='mytable1.tab')
a<-table.start()
a<-table.row.start(a)
a<-table.element(a,'Extrapolation Forecasts of Exponential Smoothing',4,TRUE)
a<-table.row.end(a)
a<-table.row.start(a)
a<-table.element(a,'t',header=TRUE)
a<-table.element(a,'Forecast',header=TRUE)
a<-table.element(a,'95% Lower Bound',header=TRUE)
a<-table.element(a,'95% Upper Bound',header=TRUE)
a<-table.row.end(a)
for (i in 1:np) {
a<-table.row.start(a)
a<-table.element(a,nx+i,header=TRUE)
a<-table.element(a,p[i,'fit'])
a<-table.element(a,p[i,'lwr'])
a<-table.element(a,p[i,'upr'])
a<-table.row.end(a)
}
a<-table.end(a)
table.save(a,file='mytable2.tab')