Free Statistics

of Irreproducible Research!

Author's title

Author*Unverified author*
R Software Modulerwasp_autocorrelation.wasp
Title produced by software(Partial) Autocorrelation Function
Date of computationWed, 30 Dec 2009 15:33:53 -0700
Cite this page as followsStatistical Computations at FreeStatistics.org, Office for Research Development and Education, URL https://freestatistics.org/blog/index.php?v=date/2009/Dec/30/t1262212556h1gcnmcm5hcs5yc.htm/, Retrieved Mon, 29 Apr 2024 07:34:32 +0000
Statistical Computations at FreeStatistics.org, Office for Research Development and Education, URL https://freestatistics.org/blog/index.php?pk=71388, Retrieved Mon, 29 Apr 2024 07:34:32 +0000
QR Codes:

Original text written by user:
IsPrivate?No (this computation is public)
User-defined keywords
Estimated Impact113
Family? (F = Feedback message, R = changed R code, M = changed R Module, P = changed Parameters, D = changed Data)
-       [(Partial) Autocorrelation Function] [paper ACF] [2009-12-30 22:33:53] [3ebad5d90a5c8606f133189c73066208] [Current]
Feedback Forum

Post a new message
Dataseries X:
1,2991
1,3408
1,3119
1,3014
1,3201
1,2938
1,2694
1,2165
1,2037
1,2292
1,2256
1,2015
1,1786
1,1856
1,2103
1,1938
1,202
1,2271
1,277
1,265
1,2684
1,2811
1,2727
1,2611
1,2881
1,3213
1,2999
1,3074
1,3242
1,3516
1,3511
1,3419
1,3716
1,3622
1,3896
1,4227
1,4684
1,457
1,4718
1,4748
1,5527
1,575
1,5557
1,5553
1,577
1,4975
1,4369
1,3322
1,2732
1,3449
1,3239
1,2785
1,305
1,319
1,365
1,4016
1,4088
1,4268
1,4562
1,4816
1,4914


Summary of computational transaction
Raw Inputview raw input (R code)
Raw Outputview raw output of R engine
Computing time1 seconds
R Server'Gwilym Jenkins' @ 72.249.127.135

\begin{tabular}{lllllllll}
\hline
Summary of computational transaction \tabularnewline
Raw Input & view raw input (R code)  \tabularnewline
Raw Output & view raw output of R engine  \tabularnewline
Computing time & 1 seconds \tabularnewline
R Server & 'Gwilym Jenkins' @ 72.249.127.135 \tabularnewline
\hline
\end{tabular}
%Source: https://freestatistics.org/blog/index.php?pk=71388&T=0

[TABLE]
[ROW][C]Summary of computational transaction[/C][/ROW]
[ROW][C]Raw Input[/C][C]view raw input (R code) [/C][/ROW]
[ROW][C]Raw Output[/C][C]view raw output of R engine [/C][/ROW]
[ROW][C]Computing time[/C][C]1 seconds[/C][/ROW]
[ROW][C]R Server[/C][C]'Gwilym Jenkins' @ 72.249.127.135[/C][/ROW]
[/TABLE]
Source: https://freestatistics.org/blog/index.php?pk=71388&T=0

Globally Unique Identifier (entire table): ba.freestatistics.org/blog/index.php?pk=71388&T=0

As an alternative you can also use a QR Code:  

The GUIDs for individual cells are displayed in the table below:

Summary of computational transaction
Raw Inputview raw input (R code)
Raw Outputview raw output of R engine
Computing time1 seconds
R Server'Gwilym Jenkins' @ 72.249.127.135


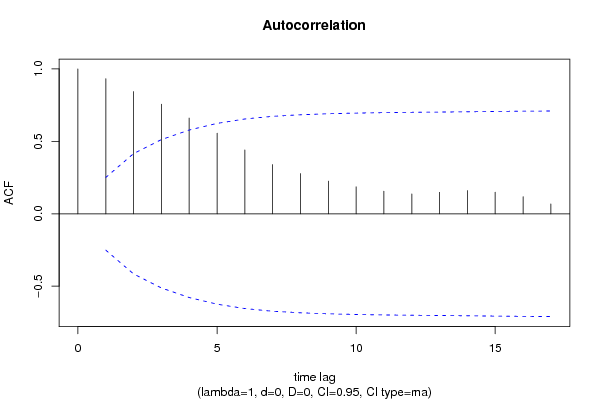
Autocorrelation Function
Time lag kACF(k)T-STATP-value
10.9331297.2880
20.8440346.59210
30.7567325.91030
40.660945.16211e-06
50.5564284.34582.7e-05
60.4405463.44080.000526
70.3401262.65650.005032
80.2777822.16950.016973
90.2254871.76110.041616
100.1860831.45340.075625
110.156091.21910.11375
120.1368621.06890.144657
130.1482521.15790.125712
140.1603251.25220.107643
150.1487761.1620.124885
160.1179270.9210.180328
170.0679480.53070.298779

\begin{tabular}{lllllllll}
\hline
Autocorrelation Function \tabularnewline
Time lag k & ACF(k) & T-STAT & P-value \tabularnewline
1 & 0.933129 & 7.288 & 0 \tabularnewline
2 & 0.844034 & 6.5921 & 0 \tabularnewline
3 & 0.756732 & 5.9103 & 0 \tabularnewline
4 & 0.66094 & 5.1621 & 1e-06 \tabularnewline
5 & 0.556428 & 4.3458 & 2.7e-05 \tabularnewline
6 & 0.440546 & 3.4408 & 0.000526 \tabularnewline
7 & 0.340126 & 2.6565 & 0.005032 \tabularnewline
8 & 0.277782 & 2.1695 & 0.016973 \tabularnewline
9 & 0.225487 & 1.7611 & 0.041616 \tabularnewline
10 & 0.186083 & 1.4534 & 0.075625 \tabularnewline
11 & 0.15609 & 1.2191 & 0.11375 \tabularnewline
12 & 0.136862 & 1.0689 & 0.144657 \tabularnewline
13 & 0.148252 & 1.1579 & 0.125712 \tabularnewline
14 & 0.160325 & 1.2522 & 0.107643 \tabularnewline
15 & 0.148776 & 1.162 & 0.124885 \tabularnewline
16 & 0.117927 & 0.921 & 0.180328 \tabularnewline
17 & 0.067948 & 0.5307 & 0.298779 \tabularnewline
\hline
\end{tabular}
%Source: https://freestatistics.org/blog/index.php?pk=71388&T=1

[TABLE]
[ROW][C]Autocorrelation Function[/C][/ROW]
[ROW][C]Time lag k[/C][C]ACF(k)[/C][C]T-STAT[/C][C]P-value[/C][/ROW]
[ROW][C]1[/C][C]0.933129[/C][C]7.288[/C][C]0[/C][/ROW]
[ROW][C]2[/C][C]0.844034[/C][C]6.5921[/C][C]0[/C][/ROW]
[ROW][C]3[/C][C]0.756732[/C][C]5.9103[/C][C]0[/C][/ROW]
[ROW][C]4[/C][C]0.66094[/C][C]5.1621[/C][C]1e-06[/C][/ROW]
[ROW][C]5[/C][C]0.556428[/C][C]4.3458[/C][C]2.7e-05[/C][/ROW]
[ROW][C]6[/C][C]0.440546[/C][C]3.4408[/C][C]0.000526[/C][/ROW]
[ROW][C]7[/C][C]0.340126[/C][C]2.6565[/C][C]0.005032[/C][/ROW]
[ROW][C]8[/C][C]0.277782[/C][C]2.1695[/C][C]0.016973[/C][/ROW]
[ROW][C]9[/C][C]0.225487[/C][C]1.7611[/C][C]0.041616[/C][/ROW]
[ROW][C]10[/C][C]0.186083[/C][C]1.4534[/C][C]0.075625[/C][/ROW]
[ROW][C]11[/C][C]0.15609[/C][C]1.2191[/C][C]0.11375[/C][/ROW]
[ROW][C]12[/C][C]0.136862[/C][C]1.0689[/C][C]0.144657[/C][/ROW]
[ROW][C]13[/C][C]0.148252[/C][C]1.1579[/C][C]0.125712[/C][/ROW]
[ROW][C]14[/C][C]0.160325[/C][C]1.2522[/C][C]0.107643[/C][/ROW]
[ROW][C]15[/C][C]0.148776[/C][C]1.162[/C][C]0.124885[/C][/ROW]
[ROW][C]16[/C][C]0.117927[/C][C]0.921[/C][C]0.180328[/C][/ROW]
[ROW][C]17[/C][C]0.067948[/C][C]0.5307[/C][C]0.298779[/C][/ROW]
[/TABLE]
Source: https://freestatistics.org/blog/index.php?pk=71388&T=1

Globally Unique Identifier (entire table): ba.freestatistics.org/blog/index.php?pk=71388&T=1

As an alternative you can also use a QR Code:  

The GUIDs for individual cells are displayed in the table below:

Autocorrelation Function
Time lag kACF(k)T-STATP-value
10.9331297.2880
20.8440346.59210
30.7567325.91030
40.660945.16211e-06
50.5564284.34582.7e-05
60.4405463.44080.000526
70.3401262.65650.005032
80.2777822.16950.016973
90.2254871.76110.041616
100.1860831.45340.075625
110.156091.21910.11375
120.1368621.06890.144657
130.1482521.15790.125712
140.1603251.25220.107643
150.1487761.1620.124885
160.1179270.9210.180328
170.0679480.53070.298779


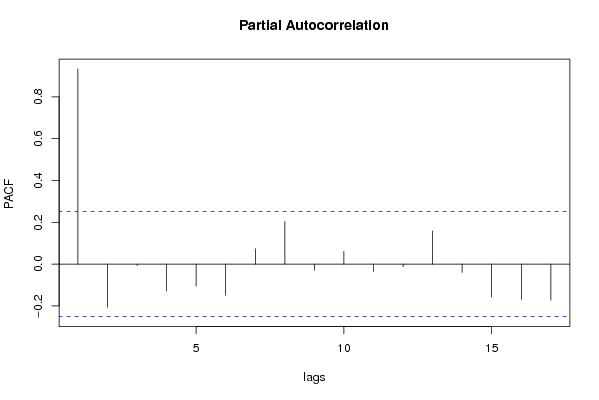
Partial Autocorrelation Function
Time lag kPACF(k)T-STATP-value
10.9331297.2880
2-0.20651-1.61290.055965
3-0.006511-0.05090.479805
4-0.127706-0.99740.161251
5-0.105228-0.82190.20718
6-0.149189-1.16520.124236
70.0733160.57260.284504
80.2035871.59010.058495
9-0.029091-0.22720.410511
100.0606370.47360.318742
11-0.035611-0.27810.390926
12-0.012998-0.10150.459737
130.1585391.23820.110188
14-0.03968-0.30990.378844
15-0.157537-1.23040.111635
16-0.16881-1.31840.096142
17-0.172228-1.34510.091779

\begin{tabular}{lllllllll}
\hline
Partial Autocorrelation Function \tabularnewline
Time lag k & PACF(k) & T-STAT & P-value \tabularnewline
1 & 0.933129 & 7.288 & 0 \tabularnewline
2 & -0.20651 & -1.6129 & 0.055965 \tabularnewline
3 & -0.006511 & -0.0509 & 0.479805 \tabularnewline
4 & -0.127706 & -0.9974 & 0.161251 \tabularnewline
5 & -0.105228 & -0.8219 & 0.20718 \tabularnewline
6 & -0.149189 & -1.1652 & 0.124236 \tabularnewline
7 & 0.073316 & 0.5726 & 0.284504 \tabularnewline
8 & 0.203587 & 1.5901 & 0.058495 \tabularnewline
9 & -0.029091 & -0.2272 & 0.410511 \tabularnewline
10 & 0.060637 & 0.4736 & 0.318742 \tabularnewline
11 & -0.035611 & -0.2781 & 0.390926 \tabularnewline
12 & -0.012998 & -0.1015 & 0.459737 \tabularnewline
13 & 0.158539 & 1.2382 & 0.110188 \tabularnewline
14 & -0.03968 & -0.3099 & 0.378844 \tabularnewline
15 & -0.157537 & -1.2304 & 0.111635 \tabularnewline
16 & -0.16881 & -1.3184 & 0.096142 \tabularnewline
17 & -0.172228 & -1.3451 & 0.091779 \tabularnewline
\hline
\end{tabular}
%Source: https://freestatistics.org/blog/index.php?pk=71388&T=2

[TABLE]
[ROW][C]Partial Autocorrelation Function[/C][/ROW]
[ROW][C]Time lag k[/C][C]PACF(k)[/C][C]T-STAT[/C][C]P-value[/C][/ROW]
[ROW][C]1[/C][C]0.933129[/C][C]7.288[/C][C]0[/C][/ROW]
[ROW][C]2[/C][C]-0.20651[/C][C]-1.6129[/C][C]0.055965[/C][/ROW]
[ROW][C]3[/C][C]-0.006511[/C][C]-0.0509[/C][C]0.479805[/C][/ROW]
[ROW][C]4[/C][C]-0.127706[/C][C]-0.9974[/C][C]0.161251[/C][/ROW]
[ROW][C]5[/C][C]-0.105228[/C][C]-0.8219[/C][C]0.20718[/C][/ROW]
[ROW][C]6[/C][C]-0.149189[/C][C]-1.1652[/C][C]0.124236[/C][/ROW]
[ROW][C]7[/C][C]0.073316[/C][C]0.5726[/C][C]0.284504[/C][/ROW]
[ROW][C]8[/C][C]0.203587[/C][C]1.5901[/C][C]0.058495[/C][/ROW]
[ROW][C]9[/C][C]-0.029091[/C][C]-0.2272[/C][C]0.410511[/C][/ROW]
[ROW][C]10[/C][C]0.060637[/C][C]0.4736[/C][C]0.318742[/C][/ROW]
[ROW][C]11[/C][C]-0.035611[/C][C]-0.2781[/C][C]0.390926[/C][/ROW]
[ROW][C]12[/C][C]-0.012998[/C][C]-0.1015[/C][C]0.459737[/C][/ROW]
[ROW][C]13[/C][C]0.158539[/C][C]1.2382[/C][C]0.110188[/C][/ROW]
[ROW][C]14[/C][C]-0.03968[/C][C]-0.3099[/C][C]0.378844[/C][/ROW]
[ROW][C]15[/C][C]-0.157537[/C][C]-1.2304[/C][C]0.111635[/C][/ROW]
[ROW][C]16[/C][C]-0.16881[/C][C]-1.3184[/C][C]0.096142[/C][/ROW]
[ROW][C]17[/C][C]-0.172228[/C][C]-1.3451[/C][C]0.091779[/C][/ROW]
[/TABLE]
Source: https://freestatistics.org/blog/index.php?pk=71388&T=2

Globally Unique Identifier (entire table): ba.freestatistics.org/blog/index.php?pk=71388&T=2

As an alternative you can also use a QR Code:  

The GUIDs for individual cells are displayed in the table below:

Partial Autocorrelation Function
Time lag kPACF(k)T-STATP-value
10.9331297.2880
2-0.20651-1.61290.055965
3-0.006511-0.05090.479805
4-0.127706-0.99740.161251
5-0.105228-0.82190.20718
6-0.149189-1.16520.124236
70.0733160.57260.284504
80.2035871.59010.058495
9-0.029091-0.22720.410511
100.0606370.47360.318742
11-0.035611-0.27810.390926
12-0.012998-0.10150.459737
130.1585391.23820.110188
14-0.03968-0.30990.378844
15-0.157537-1.23040.111635
16-0.16881-1.31840.096142
17-0.172228-1.34510.091779


Parameters (Session):
par1 = Default ; par2 = 1 ; par3 = 0 ; par4 = 0 ; par5 = 12 ; par6 = MA ; par7 = 0.95 ;
Parameters (R input):
par1 = Default ; par2 = 1 ; par3 = 0 ; par4 = 0 ; par5 = 12 ; par6 = MA ; par7 = 0.95 ;
R code (references can be found in the software module):
if (par1 == 'Default') {
par1 = 10*log10(length(x))
} else {
par1 <- as.numeric(par1)
}
par2 <- as.numeric(par2)
par3 <- as.numeric(par3)
par4 <- as.numeric(par4)
par5 <- as.numeric(par5)
if (par6 == 'White Noise') par6 <- 'white' else par6 <- 'ma'
par7 <- as.numeric(par7)
if (par2 == 0) {
x <- log(x)
} else {
x <- (x ^ par2 - 1) / par2
}
if (par3 > 0) x <- diff(x,lag=1,difference=par3)
if (par4 > 0) x <- diff(x,lag=par5,difference=par4)
bitmap(file='pic1.png')
racf <- acf(x, par1, main='Autocorrelation', xlab='time lag', ylab='ACF', ci.type=par6, ci=par7, sub=paste('(lambda=',par2,', d=',par3,', D=',par4,', CI=', par7, ', CI type=',par6,')',sep=''))
dev.off()
bitmap(file='pic2.png')
rpacf <- pacf(x,par1,main='Partial Autocorrelation',xlab='lags',ylab='PACF')
dev.off()
(myacf <- c(racf$acf))
(mypacf <- c(rpacf$acf))
lengthx <- length(x)
sqrtn <- sqrt(lengthx)
load(file='createtable')
a<-table.start()
a<-table.row.start(a)
a<-table.element(a,'Autocorrelation Function',4,TRUE)
a<-table.row.end(a)
a<-table.row.start(a)
a<-table.element(a,'Time lag k',header=TRUE)
a<-table.element(a,hyperlink('basics.htm','ACF(k)','click here for more information about the Autocorrelation Function'),header=TRUE)
a<-table.element(a,'T-STAT',header=TRUE)
a<-table.element(a,'P-value',header=TRUE)
a<-table.row.end(a)
for (i in 2:(par1+1)) {
a<-table.row.start(a)
a<-table.element(a,i-1,header=TRUE)
a<-table.element(a,round(myacf[i],6))
mytstat <- myacf[i]*sqrtn
a<-table.element(a,round(mytstat,4))
a<-table.element(a,round(1-pt(abs(mytstat),lengthx),6))
a<-table.row.end(a)
}
a<-table.end(a)
table.save(a,file='mytable.tab')
a<-table.start()
a<-table.row.start(a)
a<-table.element(a,'Partial Autocorrelation Function',4,TRUE)
a<-table.row.end(a)
a<-table.row.start(a)
a<-table.element(a,'Time lag k',header=TRUE)
a<-table.element(a,hyperlink('basics.htm','PACF(k)','click here for more information about the Partial Autocorrelation Function'),header=TRUE)
a<-table.element(a,'T-STAT',header=TRUE)
a<-table.element(a,'P-value',header=TRUE)
a<-table.row.end(a)
for (i in 1:par1) {
a<-table.row.start(a)
a<-table.element(a,i,header=TRUE)
a<-table.element(a,round(mypacf[i],6))
mytstat <- mypacf[i]*sqrtn
a<-table.element(a,round(mytstat,4))
a<-table.element(a,round(1-pt(abs(mytstat),lengthx),6))
a<-table.row.end(a)
}
a<-table.end(a)
table.save(a,file='mytable1.tab')