Free Statistics

of Irreproducible Research!

Author's title

Author*The author of this computation has been verified*
R Software Modulerwasp_arimaforecasting.wasp
Title produced by softwareARIMA Forecasting
Date of computationWed, 30 Dec 2009 12:41:35 -0700
Cite this page as followsStatistical Computations at FreeStatistics.org, Office for Research Development and Education, URL https://freestatistics.org/blog/index.php?v=date/2009/Dec/30/t12622021989u6y3rk439d1kgy.htm/, Retrieved Mon, 29 Apr 2024 07:31:32 +0000
Statistical Computations at FreeStatistics.org, Office for Research Development and Education, URL https://freestatistics.org/blog/index.php?pk=71360, Retrieved Mon, 29 Apr 2024 07:31:32 +0000
QR Codes:

Original text written by user:
IsPrivate?No (this computation is public)
User-defined keywords
Estimated Impact160
Family? (F = Feedback message, R = changed R code, M = changed R Module, P = changed Parameters, D = changed Data)
-     [Standard Deviation-Mean Plot] [deel1 st dev mean...] [2009-12-16 19:13:20] [95cead3ebb75668735f848316249436a]
- RMP   [(Partial) Autocorrelation Function] [deel1 acf D=d=0] [2009-12-16 19:17:58] [95cead3ebb75668735f848316249436a]
-         [(Partial) Autocorrelation Function] [deel1 acf D=d=1] [2009-12-16 19:21:27] [95cead3ebb75668735f848316249436a]
- RM        [Variance Reduction Matrix] [deel1 vrm] [2009-12-16 19:23:09] [95cead3ebb75668735f848316249436a]
- RM          [Spectral Analysis] [deel1 spectrum D=d=1] [2009-12-16 19:31:03] [95cead3ebb75668735f848316249436a]
- RMP           [ARIMA Forecasting] [deel1 arima forca...] [2009-12-18 14:46:40] [95cead3ebb75668735f848316249436a]
-   PD              [ARIMA Forecasting] [Arima forecasting...] [2009-12-30 19:41:35] [b243db81ea3e1f02fb3382887fb0f701] [Current]
Feedback Forum

Post a new message
Dataseries X:
228
136
174
69
108
149
134
131
180
127
59
59
202
173
296
154
117
86
38
17
52
12
61
65
70
91
111
90
110
100
99
137
139
124
103
75
55
75
65
17
27
17
20
131
26
66
59
35
57
6
24
57
42
55
30
35
22
18
22
82
90
66
64
50
56
99
97
41
59
92
91
47


Summary of computational transaction
Raw Inputview raw input (R code)
Raw Outputview raw output of R engine
Computing time3 seconds
R Server'Gwilym Jenkins' @ 72.249.127.135

\begin{tabular}{lllllllll}
\hline
Summary of computational transaction \tabularnewline
Raw Input & view raw input (R code)  \tabularnewline
Raw Output & view raw output of R engine  \tabularnewline
Computing time & 3 seconds \tabularnewline
R Server & 'Gwilym Jenkins' @ 72.249.127.135 \tabularnewline
\hline
\end{tabular}
%Source: https://freestatistics.org/blog/index.php?pk=71360&T=0

[TABLE]
[ROW][C]Summary of computational transaction[/C][/ROW]
[ROW][C]Raw Input[/C][C]view raw input (R code) [/C][/ROW]
[ROW][C]Raw Output[/C][C]view raw output of R engine [/C][/ROW]
[ROW][C]Computing time[/C][C]3 seconds[/C][/ROW]
[ROW][C]R Server[/C][C]'Gwilym Jenkins' @ 72.249.127.135[/C][/ROW]
[/TABLE]
Source: https://freestatistics.org/blog/index.php?pk=71360&T=0

Globally Unique Identifier (entire table): ba.freestatistics.org/blog/index.php?pk=71360&T=0

As an alternative you can also use a QR Code:  

The GUIDs for individual cells are displayed in the table below:

Summary of computational transaction
Raw Inputview raw input (R code)
Raw Outputview raw output of R engine
Computing time3 seconds
R Server'Gwilym Jenkins' @ 72.249.127.135


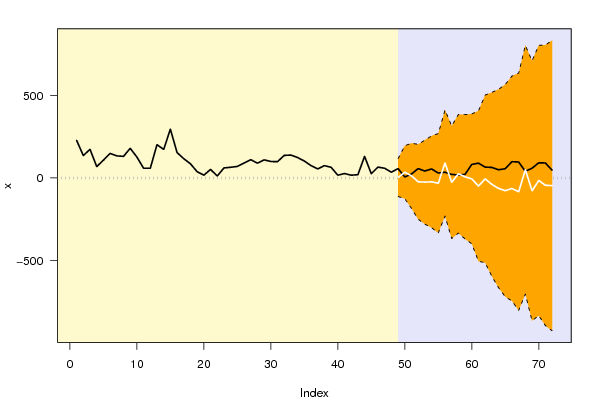
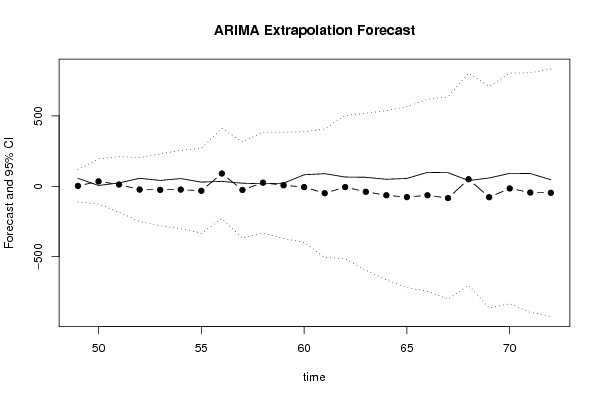
Univariate ARIMA Extrapolation Forecast
timeY[t]F[t]95% LB95% UBp-value(H0: Y[t] = F[t])P(F[t]>Y[t-1])P(F[t]>Y[t-s])P(F[t]>Y[48])
3675-------
3755-------
3875-------
3965-------
4017-------
4127-------
4217-------
4320-------
44131-------
4526-------
4666-------
4759-------
4835-------
49572.8136-112.187117.81420.17790.29170.18690.2917
50634.9347-125.716195.58530.3620.39390.31250.4997
512412.8786-184.6823210.43950.45610.52720.30250.4131
5257-23.13-250.3241204.06420.24470.34220.36460.308
5342-25.0571-279.6851229.57090.30290.26380.34430.3219
5455-23.1939-301.4486255.06080.29090.3230.38850.3409
5530-31.9935-333.0591269.07220.34330.28560.36750.3314
563590.7428-230.5578412.04340.36690.64450.4030.6331
5722-25.9306-367.1718315.31070.39150.36320.38270.3632
581825.6802-333.5446384.9050.48330.5080.41290.4797
59227.1317-370.0295384.29290.46920.47750.39380.4424
6082-5.3817-398.8925388.12910.33170.44580.42030.4203
6190-48.9931-504.746406.75990.2750.28660.32430.359
6266-5.5083-513.5284502.51180.39130.35630.48230.4379
6364-38.8672-596.479518.74470.35880.35620.41260.3976
6450-63.6336-664.7307537.46360.35550.33860.3470.3739
6556-76.7426-720.2883566.80310.3430.34970.35880.3668
6699-63.7575-745.3372617.82230.31990.36530.36640.3882
6797-83.6194-802.9045635.66580.31130.30940.37840.3733
684150.12-703.3943803.63430.49050.45150.51570.5157
6959-77.4974-865.2734710.27850.36710.38410.40220.3898
7092-15.0013-834.1572804.15460.3990.42970.46850.4524
7191-44.3768-895.1475806.39380.37760.37670.43920.4275
7247-46.1213-926.0353833.79280.41780.380.38770.4283

\begin{tabular}{lllllllll}
\hline
Univariate ARIMA Extrapolation Forecast \tabularnewline
time & Y[t] & F[t] & 95% LB & 95% UB & p-value(H0: Y[t] = F[t]) & P(F[t]>Y[t-1]) & P(F[t]>Y[t-s]) & P(F[t]>Y[48]) \tabularnewline
36 & 75 & - & - & - & - & - & - & - \tabularnewline
37 & 55 & - & - & - & - & - & - & - \tabularnewline
38 & 75 & - & - & - & - & - & - & - \tabularnewline
39 & 65 & - & - & - & - & - & - & - \tabularnewline
40 & 17 & - & - & - & - & - & - & - \tabularnewline
41 & 27 & - & - & - & - & - & - & - \tabularnewline
42 & 17 & - & - & - & - & - & - & - \tabularnewline
43 & 20 & - & - & - & - & - & - & - \tabularnewline
44 & 131 & - & - & - & - & - & - & - \tabularnewline
45 & 26 & - & - & - & - & - & - & - \tabularnewline
46 & 66 & - & - & - & - & - & - & - \tabularnewline
47 & 59 & - & - & - & - & - & - & - \tabularnewline
48 & 35 & - & - & - & - & - & - & - \tabularnewline
49 & 57 & 2.8136 & -112.187 & 117.8142 & 0.1779 & 0.2917 & 0.1869 & 0.2917 \tabularnewline
50 & 6 & 34.9347 & -125.716 & 195.5853 & 0.362 & 0.3939 & 0.3125 & 0.4997 \tabularnewline
51 & 24 & 12.8786 & -184.6823 & 210.4395 & 0.4561 & 0.5272 & 0.3025 & 0.4131 \tabularnewline
52 & 57 & -23.13 & -250.3241 & 204.0642 & 0.2447 & 0.3422 & 0.3646 & 0.308 \tabularnewline
53 & 42 & -25.0571 & -279.6851 & 229.5709 & 0.3029 & 0.2638 & 0.3443 & 0.3219 \tabularnewline
54 & 55 & -23.1939 & -301.4486 & 255.0608 & 0.2909 & 0.323 & 0.3885 & 0.3409 \tabularnewline
55 & 30 & -31.9935 & -333.0591 & 269.0722 & 0.3433 & 0.2856 & 0.3675 & 0.3314 \tabularnewline
56 & 35 & 90.7428 & -230.5578 & 412.0434 & 0.3669 & 0.6445 & 0.403 & 0.6331 \tabularnewline
57 & 22 & -25.9306 & -367.1718 & 315.3107 & 0.3915 & 0.3632 & 0.3827 & 0.3632 \tabularnewline
58 & 18 & 25.6802 & -333.5446 & 384.905 & 0.4833 & 0.508 & 0.4129 & 0.4797 \tabularnewline
59 & 22 & 7.1317 & -370.0295 & 384.2929 & 0.4692 & 0.4775 & 0.3938 & 0.4424 \tabularnewline
60 & 82 & -5.3817 & -398.8925 & 388.1291 & 0.3317 & 0.4458 & 0.4203 & 0.4203 \tabularnewline
61 & 90 & -48.9931 & -504.746 & 406.7599 & 0.275 & 0.2866 & 0.3243 & 0.359 \tabularnewline
62 & 66 & -5.5083 & -513.5284 & 502.5118 & 0.3913 & 0.3563 & 0.4823 & 0.4379 \tabularnewline
63 & 64 & -38.8672 & -596.479 & 518.7447 & 0.3588 & 0.3562 & 0.4126 & 0.3976 \tabularnewline
64 & 50 & -63.6336 & -664.7307 & 537.4636 & 0.3555 & 0.3386 & 0.347 & 0.3739 \tabularnewline
65 & 56 & -76.7426 & -720.2883 & 566.8031 & 0.343 & 0.3497 & 0.3588 & 0.3668 \tabularnewline
66 & 99 & -63.7575 & -745.3372 & 617.8223 & 0.3199 & 0.3653 & 0.3664 & 0.3882 \tabularnewline
67 & 97 & -83.6194 & -802.9045 & 635.6658 & 0.3113 & 0.3094 & 0.3784 & 0.3733 \tabularnewline
68 & 41 & 50.12 & -703.3943 & 803.6343 & 0.4905 & 0.4515 & 0.5157 & 0.5157 \tabularnewline
69 & 59 & -77.4974 & -865.2734 & 710.2785 & 0.3671 & 0.3841 & 0.4022 & 0.3898 \tabularnewline
70 & 92 & -15.0013 & -834.1572 & 804.1546 & 0.399 & 0.4297 & 0.4685 & 0.4524 \tabularnewline
71 & 91 & -44.3768 & -895.1475 & 806.3938 & 0.3776 & 0.3767 & 0.4392 & 0.4275 \tabularnewline
72 & 47 & -46.1213 & -926.0353 & 833.7928 & 0.4178 & 0.38 & 0.3877 & 0.4283 \tabularnewline
\hline
\end{tabular}
%Source: https://freestatistics.org/blog/index.php?pk=71360&T=1

[TABLE]
[ROW][C]Univariate ARIMA Extrapolation Forecast[/C][/ROW]
[ROW][C]time[/C][C]Y[t][/C][C]F[t][/C][C]95% LB[/C][C]95% UB[/C][C]p-value(H0: Y[t] = F[t])[/C][C]P(F[t]>Y[t-1])[/C][C]P(F[t]>Y[t-s])[/C][C]P(F[t]>Y[48])[/C][/ROW]
[ROW][C]36[/C][C]75[/C][C]-[/C][C]-[/C][C]-[/C][C]-[/C][C]-[/C][C]-[/C][C]-[/C][/ROW]
[ROW][C]37[/C][C]55[/C][C]-[/C][C]-[/C][C]-[/C][C]-[/C][C]-[/C][C]-[/C][C]-[/C][/ROW]
[ROW][C]38[/C][C]75[/C][C]-[/C][C]-[/C][C]-[/C][C]-[/C][C]-[/C][C]-[/C][C]-[/C][/ROW]
[ROW][C]39[/C][C]65[/C][C]-[/C][C]-[/C][C]-[/C][C]-[/C][C]-[/C][C]-[/C][C]-[/C][/ROW]
[ROW][C]40[/C][C]17[/C][C]-[/C][C]-[/C][C]-[/C][C]-[/C][C]-[/C][C]-[/C][C]-[/C][/ROW]
[ROW][C]41[/C][C]27[/C][C]-[/C][C]-[/C][C]-[/C][C]-[/C][C]-[/C][C]-[/C][C]-[/C][/ROW]
[ROW][C]42[/C][C]17[/C][C]-[/C][C]-[/C][C]-[/C][C]-[/C][C]-[/C][C]-[/C][C]-[/C][/ROW]
[ROW][C]43[/C][C]20[/C][C]-[/C][C]-[/C][C]-[/C][C]-[/C][C]-[/C][C]-[/C][C]-[/C][/ROW]
[ROW][C]44[/C][C]131[/C][C]-[/C][C]-[/C][C]-[/C][C]-[/C][C]-[/C][C]-[/C][C]-[/C][/ROW]
[ROW][C]45[/C][C]26[/C][C]-[/C][C]-[/C][C]-[/C][C]-[/C][C]-[/C][C]-[/C][C]-[/C][/ROW]
[ROW][C]46[/C][C]66[/C][C]-[/C][C]-[/C][C]-[/C][C]-[/C][C]-[/C][C]-[/C][C]-[/C][/ROW]
[ROW][C]47[/C][C]59[/C][C]-[/C][C]-[/C][C]-[/C][C]-[/C][C]-[/C][C]-[/C][C]-[/C][/ROW]
[ROW][C]48[/C][C]35[/C][C]-[/C][C]-[/C][C]-[/C][C]-[/C][C]-[/C][C]-[/C][C]-[/C][/ROW]
[ROW][C]49[/C][C]57[/C][C]2.8136[/C][C]-112.187[/C][C]117.8142[/C][C]0.1779[/C][C]0.2917[/C][C]0.1869[/C][C]0.2917[/C][/ROW]
[ROW][C]50[/C][C]6[/C][C]34.9347[/C][C]-125.716[/C][C]195.5853[/C][C]0.362[/C][C]0.3939[/C][C]0.3125[/C][C]0.4997[/C][/ROW]
[ROW][C]51[/C][C]24[/C][C]12.8786[/C][C]-184.6823[/C][C]210.4395[/C][C]0.4561[/C][C]0.5272[/C][C]0.3025[/C][C]0.4131[/C][/ROW]
[ROW][C]52[/C][C]57[/C][C]-23.13[/C][C]-250.3241[/C][C]204.0642[/C][C]0.2447[/C][C]0.3422[/C][C]0.3646[/C][C]0.308[/C][/ROW]
[ROW][C]53[/C][C]42[/C][C]-25.0571[/C][C]-279.6851[/C][C]229.5709[/C][C]0.3029[/C][C]0.2638[/C][C]0.3443[/C][C]0.3219[/C][/ROW]
[ROW][C]54[/C][C]55[/C][C]-23.1939[/C][C]-301.4486[/C][C]255.0608[/C][C]0.2909[/C][C]0.323[/C][C]0.3885[/C][C]0.3409[/C][/ROW]
[ROW][C]55[/C][C]30[/C][C]-31.9935[/C][C]-333.0591[/C][C]269.0722[/C][C]0.3433[/C][C]0.2856[/C][C]0.3675[/C][C]0.3314[/C][/ROW]
[ROW][C]56[/C][C]35[/C][C]90.7428[/C][C]-230.5578[/C][C]412.0434[/C][C]0.3669[/C][C]0.6445[/C][C]0.403[/C][C]0.6331[/C][/ROW]
[ROW][C]57[/C][C]22[/C][C]-25.9306[/C][C]-367.1718[/C][C]315.3107[/C][C]0.3915[/C][C]0.3632[/C][C]0.3827[/C][C]0.3632[/C][/ROW]
[ROW][C]58[/C][C]18[/C][C]25.6802[/C][C]-333.5446[/C][C]384.905[/C][C]0.4833[/C][C]0.508[/C][C]0.4129[/C][C]0.4797[/C][/ROW]
[ROW][C]59[/C][C]22[/C][C]7.1317[/C][C]-370.0295[/C][C]384.2929[/C][C]0.4692[/C][C]0.4775[/C][C]0.3938[/C][C]0.4424[/C][/ROW]
[ROW][C]60[/C][C]82[/C][C]-5.3817[/C][C]-398.8925[/C][C]388.1291[/C][C]0.3317[/C][C]0.4458[/C][C]0.4203[/C][C]0.4203[/C][/ROW]
[ROW][C]61[/C][C]90[/C][C]-48.9931[/C][C]-504.746[/C][C]406.7599[/C][C]0.275[/C][C]0.2866[/C][C]0.3243[/C][C]0.359[/C][/ROW]
[ROW][C]62[/C][C]66[/C][C]-5.5083[/C][C]-513.5284[/C][C]502.5118[/C][C]0.3913[/C][C]0.3563[/C][C]0.4823[/C][C]0.4379[/C][/ROW]
[ROW][C]63[/C][C]64[/C][C]-38.8672[/C][C]-596.479[/C][C]518.7447[/C][C]0.3588[/C][C]0.3562[/C][C]0.4126[/C][C]0.3976[/C][/ROW]
[ROW][C]64[/C][C]50[/C][C]-63.6336[/C][C]-664.7307[/C][C]537.4636[/C][C]0.3555[/C][C]0.3386[/C][C]0.347[/C][C]0.3739[/C][/ROW]
[ROW][C]65[/C][C]56[/C][C]-76.7426[/C][C]-720.2883[/C][C]566.8031[/C][C]0.343[/C][C]0.3497[/C][C]0.3588[/C][C]0.3668[/C][/ROW]
[ROW][C]66[/C][C]99[/C][C]-63.7575[/C][C]-745.3372[/C][C]617.8223[/C][C]0.3199[/C][C]0.3653[/C][C]0.3664[/C][C]0.3882[/C][/ROW]
[ROW][C]67[/C][C]97[/C][C]-83.6194[/C][C]-802.9045[/C][C]635.6658[/C][C]0.3113[/C][C]0.3094[/C][C]0.3784[/C][C]0.3733[/C][/ROW]
[ROW][C]68[/C][C]41[/C][C]50.12[/C][C]-703.3943[/C][C]803.6343[/C][C]0.4905[/C][C]0.4515[/C][C]0.5157[/C][C]0.5157[/C][/ROW]
[ROW][C]69[/C][C]59[/C][C]-77.4974[/C][C]-865.2734[/C][C]710.2785[/C][C]0.3671[/C][C]0.3841[/C][C]0.4022[/C][C]0.3898[/C][/ROW]
[ROW][C]70[/C][C]92[/C][C]-15.0013[/C][C]-834.1572[/C][C]804.1546[/C][C]0.399[/C][C]0.4297[/C][C]0.4685[/C][C]0.4524[/C][/ROW]
[ROW][C]71[/C][C]91[/C][C]-44.3768[/C][C]-895.1475[/C][C]806.3938[/C][C]0.3776[/C][C]0.3767[/C][C]0.4392[/C][C]0.4275[/C][/ROW]
[ROW][C]72[/C][C]47[/C][C]-46.1213[/C][C]-926.0353[/C][C]833.7928[/C][C]0.4178[/C][C]0.38[/C][C]0.3877[/C][C]0.4283[/C][/ROW]
[/TABLE]
Source: https://freestatistics.org/blog/index.php?pk=71360&T=1

Globally Unique Identifier (entire table): ba.freestatistics.org/blog/index.php?pk=71360&T=1

As an alternative you can also use a QR Code:  

The GUIDs for individual cells are displayed in the table below:

Univariate ARIMA Extrapolation Forecast
timeY[t]F[t]95% LB95% UBp-value(H0: Y[t] = F[t])P(F[t]>Y[t-1])P(F[t]>Y[t-s])P(F[t]>Y[48])
3675-------
3755-------
3875-------
3965-------
4017-------
4127-------
4217-------
4320-------
44131-------
4526-------
4666-------
4759-------
4835-------
49572.8136-112.187117.81420.17790.29170.18690.2917
50634.9347-125.716195.58530.3620.39390.31250.4997
512412.8786-184.6823210.43950.45610.52720.30250.4131
5257-23.13-250.3241204.06420.24470.34220.36460.308
5342-25.0571-279.6851229.57090.30290.26380.34430.3219
5455-23.1939-301.4486255.06080.29090.3230.38850.3409
5530-31.9935-333.0591269.07220.34330.28560.36750.3314
563590.7428-230.5578412.04340.36690.64450.4030.6331
5722-25.9306-367.1718315.31070.39150.36320.38270.3632
581825.6802-333.5446384.9050.48330.5080.41290.4797
59227.1317-370.0295384.29290.46920.47750.39380.4424
6082-5.3817-398.8925388.12910.33170.44580.42030.4203
6190-48.9931-504.746406.75990.2750.28660.32430.359
6266-5.5083-513.5284502.51180.39130.35630.48230.4379
6364-38.8672-596.479518.74470.35880.35620.41260.3976
6450-63.6336-664.7307537.46360.35550.33860.3470.3739
6556-76.7426-720.2883566.80310.3430.34970.35880.3668
6699-63.7575-745.3372617.82230.31990.36530.36640.3882
6797-83.6194-802.9045635.66580.31130.30940.37840.3733
684150.12-703.3943803.63430.49050.45150.51570.5157
6959-77.4974-865.2734710.27850.36710.38410.40220.3898
7092-15.0013-834.1572804.15460.3990.42970.46850.4524
7191-44.3768-895.1475806.39380.37760.37670.43920.4275
7247-46.1213-926.0353833.79280.41780.380.38770.4283


Univariate ARIMA Extrapolation Forecast Performance
time% S.E.PEMAPESq.EMSERMSE
4920.853519.258602936.163400
502.3462-0.828310.0434837.21451886.68943.436
517.82660.86366.9835123.68521299.021136.0419
52-5.0115-3.46436.10376420.8142579.469350.7885
53-5.1847-2.67625.41824496.65352962.906154.4326
54-6.1209-3.37135.0776114.2913488.136959.0605
55-4.8011-1.93774.62863843.19213538.859159.4883
561.8065-0.61434.12683107.263484.909259.0331
57-6.7142-1.84843.87362297.33833352.956957.9047
587.1369-0.29913.516258.98573023.559854.9869
5926.98222.08483.386221.06642768.787752.6193
60-37.3062-16.23684.45697635.56283174.352256.3414
61-4.7461-2.8374.332319319.07954416.254366.4549
62-47.0551-12.98194.95025113.43784466.053266.8285
63-7.3197-2.64664.796610581.65514873.7669.8123
64-4.8195-1.78574.608412912.58375376.186473.3225
65-4.2785-1.72974.439117620.59776096.445978.0797
66-5.4542-2.55284.334326489.98917229.420685.026
67-4.3887-2.164.219832623.35298565.943392.5524
687.6705-0.1824.01883.17388141.804890.232
69-5.1863-1.76133.910518631.55028641.316592.9587
70-27.86-7.13284.05711449.27898768.951293.6427
71-9.7814-3.05064.013218326.88299184.513495.8359
72-9.7338-2.01913.93018671.57189163.140995.7243

\begin{tabular}{lllllllll}
\hline
Univariate ARIMA Extrapolation Forecast Performance \tabularnewline
time & % S.E. & PE & MAPE & Sq.E & MSE & RMSE \tabularnewline
49 & 20.8535 & 19.2586 & 0 & 2936.1634 & 0 & 0 \tabularnewline
50 & 2.3462 & -0.8283 & 10.0434 & 837.2145 & 1886.689 & 43.436 \tabularnewline
51 & 7.8266 & 0.8636 & 6.9835 & 123.6852 & 1299.0211 & 36.0419 \tabularnewline
52 & -5.0115 & -3.4643 & 6.1037 & 6420.814 & 2579.4693 & 50.7885 \tabularnewline
53 & -5.1847 & -2.6762 & 5.4182 & 4496.6535 & 2962.9061 & 54.4326 \tabularnewline
54 & -6.1209 & -3.3713 & 5.077 & 6114.291 & 3488.1369 & 59.0605 \tabularnewline
55 & -4.8011 & -1.9377 & 4.6286 & 3843.1921 & 3538.8591 & 59.4883 \tabularnewline
56 & 1.8065 & -0.6143 & 4.1268 & 3107.26 & 3484.9092 & 59.0331 \tabularnewline
57 & -6.7142 & -1.8484 & 3.8736 & 2297.3383 & 3352.9569 & 57.9047 \tabularnewline
58 & 7.1369 & -0.2991 & 3.5162 & 58.9857 & 3023.5598 & 54.9869 \tabularnewline
59 & 26.9822 & 2.0848 & 3.386 & 221.0664 & 2768.7877 & 52.6193 \tabularnewline
60 & -37.3062 & -16.2368 & 4.4569 & 7635.5628 & 3174.3522 & 56.3414 \tabularnewline
61 & -4.7461 & -2.837 & 4.3323 & 19319.0795 & 4416.2543 & 66.4549 \tabularnewline
62 & -47.0551 & -12.9819 & 4.9502 & 5113.4378 & 4466.0532 & 66.8285 \tabularnewline
63 & -7.3197 & -2.6466 & 4.7966 & 10581.6551 & 4873.76 & 69.8123 \tabularnewline
64 & -4.8195 & -1.7857 & 4.6084 & 12912.5837 & 5376.1864 & 73.3225 \tabularnewline
65 & -4.2785 & -1.7297 & 4.4391 & 17620.5977 & 6096.4459 & 78.0797 \tabularnewline
66 & -5.4542 & -2.5528 & 4.3343 & 26489.9891 & 7229.4206 & 85.026 \tabularnewline
67 & -4.3887 & -2.16 & 4.2198 & 32623.3529 & 8565.9433 & 92.5524 \tabularnewline
68 & 7.6705 & -0.182 & 4.018 & 83.1738 & 8141.8048 & 90.232 \tabularnewline
69 & -5.1863 & -1.7613 & 3.9105 & 18631.5502 & 8641.3165 & 92.9587 \tabularnewline
70 & -27.86 & -7.1328 & 4.057 & 11449.2789 & 8768.9512 & 93.6427 \tabularnewline
71 & -9.7814 & -3.0506 & 4.0132 & 18326.8829 & 9184.5134 & 95.8359 \tabularnewline
72 & -9.7338 & -2.0191 & 3.9301 & 8671.5718 & 9163.1409 & 95.7243 \tabularnewline
\hline
\end{tabular}
%Source: https://freestatistics.org/blog/index.php?pk=71360&T=2

[TABLE]
[ROW][C]Univariate ARIMA Extrapolation Forecast Performance[/C][/ROW]
[ROW][C]time[/C][C]% S.E.[/C][C]PE[/C][C]MAPE[/C][C]Sq.E[/C][C]MSE[/C][C]RMSE[/C][/ROW]
[ROW][C]49[/C][C]20.8535[/C][C]19.2586[/C][C]0[/C][C]2936.1634[/C][C]0[/C][C]0[/C][/ROW]
[ROW][C]50[/C][C]2.3462[/C][C]-0.8283[/C][C]10.0434[/C][C]837.2145[/C][C]1886.689[/C][C]43.436[/C][/ROW]
[ROW][C]51[/C][C]7.8266[/C][C]0.8636[/C][C]6.9835[/C][C]123.6852[/C][C]1299.0211[/C][C]36.0419[/C][/ROW]
[ROW][C]52[/C][C]-5.0115[/C][C]-3.4643[/C][C]6.1037[/C][C]6420.814[/C][C]2579.4693[/C][C]50.7885[/C][/ROW]
[ROW][C]53[/C][C]-5.1847[/C][C]-2.6762[/C][C]5.4182[/C][C]4496.6535[/C][C]2962.9061[/C][C]54.4326[/C][/ROW]
[ROW][C]54[/C][C]-6.1209[/C][C]-3.3713[/C][C]5.077[/C][C]6114.291[/C][C]3488.1369[/C][C]59.0605[/C][/ROW]
[ROW][C]55[/C][C]-4.8011[/C][C]-1.9377[/C][C]4.6286[/C][C]3843.1921[/C][C]3538.8591[/C][C]59.4883[/C][/ROW]
[ROW][C]56[/C][C]1.8065[/C][C]-0.6143[/C][C]4.1268[/C][C]3107.26[/C][C]3484.9092[/C][C]59.0331[/C][/ROW]
[ROW][C]57[/C][C]-6.7142[/C][C]-1.8484[/C][C]3.8736[/C][C]2297.3383[/C][C]3352.9569[/C][C]57.9047[/C][/ROW]
[ROW][C]58[/C][C]7.1369[/C][C]-0.2991[/C][C]3.5162[/C][C]58.9857[/C][C]3023.5598[/C][C]54.9869[/C][/ROW]
[ROW][C]59[/C][C]26.9822[/C][C]2.0848[/C][C]3.386[/C][C]221.0664[/C][C]2768.7877[/C][C]52.6193[/C][/ROW]
[ROW][C]60[/C][C]-37.3062[/C][C]-16.2368[/C][C]4.4569[/C][C]7635.5628[/C][C]3174.3522[/C][C]56.3414[/C][/ROW]
[ROW][C]61[/C][C]-4.7461[/C][C]-2.837[/C][C]4.3323[/C][C]19319.0795[/C][C]4416.2543[/C][C]66.4549[/C][/ROW]
[ROW][C]62[/C][C]-47.0551[/C][C]-12.9819[/C][C]4.9502[/C][C]5113.4378[/C][C]4466.0532[/C][C]66.8285[/C][/ROW]
[ROW][C]63[/C][C]-7.3197[/C][C]-2.6466[/C][C]4.7966[/C][C]10581.6551[/C][C]4873.76[/C][C]69.8123[/C][/ROW]
[ROW][C]64[/C][C]-4.8195[/C][C]-1.7857[/C][C]4.6084[/C][C]12912.5837[/C][C]5376.1864[/C][C]73.3225[/C][/ROW]
[ROW][C]65[/C][C]-4.2785[/C][C]-1.7297[/C][C]4.4391[/C][C]17620.5977[/C][C]6096.4459[/C][C]78.0797[/C][/ROW]
[ROW][C]66[/C][C]-5.4542[/C][C]-2.5528[/C][C]4.3343[/C][C]26489.9891[/C][C]7229.4206[/C][C]85.026[/C][/ROW]
[ROW][C]67[/C][C]-4.3887[/C][C]-2.16[/C][C]4.2198[/C][C]32623.3529[/C][C]8565.9433[/C][C]92.5524[/C][/ROW]
[ROW][C]68[/C][C]7.6705[/C][C]-0.182[/C][C]4.018[/C][C]83.1738[/C][C]8141.8048[/C][C]90.232[/C][/ROW]
[ROW][C]69[/C][C]-5.1863[/C][C]-1.7613[/C][C]3.9105[/C][C]18631.5502[/C][C]8641.3165[/C][C]92.9587[/C][/ROW]
[ROW][C]70[/C][C]-27.86[/C][C]-7.1328[/C][C]4.057[/C][C]11449.2789[/C][C]8768.9512[/C][C]93.6427[/C][/ROW]
[ROW][C]71[/C][C]-9.7814[/C][C]-3.0506[/C][C]4.0132[/C][C]18326.8829[/C][C]9184.5134[/C][C]95.8359[/C][/ROW]
[ROW][C]72[/C][C]-9.7338[/C][C]-2.0191[/C][C]3.9301[/C][C]8671.5718[/C][C]9163.1409[/C][C]95.7243[/C][/ROW]
[/TABLE]
Source: https://freestatistics.org/blog/index.php?pk=71360&T=2

Globally Unique Identifier (entire table): ba.freestatistics.org/blog/index.php?pk=71360&T=2

As an alternative you can also use a QR Code:  

The GUIDs for individual cells are displayed in the table below:

Univariate ARIMA Extrapolation Forecast Performance
time% S.E.PEMAPESq.EMSERMSE
4920.853519.258602936.163400
502.3462-0.828310.0434837.21451886.68943.436
517.82660.86366.9835123.68521299.021136.0419
52-5.0115-3.46436.10376420.8142579.469350.7885
53-5.1847-2.67625.41824496.65352962.906154.4326
54-6.1209-3.37135.0776114.2913488.136959.0605
55-4.8011-1.93774.62863843.19213538.859159.4883
561.8065-0.61434.12683107.263484.909259.0331
57-6.7142-1.84843.87362297.33833352.956957.9047
587.1369-0.29913.516258.98573023.559854.9869
5926.98222.08483.386221.06642768.787752.6193
60-37.3062-16.23684.45697635.56283174.352256.3414
61-4.7461-2.8374.332319319.07954416.254366.4549
62-47.0551-12.98194.95025113.43784466.053266.8285
63-7.3197-2.64664.796610581.65514873.7669.8123
64-4.8195-1.78574.608412912.58375376.186473.3225
65-4.2785-1.72974.439117620.59776096.445978.0797
66-5.4542-2.55284.334326489.98917229.420685.026
67-4.3887-2.164.219832623.35298565.943392.5524
687.6705-0.1824.01883.17388141.804890.232
69-5.1863-1.76133.910518631.55028641.316592.9587
70-27.86-7.13284.05711449.27898768.951293.6427
71-9.7814-3.05064.013218326.88299184.513495.8359
72-9.7338-2.01913.93018671.57189163.140995.7243


Parameters (Session):
par1 = 60 ; par2 = 1 ; par3 = 0 ; par4 = 0 ; par5 = 12 ; par6 = White Noise ; par7 = 0.95 ;
Parameters (R input):
par1 = 24 ; par2 = 1 ; par3 = 1 ; par4 = 1 ; par5 = 12 ; par6 = 1 ; par7 = 1 ; par8 = 0 ; par9 = 0 ; par10 = FALSE ;
R code (references can be found in the software module):
par1 <- as.numeric(par1) #cut off periods
par2 <- as.numeric(par2) #lambda
par3 <- as.numeric(par3) #degree of non-seasonal differencing
par4 <- as.numeric(par4) #degree of seasonal differencing
par5 <- as.numeric(par5) #seasonal period
par6 <- as.numeric(par6) #p
par7 <- as.numeric(par7) #q
par8 <- as.numeric(par8) #P
par9 <- as.numeric(par9) #Q
if (par10 == 'TRUE') par10 <- TRUE
if (par10 == 'FALSE') par10 <- FALSE
if (par2 == 0) x <- log(x)
if (par2 != 0) x <- x^par2
lx <- length(x)
first <- lx - 2*par1
nx <- lx - par1
nx1 <- nx + 1
fx <- lx - nx
if (fx < 1) {
fx <- par5
nx1 <- lx + fx - 1
first <- lx - 2*fx
}
first <- 1
if (fx < 3) fx <- round(lx/10,0)
(arima.out <- arima(x[1:nx], order=c(par6,par3,par7), seasonal=list(order=c(par8,par4,par9), period=par5), include.mean=par10, method='ML'))
(forecast <- predict(arima.out,par1))
(lb <- forecast$pred - 1.96 * forecast$se)
(ub <- forecast$pred + 1.96 * forecast$se)
if (par2 == 0) {
x <- exp(x)
forecast$pred <- exp(forecast$pred)
lb <- exp(lb)
ub <- exp(ub)
}
if (par2 != 0) {
x <- x^(1/par2)
forecast$pred <- forecast$pred^(1/par2)
lb <- lb^(1/par2)
ub <- ub^(1/par2)
}
if (par2 < 0) {
olb <- lb
lb <- ub
ub <- olb
}
(actandfor <- c(x[1:nx], forecast$pred))
(perc.se <- (ub-forecast$pred)/1.96/forecast$pred)
bitmap(file='test1.png')
opar <- par(mar=c(4,4,2,2),las=1)
ylim <- c( min(x[first:nx],lb), max(x[first:nx],ub))
plot(x,ylim=ylim,type='n',xlim=c(first,lx))
usr <- par('usr')
rect(usr[1],usr[3],nx+1,usr[4],border=NA,col='lemonchiffon')
rect(nx1,usr[3],usr[2],usr[4],border=NA,col='lavender')
abline(h= (-3:3)*2 , col ='gray', lty =3)
polygon( c(nx1:lx,lx:nx1), c(lb,rev(ub)), col = 'orange', lty=2,border=NA)
lines(nx1:lx, lb , lty=2)
lines(nx1:lx, ub , lty=2)
lines(x, lwd=2)
lines(nx1:lx, forecast$pred , lwd=2 , col ='white')
box()
par(opar)
dev.off()
prob.dec <- array(NA, dim=fx)
prob.sdec <- array(NA, dim=fx)
prob.ldec <- array(NA, dim=fx)
prob.pval <- array(NA, dim=fx)
perf.pe <- array(0, dim=fx)
perf.mape <- array(0, dim=fx)
perf.mape1 <- array(0, dim=fx)
perf.se <- array(0, dim=fx)
perf.mse <- array(0, dim=fx)
perf.mse1 <- array(0, dim=fx)
perf.rmse <- array(0, dim=fx)
for (i in 1:fx) {
locSD <- (ub[i] - forecast$pred[i]) / 1.96
perf.pe[i] = (x[nx+i] - forecast$pred[i]) / forecast$pred[i]
perf.se[i] = (x[nx+i] - forecast$pred[i])^2
prob.dec[i] = pnorm((x[nx+i-1] - forecast$pred[i]) / locSD)
prob.sdec[i] = pnorm((x[nx+i-par5] - forecast$pred[i]) / locSD)
prob.ldec[i] = pnorm((x[nx] - forecast$pred[i]) / locSD)
prob.pval[i] = pnorm(abs(x[nx+i] - forecast$pred[i]) / locSD)
}
perf.mape[1] = abs(perf.pe[1])
perf.mse[1] = abs(perf.se[1])
for (i in 2:fx) {
perf.mape[i] = perf.mape[i-1] + abs(perf.pe[i])
perf.mape1[i] = perf.mape[i] / i
perf.mse[i] = perf.mse[i-1] + perf.se[i]
perf.mse1[i] = perf.mse[i] / i
}
perf.rmse = sqrt(perf.mse1)
bitmap(file='test2.png')
plot(forecast$pred, pch=19, type='b',main='ARIMA Extrapolation Forecast', ylab='Forecast and 95% CI', xlab='time',ylim=c(min(lb),max(ub)))
dum <- forecast$pred
dum[1:par1] <- x[(nx+1):lx]
lines(dum, lty=1)
lines(ub,lty=3)
lines(lb,lty=3)
dev.off()
load(file='createtable')
a<-table.start()
a<-table.row.start(a)
a<-table.element(a,'Univariate ARIMA Extrapolation Forecast',9,TRUE)
a<-table.row.end(a)
a<-table.row.start(a)
a<-table.element(a,'time',1,header=TRUE)
a<-table.element(a,'Y[t]',1,header=TRUE)
a<-table.element(a,'F[t]',1,header=TRUE)
a<-table.element(a,'95% LB',1,header=TRUE)
a<-table.element(a,'95% UB',1,header=TRUE)
a<-table.element(a,'p-value
(H0: Y[t] = F[t])',1,header=TRUE)
a<-table.element(a,'P(F[t]>Y[t-1])',1,header=TRUE)
a<-table.element(a,'P(F[t]>Y[t-s])',1,header=TRUE)
mylab <- paste('P(F[t]>Y[',nx,sep='')
mylab <- paste(mylab,'])',sep='')
a<-table.element(a,mylab,1,header=TRUE)
a<-table.row.end(a)
for (i in (nx-par5):nx) {
a<-table.row.start(a)
a<-table.element(a,i,header=TRUE)
a<-table.element(a,x[i])
a<-table.element(a,'-')
a<-table.row.end(a)
}
for (i in 1:fx) {
a<-table.row.start(a)
a<-table.element(a,nx+i,header=TRUE)
a<-table.element(a,round(x[nx+i],4))
a<-table.element(a,round(forecast$pred[i],4))
a<-table.element(a,round(lb[i],4))
a<-table.element(a,round(ub[i],4))
a<-table.element(a,round((1-prob.pval[i]),4))
a<-table.element(a,round((1-prob.dec[i]),4))
a<-table.element(a,round((1-prob.sdec[i]),4))
a<-table.element(a,round((1-prob.ldec[i]),4))
a<-table.row.end(a)
}
a<-table.end(a)
table.save(a,file='mytable.tab')
a<-table.start()
a<-table.row.start(a)
a<-table.element(a,'Univariate ARIMA Extrapolation Forecast Performance',7,TRUE)
a<-table.row.end(a)
a<-table.row.start(a)
a<-table.element(a,'time',1,header=TRUE)
a<-table.element(a,'% S.E.',1,header=TRUE)
a<-table.element(a,'PE',1,header=TRUE)
a<-table.element(a,'MAPE',1,header=TRUE)
a<-table.element(a,'Sq.E',1,header=TRUE)
a<-table.element(a,'MSE',1,header=TRUE)
a<-table.element(a,'RMSE',1,header=TRUE)
a<-table.row.end(a)
for (i in 1:fx) {
a<-table.row.start(a)
a<-table.element(a,nx+i,header=TRUE)
a<-table.element(a,round(perc.se[i],4))
a<-table.element(a,round(perf.pe[i],4))
a<-table.element(a,round(perf.mape1[i],4))
a<-table.element(a,round(perf.se[i],4))
a<-table.element(a,round(perf.mse1[i],4))
a<-table.element(a,round(perf.rmse[i],4))
a<-table.row.end(a)
}
a<-table.end(a)
table.save(a,file='mytable1.tab')